
 ?Mathematical formulae have been encoded as MathML and are displayed in this HTML version using MathJax in order to improve their display. Uncheck the box to turn MathJax off. This feature requires Javascript. Click on a formula to zoom.
ABSTRACT
Concerns for fossil fuel price volatility, environmental pollution and energy inefficiency drive the formulation of energy policies aimed at attaining energy security. We use a theoretical framework which integrates key elements of energy security into the context of natural capital theory to investigate the causal relationship between Nasdaq clean energy stock price and a range of variables including oil price, natural gas prices, carbon price and energy efficiency. Our autoregressive distributed lag (ARDL) results reveal that clean energy stock price is jointly and individually explained by the variables representing some elements of energy security. Carbon price and energy efficiency emerged as the most important elements of energy security driving the on-going transition from conventional to clean energy sources. Consequently, governments should take environmental sustainability and energy efficiency very seriously when formulating energy policies in the pursuit of energy security and the way they stimulate substitutions between clean energy sources and hydrocarbons.
1. Introduction
Evidently, the world is experiencing a gradual paradigm shift from non-renewable energy sources, mainly fossil fuels, to renewable energy sources (Waziri, Hassan, and Kouhy Citation2018; Khan, Hou, and Le Citation2021a, Citation2021b). This shift is notably propelled by the drive to pursue sustainability (Costanza and Daly Citation1992; Missemer Citation2018; Hassan Citation2019b) and energy security (Winzer Citation2012). In the context of natural capital theory (NCT), as a key theory underpinning sustainable development, substitutability condition for sustainability is one of the key facilitators of this paradigm shift (van Geldrop and Withagen Citation2000; Hassan Citation2019a). As another critical driver of the paradigm shift, energy security is vigorously pursued by developed countries that are vulnerable to fossil energy price volatility and its consequent negative environmental impacts (Yergins Citation2006; Winzer Citation2012; Khan and Hou Citation2021b). To address these problems and ensure the attainment of optimal energy efficiency, many advanced economies formulate energy policies. Energy policies, mainly formulated at national level, are deliberate efforts put in place to strategically influence the elements of energy security such as hydrocarbon prices, energy efficiency and environmental sustainability, to ensure efficient energy supply and utilisation (Lucas, Francés, and González Citation2016; Galinis et al. Citation2020). In this regard, Winzer (Citation2012) enumerates efficiency, sustainability and energy prices as the principal pillars of the European Union’s energy policy. These policies are designed to influence energy consumption patterns in many advanced countries such that fossil fuel energy sources are replaced by clean energy sources. Furthermore, the outcomes of the implementation of energy policies targeting the pursuit of energy security manifest in the form of changes in energy-related variables such as clean energy stock performance, clean energy consumption, fossil fuel prices, fossil fuel consumption and energy efficiency.
Despite the importance of energy security in the context described above, only a few studies explore the topic in examining the link between fossil fuel prices and clean energy stock performance (see, Henriques and Sadorsky Citation2008; Kumar, Managi, and Matsuda Citation2012; Sadorsky Citation2012; Pham Citation2019). These studies generally highlight the importance of energy security in motivating their research. For instance, Henriques and Sadorsky (Citation2008) emphasise that energy security concerns such as rapidly diminishing supply; political instabilities in the oil and gas exporting countries and oil price volatility induce investments in clean energy companies’ stocks. Similarly, Kumar, Managi, and Matsuda (Citation2012) vaguely introduce energy security in their paper while providing background information and establishing the justification for their study. Additionally, when establishing the justification for his study, Sadorsky (Citation2012) mentions energy security as one of the key drivers which propel fast growth of the renewable energy segment of the overall energy sector. More recently, Pham (Citation2019) focuses on the evaluation of alternative energy sources which emerge to strengthen energy security and environmental wellbeing issues. However, none of these studies has gone into more depth in unpacking and incorporating energy security concerns within any specific theoretical framework to underpin their research. Following a careful review of the relevant literature; we identify three key elements of energy security (oil and gas prices, energy efficiency and environmental sustainability). We then integrate these elements into the context of NCT to develop a framework to underpin our study. As such, examining the role of energy security via its three key elements in stimulating a substitution between the conventional and clean energy sources is the key motivation for our study.
There has been a growing concern for energy security stemming from fossil fuel prices’ volatility and the adverse environmental impacts associated thereto. Fossil fuel prices represent the independent prices of the three hydrocarbons, namely crude oil, natural gas and coal (Song et al. Citation2019a, Citation2019b; Sun et al. Citation2019). Two dominant international oil prices, Brent and West Texas Intermediate (WTI), are mainly used as the benchmarks for the determination of crude oil prices across the world. While WTI dominates the American region, Brent is used by OPEC members, European countries and several other countries around the globe. Due to the high similarity between the two, they are often used interchangeably by researchers to represent global oil price. In this study, we use Brent oil futures to represent oil price to partly proxy for fossil fuel as an element of energy security. However, to represent the natural gas aspect, we employ natural gas prices from four gas markets. They include Henry Hub, National Balancing Point (NBP), Title Transfer Facility (TTF) and Zeebrugge (ZEE). Additionally, we develop and use a simple composite gas price index which integrates the prices from the three European natural gas markets (NBP, TTF and ZEE). Following this choice and the development of the composite gas price index, our study exhibits features which set it apart from the rest of the studies in the research area.
Another important motivation for our paper relates to the inclusion of carbon price as a potential determinant of clean energy stock performance. Within the literature occupied with the relationship between fossil fuel prices and clean energy stock performance, only Kumar, Managi, and Matsuda (Citation2012) include carbon price as a key explanatory variable. The authors, however, fail to document a significant relationship between carbon price and clean energy stock price. Like Kumar, Managi, and Matsuda (Citation2012), we also include carbon price to capture concern for environmental sustainability. However, our motivation for including the variable extends to identifying carbon price to represent environmental sustainability concern as a key element of energy security. Furthermore, carbon price represents an important link between energy security and NCT. Consequently, we suspect that a change in carbon price will trigger a substitution between clean energy and fossil fuels in an energy mix and a resultant change in clean energy stock price.
Furthermore, attaining energy efficiency is among the key objectives which drive the pursuit of energy security. Consistent with NCT, this stems from the fact that the current generation ought to be efficient in harnessing and utilising energy resources so that we do not encroach into the ability of future generations to benefit from these resources. These include renewable energy resources as Harte (Citation1995, 158) observes: ‘ … continued exploitation in excess of natural regeneration rate can turn potential renewable resources into non-renewable resources.’ This motivates our inclusion of the variable, clean energy efficiency, to represent energy efficiency. Also consistent with the relevant literature, we include the variable to control for the investors’ categorisation of clean energy companies as technology companies (Henriques and Sadorsky Citation2008; Kumar, Managi, and Matsuda Citation2012)
Therefore, informed by insights from NCT, this paper investigates whether the three elements of energy security identified above, which are operationalised by five variables (Brent oil price, natural gas price index, Henry hub price, carbon price and energy efficiency), jointly and/or individually explain variations in Nasdaq clean energy stock price. Thus, the purpose of the investigation is to establish whether the causal relationships stimulate substitutions between conventional and clean energy sources. The rest of the paper is organised as follows. Section 2 reviews the relevant literature and develops the theoretical framework for the study. Section 3 focuses on the methodology of the paper. Section 4 presents empirical results and these are discussed in the subsequent section 5. Section 6 presents our concluding remarks and policy implications.
2. Literature review and theoretical underpinnings
2.1. Energy security
Energy security became a matter of national concern and strategy since the early 1900s. For instance, during the 1st World War, United Kingdom had to rely on the insecure supply of petroleum from Persia to make its ships faster than those of Germany (Yergins Citation2006). During that period, the insecurity referred to was mainly related to uncertainties concerning the supply of oil, the inefficiency of coal and the safety of oil as a new source of power (Yergins Citation2006). Notably, these had remained the key elements of energy security until the incident of the initial oil crises of the 1970s occurred. Thus, modern concern for energy security was invoked by the first oil crises (Blum and Legey Citation2012) which specifically occurred in 1973 when the Arab members of OPEC placed an oil embargo on various advanced countries (Gasser Citation2020). This caused global oil price to shoot up by 300% – from $3 to $12 per barrel (Gasser Citation2020). The key lesson from this event is that the use of oil supply restriction as a political weapon exposed the vulnerability of advanced economies to energy insecurity.
Yergins (Citation2006) predicted that the challenge of energy security would escalate as the world’s energy markets became more integrated. Consistent with this prediction, energy security has become a complex and a multidimensional concept which lacks a specific definition applicable to all situations. For this reason, the concept has been described as blurred, lacks universal interpretation and is elusive (Checchi, Behrens, and Egenhofer Citation2009; Winzer Citation2012; Kruyt et al. Citation2009). Thus, Kruyt et al. (Citation2009, 2166) describe the concept as having ‘ … rather elusive nature and it is highly context dependent.’ For example, the perception of energy security by oil and gas net-energy-importing countries differs from the way net-energy-exporting countries view the concept. Consequently, the definition of energy security as the availability of energy sources at affordable prices (Abdo and Kouhy Citation2016; Song et al. Citation2019a, Citation2019b) applies to oil and gas net-importing countries. However, for the oil and gas exporting countries such as Iran, Nigeria and Saudi Arabia, energy security extends to include economic security where a decline in oil and/or gas price may lead to financial difficulties. It is imperative to clarify that our paper is concerned with the conception of energy security from the net-energy-importing countries’ perspective.
In their seminal paper, while trying to demonstrate the complex nature of energy security, Ang, Choong, and Ng (Citation2015) add dynamism to the context-dependent nature. The authors specifically derive seven key energy security themesFootnote1 from 83 energy security definitions. In this regard, Galinis et al. (Citation2020) highlight four principal elements in the provision of energy services, namely, affordability (price), efficiency, energy security and sustainability. Technically, the other three elements have a strong connection to energy security as their absence or weakness signals a concern for energy security. For example, if the affordability of oil is threatened by an excessive hike in its price, this indicates that oil-dependent countries are vulnerable to energy insecurity. However, on top of affordability and sustainability, Le and Nguyen (Citation2019) identify availability, accessibility and acceptability as three additional aspects of energy security. Furthermore, Matsumoto, Doumpos, and Andriosopoulos (Citation2018) contend that these elements are used by policymakers to form indicators which inform national energy policies.
From the foregoing discussion, a closer look at the relevant literature shows that oil and gas prices, energy efficiency and environmental sustainability have been variously recognised as important elements of energy security (Yergins Citation2006; Abdo and Kouhy Citation2016; Ang, Choong, and Ng Citation2015; Le and Nguyen Citation2019; Zaman and Kalirajan Citation2019; Galinis et al. Citation2020). In addition, these elements have been identified as parts of the critical factors studied, analysed and shaped to inform the formulation of energy policies in facilitating the provision of the needed energy supplies and services in an economy (Winzer Citation2012). In particular, our paper focuses on the relationship that may exist between such key elements of energy security as prices of fossil fuels (particularly, oil and gas), environmental sustainability and energy efficiency on the one hand, and clean energy stock price on the other hand.
2.2. Oil and gas price and clean energy stock performance nexus
On a broad spectrum, various studies have empirically examined the relationship between fossil fuel prices and clean energy stock performance, but results reported so far have remained mixed and rather inconclusive. Two principal measurement strategies for clean energy stock performance seem to be responsible for the mixed results evident in the area. In measuring clean energy stock performance, while most studies use price indexes (Henriques and Sadorsky Citation2008; Kumar, Managi, and Matsuda Citation2012; Sadorsky Citation2012; Managi and Okimoto Citation2013; Kocaarslan and Soytas Citation2019; Sun et al. Citation2019; Pham Citation2019), some others employ stock returns (Dutta Citation2017; Reboredo and Ugolini Citation2018; Kyritsis and Serletis Citation2019; Xia et al. Citation2019; Shao and Zhang Citation2020).
Apparently, those who use clean energy stock price indexes have mainly employed WilderHill Clean Energy Index and have consistently documented similar results. For instance, Henriques and Sadorsky (Citation2008) establish a weak positive relationship between oil price and clean energy stock price with causation flowing from oil price to alternative energy stock performance. Sadorsky (Citation2012) reports a similar but stronger positive relationship. An important implication drawn by Sadorsky (Citation2012, 254) from the significant positive relation they report between oil price and clean energy stock price is as follows. ‘The results of this paper show that a portfolio of clean energy stocks and oil futures can be built and that oil futures can be used to hedge an investment in clean energy stock.’ Similarly, Kumar, Managi, and Matsuda (Citation2012) report independent and significant positive effects of oil price and technology stock price on clean energy stock price, specifically noting that rising oil prices stimulate substituting clean energy sources for conventional sources. Taking structural break in the oil price into consideration, Managi and Okimoto (Citation2013) use Markov-switching VAR and document a significant positive relationship between oil price and clean energy stock price. Although Bondia, Ghosh, and Kanjilal (Citation2016) establish no-association between oil price and energy stock price in the long run, they document a significant positive relationship between the two variables in the short run. In the same vein, Kocaarslan and Soytas (Citation2019) examine the dynamic conditional correlation between oil price and clean energy stock performance and technology stock prices, and report a significant positive relationship. Also, Song et al. (Citation2019a, Citation2019b)’s results imply that crude oil price has a stronger positive impact on renewable energy stock performance than natural gas and coal prices.
However, in the category of studies that use stock price to measurement performance, Sun et al. (Citation2019) document a differing result. Thus, they analyse the effect of composite price index on the stock price of new energy companies and report a mild effect of the combined prices of the three fossil fuels on newly quoted energy stock prices. This deviant finding may be attributed to the fact that the authors use a price index different from WilderHill Clean Energy Index. Pham (Citation2019) is another study within this category that deviates from the dominant approach. Specifically, Pham (Citation2019) differs from the previous studies in two ways. Pham (Citation2019) is the only study, to the best of our knowledge, which uses the disaggregation of three Nasdaq OMX indexes in measuring clean energy stock performance. Secondly, the study reports varying relationships between indices in the renewable energy sub-sectors and oil price. A more recent study, also with a divergent result, conducted by Zhang, Cai, and Yang (Citation2020) reports heterogeneous relationships across quantiles and investment horizons regarding the effect of oil price on renewable energy stock performance. Unlike Henriques and Sadorsky (Citation2008), Zhang, Cai and Yang (Citation2020) find that oil price has a strong ability to predict renewable energy stock prices in the long run.
We encounter mixed results within the category of studies that employ stock returns to measure clean energy stock performance. For instance, Kyritsis and Serletis (Citation2019) establish absence of a statistically significant relationship between oil price uncertainty and clean energy stock returns. However, the authors document an asymmetric relationship between oil price and clean energy stock returns. In contrast, Dutta (Citation2017) discovers that oil price uncertainty has a significant positive impact on clean energy stock returns. Still, within the same category, Reboredo and Ugolini (Citation2018) examine the effect of quantile price fluctuations in oil, natural gas, coal and electricity on the quantiles of clean energy stock returns. The authors document evidence showing that while oil price appears to be the major determinant of clean energy stock return in the US, in the EU electricity price is the key determinant. However, the study by Shao and Zhang (Citation2020) focuses on the effect of oil price fluctuation on clean energy metal price returns and find that oil price has a positive spillover effect on seven clean energy metal stock returns.
Considering the overall category of studies that used price indexes, only four studies reported results divergent from the dominant positive relationship between oil price and clean energy stock price. However, Henriques and Sadorsky (Citation2008) is the only study that documented a weak positive relationship within the category of studies that specifically employed WilderHill Clean Energy Index. All other studies which used this index documented a significant positive relationship. In a different context, heterogeneous relationships across clean energy sub-sectors (Pham Citation2019) and quantile/investment horizons (Zhang, Cai, and Yang Citation2020) have been documented. The few studies that measured clean energy performance via returns reported results which are a mixture of significant positive, insignificant positive and heterogeneous (a combination of positive, negative, insignificant, symmetric and/or asymmetric). Evidently, the review in this section informs our conclusion that so far findings in the area have been rather inconclusive.
2.3. Theoretical underpinning: the natural capital theory (NCT)
Substitutability condition for sustainability is conceptualised within the context of NCT to explain the rationale behind the paradigm shift which underlies the on-going transition from non-renewable to renewable energy resources. Thus, in advocating for sustainability, NCT states that substituting the harnessing and consumption of exhaustible natural resources with renewable natural capital to the extent that we, at the very least, keep the aggregate stock of natural capital intact, facilitates sustainable development (Pearce Citation1988; Costanza and Daly Citation1992; Harte Citation1995; Ekins et al. Citation2003; Barbier Citation2019; Khan, Hou, and Le Citation2021a, Citation2021b). According to this theory, it is when we implement this that we are able to achieve our present needs without compromising the ability of future generations to achieve their needs (van Geldrop and Withagen Citation2000; Fenichel and Hashida Citation2019). On this note, Pearce (Citation1988) equates the attainment of sustainable development to ensuring the ‘constancy’ of natural capital stock. This implies the maintenance of natural capital at the level at which humanity meets it by never allowing it to depreciate (Kornafel and Telega Citation2020). Elaborating on the constancy of natural capital, Costanza and Daly (Citation1992, 37) note that ‘A minimum necessary condition for sustainability is the maintenance of the total natural capital stock at or above the current level.’
Various studies allude to the close substitution between fossil fuels and clean energy sources in articulating and discussing the causes and implications of the nexus between fossil fuel prices and clean energy stock performance (Henriques and Sadorsky Citation2008; Kumar, Managi, and Matsuda Citation2012; Xia et al. Citation2019; Kocaarslan and Soytas Citation2019; Song et al. Citation2019a, Citation2019b). For example, Henriques and Sadorsky (Citation2008) argue that higher oil price and shortages in its supply induce substituting fossil fuels with alternative energy sources. Similarly, the positive relationship hypothesised between oil price and alternative energy stock price by Kumar, Managi, and Matsuda (Citation2012) is premised on the substitutability between the two competing energy sources. In articulating the implications of their findings, Xia et al. (Citation2019) contend that fossil fuels and renewable energies have a strong substitution relationship. Similarly, the studies by both Managi and Okimoto (Citation2013) and Kocaarslan and Soytas (Citation2019) refer to fossil fuels and renewable energy sources as close substitutes.
The close substitution between the two competing energy sources, which underpins the relationship between fossil fuel prices and renewable energy stock prices (Managi and Okimoto Citation2013; Kumar, Managi, and Matsuda Citation2012), is certainly linked to the substitutability condition for sustainability. This is clearly advocated by the NCT via certain key elements of energy security. In reality, the substitution between fossil fuels and renewable energy sources is mainly driven by the elements of energy security such as energy prices, energy efficiency and environmental sustainability. Therefore, this paper argues that in the pursuit of energy security, a society substitutes renewable energy for fossil fuels in terms of production, consumption and investment. Generally, changes in the elements of energy security stimulate changes in the consumption, production and investments in clean energy. This translates into changes in clean energy stock performance (clean energy stock return or price).
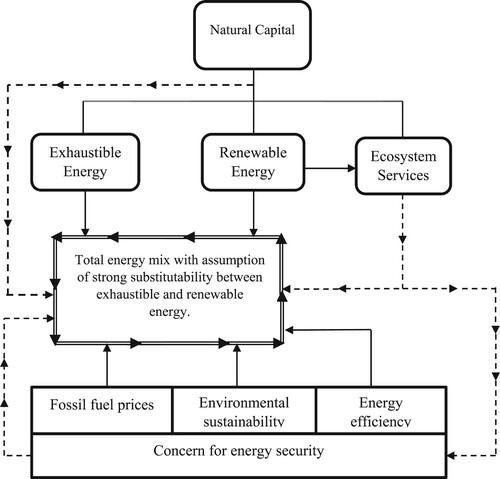
shows how NCT classifies energy resources into exhaustible, renewable and ecosystem services and advocates substitutability as an important condition for achieving sustainability (Costanza and Daly Citation1992; Harte Citation1995; Fenichel and Hashida Citation2019; Barbier Citation2019; Khan and Hou Citation2021b). The figure is a diagrammatic representation of our theoretical framework which advocates that in the pursuit of energy security, people, entities and governments substitute clean energy sources for fossil fuels. In this scenario, as shown in , the elements of energy security would in differing individual ways, and perhaps jointly, affect the substitution between non-renewable and renewable energies. Unlike oil and gas, clean energies such as solar, biofuel and wind energy do not have specific markets where their prices could be determined. We can only see the reflection of their prices via their stock performances. For instance, it is argued that when stock prices of clean energies are rising as prices of fossil fuels are increasing; it is an indication of a substitution away from fossil fuels to clean energy sources (Henriques and Sadorsky Citation2008; Kumar, Managi, and Matsuda Citation2012; Managi and Okimoto Citation2013).
Figure 1. Theoretical framework. Source: Authors’ creation, 2021.
3. Material and methods
In this section, we describe the nature of the dependent and the independent variables and the various sources from which data on these variables were gathered. Next, we present a statistical description of each variable in the time-series dataset. Finally, we specify the appropriate time-series regression model based on the results of the conventional and breakpoint unit root tests.
3.1. Variables and data sources
3.1.1. Clean energy stock price index (CEI)
CEI, as the dependent variable in this study, is one of the key indexes which belong to Nasda-OMX Green Economy Sector Index Family. It tracks the price-related performance of companies from around the world included in the Nasdaq-OMX Green Economy Index.Footnote2 According to Nasdaq (Citation2015, 9) ‘Clean Energy Focused Index is designed to track sectors of the green economy specifically enabling the advancement of energy generation via non-fossil-based sources inclusive of the sector’s renewable energy generation, clean energy efficiency, advanced materials and bio/clean fuels.’ The index began at the base value of 1000 on 10th October 2010. Data on this variable were collected from the Nasdaq Global Indexes.
3.1.2. Oil price (OPR)
We use Brent oil futures to measure crude oil price. Choosing this price is informed by its wide usage as a benchmark in the international oil markets located in the Middle East, Europe and Africa. Brent is also used as the benchmark for pricing by the OPEC member countries considered as a powerful group that plays a significant role in the determination of international oil price. Brent crude oil is very similar to West Texas Intermediate (WTI) as the two are denominated in US dollar; are both light and their prices are highly correlated. Daily data on both Brent and WTI prices were collected from Investing.com.
3.1.3. Gas price index (GPI) and Henry Hub natural gas price (HUB)
Unlike the two dominant international crude oil prices (Brent and WTI), international markets for natural gas are segmented and less unified (de Jong and Schneider Citation2009). However, there are four important natural gas markets to which most international natural gas prices are benchmarked. They are Henry Hub (HUB) (United States), National Balancing Point (NBP) (United Kingdom), Title Transfer Facility (TTF) and Zeebrugge (ZEE) (Continental Europe). Daily data on HUB price were collected from the US Energy Information Administration (EIA). However, daily data on NBP, ZEE and TTF prices were collected from Energy Market Price. To avoid multicollinearity, we develop a simple composite price index which integrates the daily spot prices from the four markets into one. More specifically, we follow the steps outlined below to develop the gas price index.
In the first step, we calculate and examine the correlation amongst the four prices pair-wise. With correlation coefficient values of 0.97 (NBP and TTF), 0.99 (NBP and ZEE) and 0.97 (TTF and ZEE), we establish that prices from the three European markets are highly correlated. An examination of their graphical representations shows high level of similarity as well. However, with Pearson’s correlation coefficients of 0.53 (HUB and NBP), 0.47 (HUB and TTF) and 0.54 (HUB and ZEE), it is evident that Henry Hub price is quite different from the prices in NBP, TTF and ZEE markets. In the second step, we express the prices from the three European markets on the same scale such that the value of each price ranges between 0 and 1 by dividing each price by the maximum value in the series. The result of this exercise, not report here, confirms that prices in NBP, ZEE and TTF reached their maximum values, represented by the value 1, on the same date: 28th March 2013. But on this date, the value of HUB was 0.6544. We take a simple average of the scales from the three European markets to generate the GPI and consider the price from the Henry hub market as a separate variable.
3.1.4. Carbon emission futures (CEF)
Carbon emission futures are price quotations of carbon emission reduction contracts existing in the emissions trading markets. The quotation is a derivative whose contract price reflects the price at which carbon emission reductions will be bought and sold. A rise in CEF suggests that intensive-carbon-emission firms are buying more carbon emission reductions to meet their emission reduction targets (Hassan and Kouhy Citation2014; Hassan Citation2020). This encourages cleaner production including greater usage of clean energy sources. However, falling CEF prices imply the reverse. Daily data on this variable were sourced from Investing.com.
3.1.5. Clean energy efficiency (CEE)
In the main, we include the Nasdaq Energy Efficiency Index to represent the efficiency element of energy security. The key components of this index suggest an intensive use of advanced technology. The index started at the base value of 1000 on 13th October 2010. This very date marks the start date of the period covered by our study. Additionally, technology companies’ stock performance is usually included to control for the investors’ recognition of clean energy firms as companies that use highly advanced technology. As energy efficiency index reflects the use of advanced technology by clean energy companies (Henriques and Sadorsky Citation2008; Kumar, Managi, and Matsuda Citation2012), we include this index to more directly control for this feature. Daily data concerning this variable were collected from Nasdaq Global Indexes.
3.1.6. Volume of clean energy stock traded (VTD)
The inclusion of the quantity of clean energy stock bought and sold on the floor of Nasdaq security market is based on the reasoning that the number of stock traded on daily basis may affect the dependent variable. Additionally, the volume traded may be affected by fossil fuel prices and the price of CEF. Data on this variable were also collected from the Nasdaq Global Index.
3.2. Data description
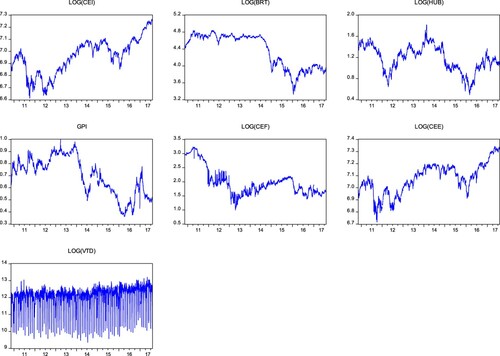
In this section, we present descriptive statistics, line graphs and Pearson’s correlation matrix to provide information on the nature of our time-series dataset. While presents the mean, median, maximum and standard deviation for each variable; presents the line graph for each variable and provides information on pair-wise Pearson’s correlations. All the variables, except GPI which is in a ratio form, were transformed to natural logarithms before computing the descriptive statistics and generating the line graphs.
Table 1. Descriptive statistics.
Table 2. Correlation matrix.
A careful observation of the line graphs in shows that six out of the seven variables are likely to be integrated of order one, I(1). However, the logarithmic form of VTD seems likely to be integrated of order 0, I(0).
3.3. Model specification
Consistent with the previous relevant literature, clean energy performance as a function of such regressors as fossil fuel prices and other control variables is generally modelled as follows:
(1)
(1) where
denotes the alternative energy stock performance in question;
represents a vector of fossil fuel prices (such as crude oil, natural gas and coal) and
a vector of other relevant control regressors. While
is the time-invariant constant,
denotes the coefficients of the regressors in the model,
.
Kumar, Managi, and Matsuda (Citation2012) introduce carbon price as an additional explanatory variable in the model such that equation (1) becomes:
(2)
(2) where
represents the carbon price and
.
Recently, McNown, Sam, and Goh (Citation2018) assess the application of the Pesaran, Shin, and Smith’s (Citation2001) famous ARDL model and claim to identify some problems associated with its implementation by various studies. The authors call the attention of researchers to the fact that if not implemented with caution, the Pesaran, Shin, and Smith (Citation2001) bounds cointegration test in ARDL may lead to incorrect conclusions. They imply two options researchers may choose from to produce ARDL cointegration test results that are not misleading. In the first option, McNown, Sam, and Goh (Citation2018) clarify and remind us that Pesaran, Shin, and Smith (Citation2001) lay down three conditions that must be satisfied before we conclude that two or more variables are cointegrated. These conditions are as follows.
The dependent variable is known to be an I(1) with a high degree of certainty.
Both the F-bounds test on the lagged levels of all variables and the t-bounds test on the lagged level of the dependent variable reject the null hypothesis of ‘no level relationship.’
There is no feedback at level from the dependent to the independent variables so that the independent variables are weakly exogenous.
However, McNown, Sam, and Goh (Citation2018) conclude that treating regressors as dependent variables in a system of ARDL equations (see, for example, Marques, Fuinhas, and Menegaki Citation2016) thereby making them weakly endogenous does not affect the validity of ARDL results under Pesaran, Shin, and Smith (Citation2001). Consequently, this rules out the need to meet the requirement of condition (iii).Footnote3 The second option relates to the use of the bootstrap ARDL method introduced by McNown, Sam, and Goh (Citation2018). In this paper, we choose the first option and use relevant econometric tests to determine whether conditions (i) and (ii) outlined above are violated or not.
3.4. Unit root tests
Establishing the stationarity status of each variable in a time-series dataset is among the key factors to consider in determining the appropriate regression model to use. To ensure that we satisfy the first condition stated in 3.3 above, we conduct four unit-root tests on the independent and the dependent variables. Thus, we subject all the variables in our model to Augmented Dickey-Fuller (ADF) test, Phillips-Perron (PP) test, KwiatKowski-Phillips-Schmidt-Smith (KPSS) test and the Zivot and Andrews (Citation1992) breakpoint unit root test.
presents three unit root tests that are known to perform well with large samples (Diebold and Kilian Citation2000). Results reported in the table reveal that all the three tests show that six out of the seven variables, including lnCEI, are I(1). However, lnVTD is shown to be an I(0) variable by all the three tests.
Table 3. Conventional unit root tests.
A careful examination of lnOPR and lnCEF reveals that they are characterised by significant structural breaks. Other variables which may be characterised by structural breaks, but not as pronounced as those of lnOPR and lnCEF, include lnHUB, lnCEI and lnCEE. Tursoy and Faisal (Citation2018) remind us that the conventional unit root tests such as ADF, PP, NG-Perron and KPSS do not take structural breaks into consideration in processing data for variables to produce the relevant test statistics. For this reason, the tests might produce misleading results if the variables being tested are characterised by structural breaks (Perron Citation1997; Murthy and Okunade Citation2016; Sun, Zhang, and Xu Citation2017). Consistent with Sun, Zhang, and Xu (Citation2017) and Tursoy and Faisal (Citation2018), we conduct and present Zivot-Andrews breakpoint unit root test for each variable and the results are presented in .
Table 4. Zivot-AndrewsTable Footnotea breakpoint unit root tests.
The breakpoint unit root test serves three purposes in this study. Firstly, it enables the confirmation that none of the variables is I(2). Secondly, it assists in double-checking that the dependent variable, lnCEI, is definitely I(1) and not I(0). Thirdly, it helps to identify lnOPR and lnCEF as the variables that are likely stationary at level due to the presence of significant structural breaks. Given the results relating to the third purpose, we generate two dummy variables, BRK1 and BRK2, for inclusion in our ARDL model to account for the significant breaks associated with lnOPR and lnCEF.
As all the three conventional unit root tests (ADF, PP and KPSS) and the Zivote-Andrews breakpoint unit root test have shown that the dependent variable, lnCEI, is definitely I(1), we believe that we satisfy the condition on the dependent variable being strictly I(1). The results of the three conventional unit root tests presented in show a mixture of six I(1) and one I(0) variables, and the breakpoint unit root test results in show a mixture of four I(1), and three I(0) cases. We interpret this as a strong indication of the appropriateness for using ARDL to estimate our model.
3.5. The ARDL model specification
Given the standard ARDL specification (see, Pesaran, Shin, and Smith Citation2001; Narayan Citation2004), we specify the following model:
(3)
(3) where
represents the first difference operator;
represents the natural logarithm operator and
are the variables’ lag limits.
After estimating the ARDL model specified in equation (3), its goodness of fit is assessed and subjected to the relevant diagnostic tests. We then proceed with the long-run cointegration tests, for the model is found to be structurally and dynamically stable; its residuals are not serially correlated and it does not suffer from severe heteroskedasticity. In doing so, we, first, conduct bounds F-test on the lagged levels of the dependent and the independent variables. Secondly, we conduct bounds t-test on the lagged level of the dependent variable only. As both bounds tests (the F-test and the t-test) reject the ‘no level relationship’ null hypothesis, we proceed to estimate the long-run and the short-run models (see, McNown, Sam, and Goh Citation2018).
Thus, the long-run model, normally used to estimate level relationships, is specified as follows.
(4)
(4)
However, the short run error correction model is specified as follows.
(5)
(5) where
represent the stochastic error terms;
represents the speed of adjustment from short-run shocks back to long-run relationships and
is the coefficients of the
in equations (5) and all other parameters as previously defined.
4. Empirical results
4.1. The base-line ARDL model
We manoeuvre through the standard vector autoregressive (VAR) model to determine the maximum lags to include in the ARDL estimation for each variable. This is done via the lag selection criteria option available under the standard VAR. The summary of the maximum lag lengths for the VAR model and each variable are presented in below.
Tables 5. Maximum lags for the variables.
shows that the optimal lag length for the standard VAR model is 6. Similarly, the table reports the optimal lag length of the dependent variable (lnCEI) as 6 and the highest maximum lag length amongst the independent variables as also 6 (lnCEE’s lag length). We, therefore, input 6 in the EVIEWS ARDL equation estimation option for both the dependent variable and the regressors to estimate our underlying ARDL model. The summary of the estimated results for the selected ARDL model is presented in . The model exhibits very impressive goodness of fit with an adjusted R-squared of 99.98% and an overall model F-statistic significant at below 1% alpha level.
Table 6. Summary of the underlying ARDL model.
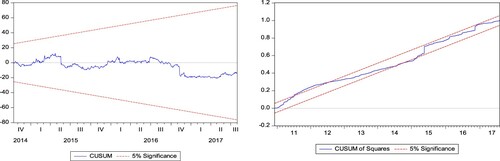
It is evident from the results presented in that our model is free from serial correlation. A careful observation of will show that our CUSUMSQ graph is not as perfectly stable as the CUSUM graph, but most of the time it remains within the 5% upper and lower bounds. Thus, whenever the CUSSUMSQ strays off and appears on or slightly beyond the boundary, it quickly returns back inside. CUSUMSQs with similar behaviour were reported by previous studies. For instance, Rahman and Kashem (Citation2017) report a similar CUSUMSQ plot which is slightly outside the 5% bounds for a brief while. Similarly, two of the CUSUMSQs reported by Ozturk and Acaravci (Citation2011) are at some points slightly outside the 5% boundaries. However, both studies concluded that their models were in general stable, because their CUSUMSQs were only slightly outside the 5% lines and that all other relevant tests confirm the stability of their ARDL models. Therefore, similar to these studies, except for the slight instability portrayed by the CUSUMSQ, all other relevant tests for stability including Ramsey Reset test, CUSUM test and recursive coefficients (not reported here) confirm the coefficients' and dynamic stabilities of our ARDL model.
Figure 2. Line graphs.
The insignificance of the Ramsey RESET test statistic is an indication that no important variable has been omitted and that the model is correctly specified. We report two tests for heteroskedasticity with White test showing absence of heteroskedasticity while the ARCH test statistic appears significant at 5% showing evidence of non-constant variance. For this reason, we estimate our baseline ARDL model while invoking heteroskedasticity consistent standard errors (see, footnote ‘a’ in CitationTable 6).
Figure 3. CUSUM and CUSUMSQ.
4.2. Bounds cointegration test
In this section, we present two bounds cointegration tests to establish whether the dependent variable, lnCEI, is having a long-run cointegrating relationship with any of the independent variables in the model. The first bounds test is a joint F-test on the lagged levels of the dependent and the independent variables (Pesaran, Shin, and Smith Citation2001; McNown, Sam, and Goh Citation2018). The second test is a t-test on the coefficient of the lagged level of the dependent variable only.
The results reported in test the null hypothesis against the alternative hypothesis
. Since the joint F-statistic exceeds the upper critical value at 1% level of significance, we, therefore, reject the null hypothesis of ‘no level relationship’ and conclude that lnCEI has a significant level relationship with at least one of the regressors.
Table 7. Joint F-bounds test on the lagged levels of all variables.
To test the significance of the coefficient on the lagged level of the dependent variable, we present the result of the bounds t-test in . The t-statistic tests the null hypothesis against the alternative hypothesis
. As the t-statistic falls outside the upper bound at 1% level of significance, we reject the ‘no level relationship’ null hypothesis. This reinforces the bounds F-test result and we, therefore, conclude that lnCEI is cointegrated with at least one regressor in the model.
Table 8. t-bounds test on the lagged level of the dependent variable.
4.3. Long-run relationships
Following the rejection of the ‘no level relationship’ null hypothesis by both the joint F-test and t-test, we establish the existence of cointegration relationship between lnCEI and, at least, one of the independent variables in our model. This econometric evidence informs our estimation of the long-run level relationships between lnCEI and the rest of the independent variables as presented in . The results in the table show that all the independent variables are individually significantly associated with lnCEI. Thus, the coefficients of lnHUB, lnCEF and lnCEE are individually positive and statistically significant.
Table 9. Long-run relationships.
Conversely, however, the coefficients of lnOPR, GPI and lnVTD are negative and individually statistically significant.
4.4. Short-run dynamics
The short-run model is an error correction model which presents the dynamic relationship between the dependent and the independent variables not accounted for by the long-run model. It estimates the first-difference stationery relationship between the dependent and the independent variables. Unlike the long-run level model, it includes the lags of the dependent and the independent variables.
Results in present the relationships between ΔlnCEI and the independent variables which appear in the main ARDL model at one or more lags. Thus, lnHUB and GPI which appear at 0 lag in the underlying ARDL model are excluded from the error correction model. Therefore, only lnOPR, lnCEF and lnCEE appear in the results of the short-run error correction model in . Evidently, the coefficients of all the three variables are positive and statistically significant.
Table 10. Short-run dynamics.
4.5. Error-correction-based Granger causality
Granger causality tests the pair of the null hypotheses that does not cause
and
does not cause
through a pair of equations (Rahman and Kashem Citation2017). However, Odhiambo (Citation2009) contends that the conventional Granger causality test may not be appropriate in an ARDL environment and recommends the use of error-correction-based Granger causality test. Therefore, following Odhiambo (Citation2008) and Tursoy and Faisal (Citation2018), we use the Granger causality approach which incorporates the error-correction term into each equation in the pair. However, we only estimate the Granger causality between lnCEI and lnCEE, as we only encounter evidence of cointegration in this case (see, Odhiambo Citation2009; Rahman and Kashem Citation2017). In this regard, the relevant pair of the error-correction-based Granger causality equations is presented as follows.
lnCEI and lnCEE
(6)
(6)
(7)
(7)
presents the types of causalities (short-run, long-run and joint-strong) usually estimated within the framework of ARDL. The results of the three variations of the error-correction-based Granger causality tests in show that long-run causality flows jointly and individually from OPR, HUB, GPI, CEF and CEE to CEI. It is also evident from the table that there is a short-run causality running from CEF and CEE to CEI. Thus, apart from CEF and CEE, none of the regressors Granger causes CEI in the short run. Furthermore, there is a causal flow running from CEI back to CEE and this implies bidirectional causality between CEE and CEI in both the short and the long run.
Table 11. Error-correction-based Granger causality.
5. Discussion of results
The theoretical framework we have designed and used in this study, by integrating energy security elements into the context of NCT, is particularly unique. The framework advocates that oil and natural gas prices, energy efficiency and carbon price individually and jointly explain the substitution between conventional and clean energy sources. Our study particularly argues that this is evident in changes in clean energy stock performance.
We document a significant relationship between oil price and clean energy stock price in both the short run and the long run. In the short run, the stationary oil price at first difference and its first lag are significantly positively related to clean energy stock price. Consistent with NCT, this implies a close substitution between oil and clean energy sources. Our result fails to establish causation from oil price to clean energy stock price in the short run. Conversely, however, our long-run level model reveals a significant negative relationship between the two variables with causation flowing from oil price to clean energy stock price. This is consistent with the finding reported by Bondia, Ghosh, and Kanjilal (Citation2016). The possible explanation that could be offered here is that the on-going transition from oil to clean energy sources might be one of the key reasons for the incidences of a couple of crashes in oil price in recent times. Thus, as clean energy is substituted for oil, it is expected that the stock performance of clean energy will increase and the price of oil will fall. This result is particularly consistent with the finding documented by Kocaarslan and Soytas (Citation2019), especially concerning the variation in the nature of the relationship from short to long run.
Two measures of natural gas price, namely HUB and GPI, are employed in this study. As the price from the Henry Hub market is starkly different from the prices in NBP, TTF and ZEE, we include HUB as a separate gas price in our ARDL model. However, because prices in NBP, TTF and ZEE are highly similar in terms of behaviour and structure, we integrate them to form a simple composite price index (GPI). Incidentally, both variables are excluded from the error correction model because they are included in the main ARDL model at 0 lag. Therefore, we only encounter the variables featuring in the long-run model with HUB exhibiting a significant positive relationship with CEI, and GPI a significant negative one. Evidence from the causality test confirms a causal flow from both variables to CEI. The positive relationship between HUB and CEI implies that in the US, a substitution away from natural gas to clean energy sources takes place over the long run as the price of natural gas increases leading to a better clean energy stocks performance. The reverse may hold as the price of natural gas in the region falls. However, the significant negative relationship between GPI and CEI suggests that in Europe moving away from the consumption of natural gas by transitioning over to clean energy sources raises clean energy stock price and lower the prices of natural gas in the three markets. This finding is closely related to the significant positive association between CEF and CEI discussed in the next paragraph.
Carbon price is significantly positively associated with CEI in both the short and the long run, and it Granger causes CEI over the two timeframes. This result suggests that progress in attaining environmental sustainability raises the price of carbon emission futures and this, in turn, propels a transition to clean energy sources and a boost in clean energy stock price. Thus, CEF is one of the major factors that stimulate increases in clean energy stock price. This finding is inconsistent with the result of the insignificant relationship between carbon price and clean energy stock price reported by Kumar, Managi, and Matsuda (Citation2012).
The variable, energy efficiency, is included to play a dual role in this study. Its first role is to proxy for energy efficiency as an important element of energy security. In this regard, CEE is significantly positively associated with CEI in both the short run and the long run. In addition, the two variables are cointegrated and the causal flow between them is bidirectional. This implies that as an important element of energy security, CEE drives substituting clean energy for fossil fuels and in so doing leads to a rise in the prices of clean energy stocks. Its second role is to serve as a control for the high-level similarity between clean energy stocks and technology companies’ stocks. In this regard, and consistent with the previous literature (see, Henriques and Sadorsky Citation2008; Kumar, Managi, and Matsuda Citation2012; Managi and Okimoto Citation2013), the short- and long-run significant positive relationships between CEE and CEI imply that investors consider clean energy companies as advanced technology companies, and therefore, treat their stocks as such.
6. Conclusion and policy implications
We develop and use a theoretical framework which integrates concerns for energy security into the context of NCT to underpin our study. Three important elements of energy security (fossil fuel prices, energy efficiency and environmental sustainability) are shown to stir up substitutions between fossil fuels and clean energy sources. The result of this stimulation manifests as changes in the price of clean energy stock. Unlike hydrocarbon energy sources, clean energy sources do not have a specific market within which their prices could be ascertained. Therefore, clean energy stock quotations or indexes existing within stock markets may be the only means through which we can observe the reflection of changes in clean energy values. For this reason, clean energy stock prices quoted in the Nasdaq capital market are used to measure the values of clean energy sources. On this note, we use ARDL which accounts for structural breaks to investigate the causal relationship between the five variables (OPR, HUB, GPI, CEF and CEE) representing the three elements of energy security (oil and gas prices, environmental sustainability and energy efficiency), and clean energy stock price.
Firstly, we document that the five variables representing the three elements significantly jointly explain variations in clean energy stock price. However, relationships with clean energy stock price at individual levels vary across the five variables. Carbon emission futures and energy efficiency emerged as the most important elements of energy security that explain variations in clean energy stock price in both the short and the long run. This implies that individuals, companies and governments should take environmental sustainability and energy efficiency very seriously in their pursuit of energy security and the way they substitute clean energy for oil and gas or vice versa. Secondly, on the link between oil price and clean energy stock price, the relationship appears positive and explains energy substitution which could be in favour of either energy source. However, this positive relation re-adjusts back to a negative relationship in the long run indicating a significant transition away from oil to clean energy sources. Thirdly, our results show that the relationship between natural gas prices and clean energy stock price in Europe differs from such a relationship in the US. In the US, a rise in the Henry Hub natural gas price stimulates changes in the substitution between natural gas energy and clean energy source in favour of the latter and this raises the prices of clean energy stocks. However, in Europe including the UK, it is the transitioning to clean energy sources, induced by progress in environmental sustainability, that drives down the natural gas prices in NBP, TTF and ZEE markets. The fall in prices in the three markets, in turn, signals a rise in clean energy stock price.
Finally, we end the conclusion by outlining three important implications of our findings. Firstly, our findings suggest that elements of energy security, most especially carbon emission and energy efficiency, are important drivers of the on-going energy transition from conventional to clean energy sources. This means that provision of clean and efficient energy in ensuring the environmental well-being of the planet, earth, is considered important both at present and in future. Secondly, when formulating energy policies which incorporate energy security concerns, governments should carefully consider and stimulate the elements of energy security that are relevant to their respective economies. This is because our study has shown that the variables representing the elements of energy security are important stimulators of the on-going transition to cleaner energy sources. Furthermore, this will facilitate the realisation of energy policy objectives; for example, achieving environmental sustainability, encouraging investments in clean energy stocks or hedging against fossil fuel prices volatility. Thirdly, when formulating strategies for the flotation of their stocks in any stock market, clean energy companies should carefully consider the joint and individual effects of oil price, relevant gas prices, carbon price and energy efficiency on clean energy stock prices. For, it is evident that these variables operationalise the behaviour of the key elements of energy security as they affect clean energy stock price. This becomes pertinent with investors’ increasing ethical consciousness of the need for corporations to demonstrate sustainable practices and behaviours. This signifies the need for corporations listed on international capital markets to incorporate United Nation’s sustainable development goals into their missions and operations.
GSOL_1986043_Appendixmaterial
Download MS Word (914.3 KB)Acknowledgement
The authors are grateful to two anonymous reviewers for their insightful and helpful comments. They also wish to appreciate Dr. Hafez Abdo for his encouragement and well wishes.
Disclosure statement
No potential conflict of interest was reported by the author(s).
Data availability statement
Data used in this paper were obtained from the following sources:
Clean Energy Stock Price (CEI): Daily data on this variable were collected from Nasdaq Global Indexes (NASDAQ OMX Green Economy Family). https://indexes.nasdaqomx.com/Index/History/GRNCLNFO.
Clean Energy Efficiency (CEE): Daily data on this variable were collected from Nasdaq Global Indexes (NASDAQ OMX Green Economy Family): https://indexes.nasdaqomx.com/Index/History/GRNENEF
Brent (OPR): Daily data on this variable were collected from investing.com – https://www.investing.com/commodities/brent-oil-historical-data
Carbon Emission Futures (CEF): Data obtained from investing.com – https://www.investing.com/commodities/carbon-emissions-historical-data
Henry Hub Natural Gas price (HHUB): Daily data for HUB price were collected from the US Energy Information Administration (EIA). https://www.eia.gov/dnav/ng/hist/rngwhhdD.htm
Gas Price Index (GPI). Daily data on NBP, ZEE and TTF prices were collected from Energy Market Price: https://www.energymarketprice.com/?act=ps&pid=80&prid=4.
Volume of clean energy stock traded (VTD): Daily data on this variable were collected from Nasdaq Global Indexes (NASDAQ OMX Green Economy Family). https://indexes.nasdaqomx.com/Index/History/GRNCLNFO.
Notes
1 The themes include availability, infrastructure, prices, societal effect, environment, governance and efficiency (see, Ang, Choong, and Ng Citation2015).
2 These are indexes whose computations are based on market capitalizations.
3 On this note, McNown, Sam, and Goh (Citation2018, 10) state that ‘One of the objectives of this study is to evaluate the performance of the ARDL bounds test when the weakly exogenous regressors assumption is violated. Based on Monte Carlo simulation evidence presented here, it is found that the tests underlying the PSS ARDL bounds testing approach are not affected by the violation of this assumption’.
References
- Abdo, H., and R. Kouhy. 2016. “Readings in the UK Energy Security.” Energy Sources, Part B: Economics, Planning, and Policy 11 (1): 18–25.
- Ang, Beng Wah, Wei Lim Choong, and Tsan Sheng Ng. 2015. “Energy Security: Definitions, Dimensions and Indexes.” Renewable and Sustainable Energy Reviews 42: 1077–1093.
- Barbier, E. B. 2019. “The Concept of Natural Capital.” Oxford Review of Economic Policy 35 (1): 14–36.
- Blum, H., and L. F. Legey. 2012. “The Challenging Economics of Energy Security: Ensuring Energy Benefits in Support to Sustainable Development.” Energy Economics 34 (6): 1982–1989.
- Bondia, R., S. Ghosh, and K. Kanjilal. 2016. “International Crude Oil Prices and the Stock Prices of Clean Energy and Technology Companies: Evidence from Non-Linear Cointegration Tests with Unknown Structural Breaks.” Energy 101: 558–565.
- Checchi, A., A. Behrens, and C. Egenhofer. 2009. Long-Term Energy Security Risks for Europe: A Sector-Specific Approach (Vol. 309). CEPS, Brussels.
- Costanza, R., and H. E. Daly. 1992. “Natural Capital and Sustainable Development.” Conservation Biology 6 (1): 37–46.
- de Jong, C., and S. Schneider. 2009. “Cointegration Between Gas and Power Spot Prices.” The Journal of Energy Markets 2 (3): 27–46.
- Diebold, F. X., and L. Kilian. 2000. “Unit-Root Tests are Useful for Selecting Forecasting Models.” Journal of Business & Economic Statistics 18 (3): 265–273.
- Dutta, A. 2017. “Oil Price Uncertainty and Clean Energy Stock Returns: New Evidence from Crude Oil Volatility Index.” Journal of Cleaner Production 164: 1157–1166.
- Ekins, P., S. Simon, L. Deutsch, C. Folke, and R. De Groot. 2003. “A Framework for the Practical Application of the Concepts of Critical Natural Capital and Strong Sustainability.” Ecological Economics 44 (2–3): 165–185.
- Fenichel, E. P., and Y. Hashida. 2019. “Choices and the Value of Natural Capital.” Oxford Review of Economic Policy 35 (1): 120–137.
- Galinis, A., L. Martišauskas, J. Jääskeläinen, V. Olkkonen, S. Syri, G. Avgerinopoulos, and V. Lekavičius. 2020. “Implications of Carbon Price Paths on Energy Security in Four Baltic Region Countries.” Energy Strategy Reviews 30: 100509.
- Gasser, P. 2020. “A Review on Energy Security Indices to Compare Country Performances.” Energy Policy 139: 111339.
- Harte, M. J. 1995. “Ecology, Sustainability, and Environment as Capital.” Ecological Economics 15 (2): 157–164.
- Hassan, A. 2019a. “Do Renewable Energy Incentive Policies Improve the Performance of Energy Firms? Evidence from OECD Countries.” OPEC Energy Review 43 (2): 168–192.
- Hassan, A. 2019b. “Verbal Tones in Sustainability Assurance Statements: An Empirical Exploration of Explanatory Factors.” Sustainability Accounting, Management and Policy Journal 10 (3): 427–450.
- Hassan, A. 2020. “Dealing with Vulnerability to Carbon Emission from Gas Flaring: The Roles of Transparency and Utilisation Policies in Nigeria.” OPEC Energy Review 44 (4): 369–403.
- Hassan, A., and R. Kouhy. 2014. “Evaluating Gas-Flaring-Related Carbon Emission Performance in the Nigerian Upstream Sector: A Comparison of Duo Methods.” African Journal of Economic and Sustainable Development 3 (3): 254–271.
- Henriques, I., and P. Sadorsky. 2008. “Oil Prices and the Stock Prices of Alternative Energy Companies.” Energy Economics 30 (3): 998–1010.
- Khan, I., and F. Hou. 2021b. “The Dynamic Links Among Energy Consumption, Tourism Growth, and the Ecological Footprint: The Role of Environmental Quality in 38 IEA Countries.” Environmental Science and Pollution Research 28 (5): 5049–5062.
- Khan, I., F. Hou, and H. P. Le. 2021a. “The Impact of Natural Resources, Energy Consumption, and Population Growth on Environmental Quality: Fresh Evidence from the United States of America.” Science of the Total Environment 754: 142222.
- Khan, I., F. Hou, A. Zakari, and V. K. Tawiah. 2021b. “The Dynamic Links Among Energy Transitions, Energy Consumption, and Sustainable Economic Growth: A Novel Framework for IEA Countries.” Energy 222: 119935.
- Kocaarslan, B., and U. Soytas. 2019. “Dynamic Correlations Between Oil Prices and the Stock Prices of Clean Energy and Technology Firms: The Role of Reserve Currency (US Dollar).” Energy Economics 84: 104502.
- Kornafel, M., and I. Telega. 2020. “Dynamics of Natural Capital in Neoclassical Growth Model.” International Journal of Sustainable Economy 12 (1): 1–24.
- Kruyt, B., D. P. van Vuuren, H. J. de Vries, and H. Groenenberg. 2009. “Indicators for Energy Security.” Energy Policy 37 (6): 2166–2181.
- Kumar, S., S. Managi, and A. Matsuda. 2012. “Stock Prices of Clean Energy Firms, Oil and Carbon Markets: A Vector Autoregressive Analysis.” Energy Economics 34 (1): 215–226.
- Kyritsis, E., and A. Serletis. 2019. “Oil Prices and the Renewable Energy Sector.” The Energy Journal 40: 337–363. (The New Era of Energy Transition).
- Le, T. H., and C. P. Nguyen. 2019. “Is Energy Security a Driver for Economic Growth? Evidence from a Global Sample.” Energy Policy 129: 436–451.
- Lucas, J. N. V., G. E. Francés, and E. S. M. González. 2016. “Energy Security and Renewable Energy Deployment in the EU: Liaisons Dangereuses or Virtuous Circle?” Renewable and Sustainable Energy Reviews 62: 1032–1046.
- Managi, S., and T. Okimoto. 2013. “Does the Price of Oil Interact with Clean Energy Prices in the Stock Market?” Japan and the World Economy 27: 1–9.
- Marques, A. C., J. A. Fuinhas, and A. N. Menegaki. 2016. “Renewable vs. Non-Renewable Electricity and the Industrial Production Nexus: Evidence from an ARDL Bounds Test Approach for Greece.” Renewable Energy 96: 645–655.
- Matsumoto, K. I., M. Doumpos, and K. Andriosopoulos. 2018. “Historical Energy Security Performance in EU Countries.” Renewable and Sustainable Energy Reviews 82: 1737–1748.
- McNown, R., C. Y. Sam, and S. K. Goh. 2018. “Bootstrapping the Autoregressive Distributed Lag Test for Cointegration.” Applied Economics 50 (13): 1509–1521.
- Missemer, A. 2018. “Natural Capital as an Economic Concept, History and Contemporary Issues.” Ecological Economics 143: 90–96.
- Murthy, V. N., and A. A. Okunade. 2016. “Determinants of US Health Expenditure: Evidence from Autoregressive Distributed lag (ARDL) Approach to Cointegration.” Economic Modelling 59: 67–73.
- Narayan, P. K. 2004. “Fiji’s Tourism Demand: The ARDL Approach to Cointegration.” Tourism Economics 10 (2): 193–206.
- Nasdaq. 2015. NASDAQ OMX Green Economy Sector Index Family Methodology. Accessed 3 May 2019. https://indexes.nasdaqomx.com/docs/methodology_QGREENCP4.pdf.
- Odhiambo, N. M. 2008. “Financial Depth, Savings and Economic Growth in Kenya: A Dynamic Causal Linkage.” Economic Modelling 25 (4): 704–713.
- Odhiambo, N. M. 2009. “Energy Consumption and Economic Growth Nexus in Tanzania: An ARDL Bounds Testing Approach.” Energy Policy 37 (2): 617–622.
- Ozturk, I., and A. Acaravci. 2011. “Electricity Consumption and Real GDP Causality Nexus: Evidence from ARDL Bounds Testing Approach for 11 MENA Countries.” Applied Energy 88 (8): 2885–2892.
- Pearce, D. 1988. “Economics, Equity and Sustainable Development.” Futures 20 (6): 598–605.
- Perron, P. 1997. “Further Evidence on Breaking Trend Functions in Macroeconomic Variables.” Journal of Econometrics 80 (2): 355–385.
- Pesaran, M. H., Y. Shin, and R. J. Smith. 2001. “Bounds Testing Approaches to the Analysis of Level Relationships.” Journal of Applied Econometrics 16 (3): 289–326.
- Pham, L. 2019. “Do all Clean Energy Stocks Respond Homogeneously to Oil Price?” Energy Economics 81: 355–379.
- Rahman, M. M., and M. A. Kashem. 2017. “Carbon Emissions, Energy Consumption and Industrial Growth in Bangladesh: Empirical Evidence from ARDL Cointegration and Granger Causality Analysis.” Energy Policy 110: 600–608.
- Reboredo, J. C., and A. Ugolini. 2018. “The Impact of Energy Prices on Clean Energy Stock Prices. A Multivariate Quantile Dependence Approach.” Energy Economics 76: 136–152.
- Sadorsky, P. 2012. “Correlations and Volatility Spillovers Between Oil Prices and the Stock Prices of Clean Energy and Technology Companies.” Energy Economics 34 (1): 248–255.
- Shao, L., and H. Zhang. 2020. “The Impact of Oil Price on the Clean Energy Metal Prices: A Multi-Scale Perspective.” Resources Policy 68: 101730.
- Song, Y., Q. Ji, Y. J. Du, and J. B. Geng. 2019a. “The Dynamic Dependence of Fossil Energy, Investor Sentiment and Renewable Energy Stock Markets.” Energy Economics 84: 104564.
- Song, Y., M. Zhang, and R. Sun. 2019b. “Using a New Aggregated Indicator to Evaluate China’s Energy Security.” Energy Policy 132: 167–174.
- Sun, C., D. Ding, X. Fang, H. Zhang, and J. Li. 2019. “How do Fossil Energy Prices Affect the Stock Prices of New Energy Companies? Evidence from Divisia Energy Price Index in China’s Market.” Energy 169: 637–645.
- Sun, C., F. Zhang, and M. Xu. 2017. “Investigation of Pollution Haven Hypothesis for China: An ARDL Approach with Breakpoint Unit Root Tests.” Journal of Cleaner Production 161: 153–164.
- Tursoy, T., and F. Faisal. 2018. “The Impact of Gold and Crude Oil Prices on Stock Market in Turkey: Empirical Evidences from ARDL Bounds Test and Combined Cointegration.” Resources Policy 55: 49–54.
- van Geldrop, J., and C. Withagen. 2000. “Natural Capital and Sustainability.” Ecological Economics 32 (3): 445–455.
- Waziri, B. Z., A. Hassan, and R. Kouhy. 2018. “The Effect of Transitioning to Renewable Energy Consumption on the Nigerian Oil and Gas Exports.” International Journal of Energy Sector Management 12 (4): 507–524.
- Winzer, C. 2012. “Conceptualizing Energy Security.” Energy Policy 46: 36–48.
- Xia, T., Q. Ji, D. Zhang, and J. Han. 2019. “Asymmetric and Extreme Influence of Energy Price Changes on Renewable Energy Stock Performance.” Journal of Cleaner Production 241: 118338.
- Yergins, D. 2006. “Ensuring Energy Security.” Foreign Affairs 85 (2): 69–82.
- Zaman, K. A. U., and K. Kalirajan. 2019. “Strengthening of Energy Security & Low-Carbon Growth in Asia: Role of Regional Energy Cooperation Through Trade.” Energy Policy 133: 110873.
- Zhang, H., G. Cai, and D. Yang. 2020. “The Impact of Oil Price Shocks on Clean Energy Stocks: Fresh Evidence from Multi-Scale Perspective.” Energy 196: 117099.
- Zivot, E., and D. Andrews. 1992. “Further Evidence of the Great Crash, the Oil-Price Shock and the Unit-Root Hypothesis.” Journal of Business and Economic Statistics 10: 251–270.