
 ?Mathematical formulae have been encoded as MathML and are displayed in this HTML version using MathJax in order to improve their display. Uncheck the box to turn MathJax off. This feature requires Javascript. Click on a formula to zoom.
ABSTRACT
This work aims to find an optimal hybrid renewable system design using solar, wind energy, battery storage, thermal loads, thermal load controller (TLC), boiler, and a diesel generator (DG) for the considered site. The prefeasibility techno-economic analysis has been carried out using HOMER software to meet the load demand requirement of the village. For identifying winning system architecture, minimum net present cost (NPC), lowest cost of energy (COE), and the highest renewable fraction (RF) are used as the criteria. The obtained results show that the least cost-optimal hybrid system consists of 614kW-PV,850kW-WT,800kW-DG, 1212 no. of batteries and 591 kW converter along with TLC-2000kW, having minimum NPC: $5.48M, least COE: $0.272/kWh and highest RF:91.6% can provide 92% reliable power supply to onsite load demand of 4502.95kWh/day with 70% renewable sources in the considered site. This paper also presents a sensitivity analysis of the hybrid system with variations in load demand, diesel fuel price, project lifetime, and interest rate.
1. Introduction
The fossil fuels used primarily for power generation are coal, diesel, petroleum, and natural gas. However, due to a sudden increase in power demand in developing countries, exhaustibility, and price changes, fossil fuel depletes quickly and cannot meet the required needs. So, it has become critical to conserve fossil fuels and consider using renewable energy resources (RERs) as an alternative. Nowadays, it is challenging to supply power for increasing energy demand rapidly using only conventional energy sources. As a result, there is an urgent need to consider energy sources that are both efficient and clean. Solar, wind, tidal, geothermal, and biomass are important renewable energy sources to replace fossil fuel power generation (Halabi and Mekhilef Citation2018). In (Dawoud, Lin, and Okba Citation2018), authors have presented various optimisation techniques and principles for the physical modelling of renewable energy resources. However, in practice, power resulting from solar photovoltaic (PV) and wind turbine (WT) generators are dependent on climate variations. Furthermore, both solar and wind systems are unreliable if storage batteries or backup distribution generators (DGs) are insufficient.
In (Al Busaidi et al. Citation2016), the authors have reviewed the various hybrid renewable energy systems (HRES) for electrical power supply usage. As a result, several methods were implemented for sizing the various components of the system during design. Moreover, in (Rad et al. Citation2020), the authors found a cost-effective method of delivering energy and water for residential and health care containers in Iran. Additionally, they have estimated the influence of various parameters changes (project lifetime, dispatch strategies control, and salvage cost) on finding the winning system configuration and analyzing how system economic cost varies.
Due to rapidly rising oil and coal prices, transmission line expansion costs, and power demand usage have led to the design of an HRES that combines two or more RERs, including battery storage and DGs for continuous power generation. As a result, this HRES can minimise COE and carbon emissions and deliver a reliable power supply to end-users compared to conventional energy sources. As a result, various optimisation approaches such as HOMER software and metaheuristics algorithms have been implemented by researchers in the past for designing and finding an optimal HRES architecture based on available renewable potentials such as solar irradiation, wind speed, and temperature at considered sites (Senthil Kumar et al. Citation2018). In (Farahi and Fazelpour Citation2019), authors have been implemented the feasibility of providing electricity from an HRES comprising PV/WT/DG/Battery configuration to meet the load demand in Iran.
In (Ashrafi Goudarzi et al. Citation2019), the authors have been designed an optimal HRES that can meet the energy demand of a 5-story residential building in Tehran. In the first stage, the author had calculated the energy consumption of the building using Design Builder software. Then, HOMER software is applied to perform techno-economic analysis and obtain an optimal feasible HRES that can meet the energy demand of buildings located in the considered site. Furthermore, in (Tezer, Yaman, and Yaman Citation2017), the authors have been investigated various optimisation techniques from the past to the present in order to solve problems related to sizing the system in such a way minimising energy costs, system management to stabilise the uncertainty of energy produced by renewable sources, and finally reducing greenhouse gas emissions from HRES. Finally, in (Ammari et al. Citation2021), the authors have focused on four critical categories of HRES, which mainly focus on sizing, optimisation, control, and energy management. Therefore, It is observed that viable software is characterised by flexibility in simulation, doesn’t need much time, and is easy to use, but a simple optimisation equation limits this method.
1.1. Related work
The hybrid systems can be categorised as stand-alone and grid-connected. The most reliable technology for rural areas to provide continuous power supply at lower COE is the stand-alone HRES (Muh and Tabet Citation2019). In (Iqbal et al. Citation2018), the authors have used Homer Pro to build HRES and perform sensitivity analysis to guarantee that the designed system was robust and cost-effective. The results show that system cost is 180.2 M USD for a peak load of 73.6 MW and LCOE: 0.05744 $/kWh. summarises the related works published on modelling the HRES using HOMER Pro software for obtaining the optimal system to the considered site based on available renewable energy sources.
Table 1. Related recent research published on designing the HRES design based on available renewable energy sources.
In (Mandal, Das, and Hoque Citation2018), authors have been studied the potential application of an HRES (PV/Wind/Diesel) with battery storage in Bangladesh's northern region. According to the obtained results, the optimised HRES consists of 73 kW PV arrays, a 57 kW DG, a 387-kWh battery bank, and 28 kW inverters with a minimum COE of $0.37$/kWh and NPC of $357,284. This system also reduces carbon emissions by almost 62 percent compared to the current kerosene used. In (Haratian et al. Citation2018), the authors have designed an off-grid HRES and performed the techno-economic analysis to determine a cost-effective system in the KhshU site. The simulation results reveal that PV/WT/battery system has a minimum NPC:8173$ and the least COE:0.546 $/kWh. In addition, they found that wind speeds ranging from 3 to 6 m/s had no significant impact on the NPC & COE of the system. Using HOMER, a stand-alone HRES was designed in (Ariyo et al. Citation2018) for the Senate Building, University of Ilorin, Nigeria. The results show that the PV/DG/battery system yields a minimum LCOE of 0.283 $/kWh. It was also discovered that this site has a low average wind speed of 2.22 m/s, making it unsuitable for power generation using a wind energy system.
Based on studies discussed on stand-alone (off-grid) in , it could be concluded that HRESs design based on the available potential in the considered region provides an optimal economic solution for the government and investors (Vishnupriyan and Manoharan Citation2018). Additionally, the primary optimisation objective to evaluate HRES is the life-cycle cost for installation and operating the system over its lifetime. As a result, stand-alone system scenarios were considered in this study to demonstrate the effectiveness of system performances and economic variations if system parameters are changed during the design process.
The primary purpose of this HRES design is to fully utilise RERs to supply the power continuously with a high-reliability level for the considered site. For the first time, in this work, a prefeasibility techno-economic analysis and optimal design of different HRES incorporated along with sensitivity parameters (such as diesel fuel price, load demand, project lifetime, interest rate, PV derating factor, wind turbine hub height/lifetime, and grid power price) variations is investigated for stand-alone mode. The simulated systems are filtered and ranked for the best wining system configuration based on economic parameters (NPC, COE), REF, carbon emission, and unmet load percentage.
2. Methodology and materials
To obtain an optimal HRES design, a basic and integrated framework should be developed based on the potential available (solar irradiation, wind speed, and temperature) at the considered area, financial risk, environmental policies, and available RE resources. The key inputs of HRES design and planning need to determine daily load demand profile considering seasons variations, meteorological data in site, the specific area where PV/WT should install, and present power generation capacity. The winning system architecture among the various configurations can be accomplished from simulation, optimisation, and sensitivity analysis performed by HOMER (Sen and Subhes Citation2014). NPC, COE, O&M, and operating costs were obtained from the simulation process. After designing the optimal hybrid system and performing techno-economic analysis by HOMER. It is also necessary to perform sensitivity analysis for the designed system to measure the financial sensitivity in contrast to the uncertainty of system parameters. This analysis provides future investment ideas and information about system planning expansion and policy decisions. The main objectives of this research work are outlined as follows:
Optimal hybrid system design, prefeasibility techno-economic and sensitivity analysis of various HRES configuration by considering renewable energy sources, seasonal load demand inputs, differences in diesel prices, the lifetime of the project change, interest rate, PV derating factor variation, and uncertainty in system parameters.
To obtain an optimal stand-alone HRES for the considered site based on the economic (minimum NPC and low LCOE) and technical performances (renewable fraction and percentage of unmet loads).
2.1. Problem definition
The prefeasibility techno-economic analysis of stand-alone renewable energy systems (HGRES) is performed through the cost minimisation function as.
The total cost of the HRES includes ‘total cost of solar PV arrays, total Wind turbine cost, Diesel generator cost, number of batteries cost, converter cost, and thermal load controller cost.’ The TNPC and LCOE mainly depend on the total annualised cost of the system. The proposed optimisation process performed in this work mainly depends on ‘the lowest NPC and LCOE, total capital cost, initial cost, O&M cost, replacement cost and salvage cost of different components, energy sources over the project lifetime.’ Ranking of different HRES configurations obtained from the optimisation process is done depending on TNPC. The TNPC was calculated by estimating the system's total annualised cost and LCOE. To calculate TNPC, Equation (1) is used (Mudgal, Reddy, and Mallick Citation2019; Chen, He, and Li Citation2017; Peter Lilienthal Citation2016):
(1)
(1) where
: total annualised cost,
: annual real interest rate (discount rate),
: project lifetime, and
: capital recovery factor with
in % of interest rate.
The capital recovery factor () were calculated by Equation (2):
(2)
(2) where
: number of years, and
: the annual real interest rate. The drop-in interest rate may cause a decrease in
and this, in turn, leads to an increase in NPC.
The LCOE is defined as ‘the average cost per kWh of useful electrical energy produced by the system’ and calculated by Equation (3):
(3)
(3) where
: electrical energy served by microgrid system,
: the amount of electricity sold to the grid by the microgrid.
The renewable fraction is defined as ‘the fraction of the energy delivered to the load that originated from renewable power sources’ and calculated by Equation (4):
(4)
(4) Where
: ‘non-renewable electrical production (kWh/yr),
: non-renewable thermal production(kWh/yr),
: Total electrical load served(kWh/yr),
: Total thermal load served(kWh/yr)’.
3. Assumptions and model inputs
3.1. Study area
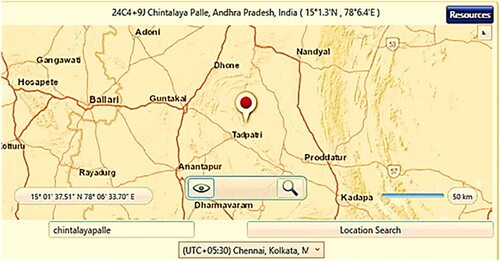
The site chosen for this work is situated in chintalaya palle village, Andhra Pradesh, India. These are located at a latitude and longitude of 15°1.3'N, 78°6.4'E, with an altitude of 243 m above sea level, as depicted in . As per census 2011 info, nearly 4094 people lived in 986 houses at the considered site. The primary occupation of people living was agriculture farming, digging granite stones in mines, and working as labourers in cement factories. Also, this site is surrounded by stone mining factories and rice mills. Therefore, integration of RERs is an optimal way to build stand-alone HRES to meet the increasing demand of residential, community, commercial, and agriculture and deliver a continuous power supply under emergency conditions.
Figure 1. Geographic map of the study area.
3.2. Load estimation
An onsite field survey accomplishes the load data collected at the considered site for 24 h. This information was fed into HOMER, and its scaled annual average load demand (kWh/day) is considered into two different load variables (such as:100%, 125%) compared to the baseline case. HOMER will estimate given load data into 8760 hourly load values for the entire year using hourly load profile and incorporating random variability factors (i.e. ‘day-to-day (10%) and time-step-to-time step variability (60 min)’). The estimated load data consumption for domestic, community, commercial loads for 24 h were tabulated in (a) as shown below. This table provides the daily load demand of different electrical components for each hour (CFL bulbs, tube-lights, LED bulbs, TV, ceiling fans, exhaust fans, radio, refrigerators, air coolers, electric iron box, motor pumps, and mix grinders).
The energy demand in kWh is calculated using equation
Table 2. (a) Load data of Domestic, Community, commercial and agricultural loads.
Energy Demand (kWh) = [Load demand (kW) * Duration (h)*quantity of device ON]
| ➢ | Power consumption by tube light is equal to 40 watts. | ||||
| ➢ | The duration of tube light usage is 1 h. | ||||
| ➢ | Number tube light ON for 1 h = 150 units. | ||||
Solution:
Then energy demand (kWh) =
[power consumed by tube light (kW)*duration (h)*quantity of tube lights ON]
= [(0.04 kW) *(1 h) *(125 tube lights)]
= 5 kWh.
This is how we have estimated the load demand of the domestic, community, and commercial loads for 24 h. In addition, tables A1, A2, A3, and A4 in the appendix provide information about estimating domestic, community, and commercial load consumption each hour based on electrical devices for a considered site approximately.
The total electricity used in the village for residential purposes (such as lighting, cooking, phone charging, and so on) is known as the domestic load. It is observed that the peak & daily load demand of these loads obtained from HOMER were 630.56 and 3185.9 kWh/d, respectively. Similarly, the community and commercial peak and daily load demand were 167.26 and 883.91 kWh/day. Water pumping motors used for irrigation purposes come under agriculture loads (deferable load). It is noticed that peak demand is 13.05 kW and daily demand is 23.56 kWh/d, respectively, for the considered site.
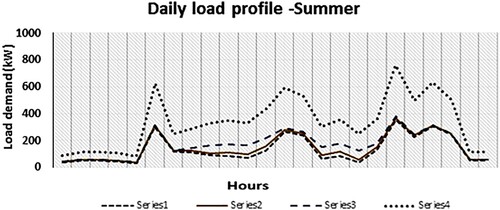
a, b, and c were attained by entering estimated load demand data into the HOMER. The figures illustrate daily, seasonal, and yearly domestic, community, and commercial load profiles monthly attained by random variability factors. Additionally, . depicts the information in the appendix about the estimated daily load profile at the chosen site.
Figure 2. (a) The info of domestic loads daily, seasonal, and yearly profile. (b) The info of community and commercial loads daily, seasonal, and yearly profile. (c) The yearly profile of agriculture loads.
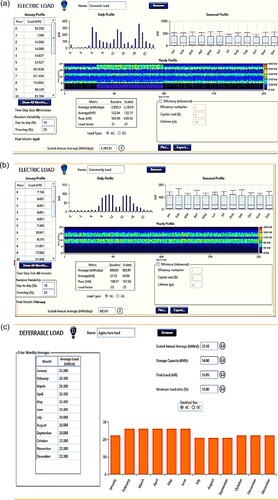
Figure 3. Daily load profile.
Thermal loads:
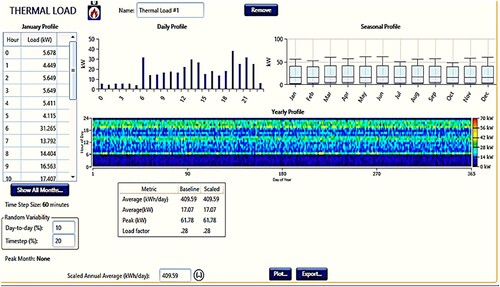
Thermal load is the demand for heat energy and later utilised for room space heating, industrial process, and hot water heating. This load can be served by the boiler and a generator from which waste heat can be recovered or by surplus electricity. These loads are assumed to be 5% of the total electrical loads, and information about these load profiles obtained from HOMER for 24 h is depicted in . It can be noticed that the scaled annual average of this load is 409.59 kWh/d, with a scaled peak load of 61.78 kW having a load factor of 0.28. Thus, the main aim of including this load type in the HRES design is to examine the significance of surplus energy feeding the thermal load connected to the system.
Figure 4. The info profile of thermal loads.
3.4. Resources assessment
In this work, the available renewable potentials were extracted from National Renewable Energy Laboratory & NASA using HOMER Pro software. According to obtained data in the summer season, solar radiation is feasibly obtainable for 10–12 h at the chosen site. Similarly, wind speed averages around 6 m/s, and temperature increases gradually up to 48 °C in the summer season.
3.4.1. Solar radiation data
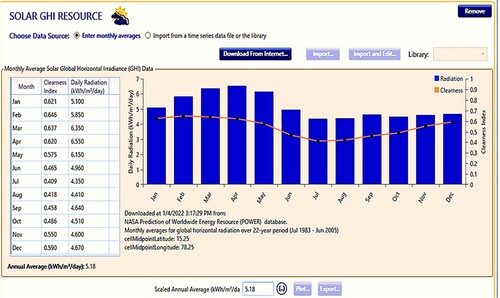
The clearness index (CI) measures atmospheric clearness, ranging between 0 and 1. The CI differs between 0.646 in Feb and reduced to 0.409 in July due to the rainy season, and finally, the annual average value is 0.539 for the selected site. As a result, for the last 22 years, the annual average monthly solar radiation data has been 5.18 kWh/m^2/day. depicts the CI and average monthly solar radiation data collected from NASA using HOMER for the considered site.
Figure 5. CI values and annual average solar radiation data for the selected site.
3.4.2. Wind speed data
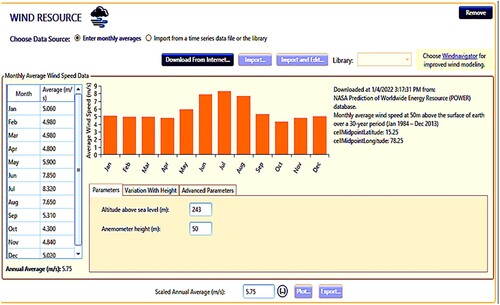
The wind speed at the considered site available is abundant due to the hilly area and varies from 4.45–8.98 m/s at a 50 m height. Therefore, wind potential is sufficient for installing WT to produce power to meet the load demands at the particular site. The average monthly wind speed data for the considered site extracted from NASA is depicted in . At this location, the surface roughness is set to 0.01. According to the NASA database, 30-year average monthly wind speed data is recorded as 5.75 m/s.
Figure 6. Annual average wind speed data for the chosen site.
Temperature:
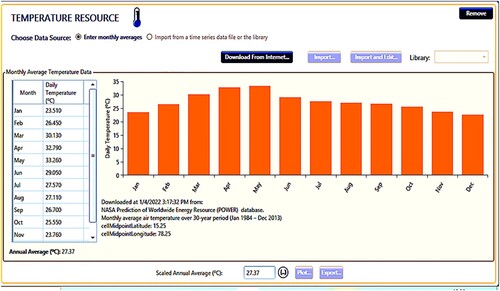
According to NASA forecast of the worldwide energy resource database for 30-year the average monthly air temperature is recorded as 27.430C at the considered location. depicts the average monthly air temperature extracted from NASA for the site chosen to study.
Figure 7. Annual average air temperature for considered site.
3.5. Mathematical modelling, specifications, and cost details of hybrid renewable energy system components
In this research study, for supplying stable and reliable power to loads in considered site, several components such as DG, PV modules, WT, Batteries, and system converter are utilised, and detailed specifications, including the cost of each, are presented in .
3.5.1. Pv array
The output power produced by the solar PV module mainly depends on factors such as ‘solar irradiance, characteristics of the PV cells (conversion efficiency, installation of PV panels and derating factor) and cells temperature.’ Eq.5 is used to calculate the PV array power (Peter Lilienthal Citation2016).
(5)
(5) where: ‘
: Rated PV array power at standard test conditions (kW);
: derating factor (%);
: solar radiation (kW/m^2);
: Solar radiation at standard test conditions (1000 W/m^2);
: Temperature coefficient (% / °C);
: Cell temperature at reference conditions (25 °C);
: Cell temperature (°C).’
In this study, tata power solar system 300TP monocrystalline PERC cells were used to design HRES. The technical specifications of this PV module are represented in . In this work, to improve solar system efficiency from energy losses due to wiring connection and increased temperature, the derating factor value is chosen as 88% and ground reflectance as 25% (Kabalci Citation2013).
Table 3. Tata power solar system 300TP solar PV module technical specification details (solar panel details: https://kenbrooksolar.com/system/hybrid-solar-system).
3.5.2. Wind turbine
The power generated by a wind turbine (WT) system is calculated at each time step. The turbine's wind speed is calculated using Equation (6).
(6)
(6) ‘Where:
: Speed of wind at the Hub height (HH) (m/s);
: Speed of wind at anemometer height (m/s);
: HH of the turbine (m);
: Anemometer height (m);
: Surface roughness length (m);
(..): Natural logarithm.’
The output WT power attained at normal conditions is calculated using Equation (7) (Peter Lilienthal Citation2016).
(7)
(7) ‘Where
: WT power output (kW);
: WT output at standard temperature and pressure (kW);
: Actual air density [kg/m^3];
: Air density at standard temperature and pressure (1.225 kg/m^3).’
The power generated by WT was calculated using Equation (8).
(8)
(8) Where
Rated power of windmill,
: Wind speed at the considered site,
and
: Cut-in and cutout of windspeed of a windmill,
: Rated windspeed of a windmill.
Gamesa G52-850 kW WT is selected in this study, manufactured by Gamesa corporation limited. This type of WT is mainly chosen for sites having low/medium wind speed and higher turbulence intensity. The WTs used in this research have a maximum power efficiency of 3.5–4 m/s and a cut-in speed of 3.5–4 m/s. The detailed technical and cost of Gamesa G52-850 kW model WT considered for this work are shown in .
Table 4. Economic and technical details of wind turbine (Gamesa G52-850 kW) (Gamesa G-52 wind turbine specifications: https://www.windpowerengineering.com/turbine/gamesa-g52-850kW).
3.5.3. Diesel generator
The lifetime of diesel generators (DG) is estimated using Equation (9).
(9)
(9) ‘Where:
: generator lifetime (hour);
: No. of hours DG operates in one year (hour/year).’
The average electrical efficiency is calculated using Equation (10) (Peter Lilienthal Citation2016).
(10)
(10) Where: ‘
: Total annual electrical production (kWh/year);
: Total annual fuel consumption (kg/yr);
: The lower heating value of the fuel (MJ/kg);.’
The fuel price of diesel in the Andhra Pradesh market rate in march 2021 is Rs 83.95 per litre ($1.15/l). The CAT-1000 kVA-50Hz-CP diesel generator is taken for this analysis to meet the load under any conditions. The caterpillar company has designed this generator. The cost details for one unit generator available from web source are taken as initial capital cost: $82,249.20, replacement cost: $57,574.44, operation & maintenance cost per hour: $126.00, and fuel price per litre: $1.15 (https://www.abhishekengg.com/caterpillar-make-400-to-5000-kva-lt-dg-set.html#1000-kva-caterpillar-diesel-generator). The properties of fuel used in this type of generator have values such as lower heating 43.4 MJ/kg, carbon content 85%, density 800 kg/m^3, and sulfur content 0.45%. This generator lifetime in hours is chosen as 90,000.00 and at a minimum load ratio of 25%.
3.5.4. Battery
During emergencies conditions battery can provide the necessary backup power. Based on energy generation and load consumption, the no. of batteries integrated into the system and the Battery's state may be determined. The lifespan of a battery is determined by characteristics such as lifetime throughput and battery float life. The battery storage bank lifetime is estimated using Equation (11) (Lilienthal Citation2016).
(11)
(11) ‘Where,
: Storage float life (year);
: storage bank life (year);
: No. of batteries in the storage bank;
: Lifetime storage throughput (kWh);
: Annual storage throughput (kWh/yr).’
In this study, the luminous 200Ah,12 V, ILTT25060 model Lead Acid battery of 200 Ah maximum capacity is used during the design of HRES. The technical specifications of the Battery are shown in .
Table 5. Technical details of battery (luminous 200Ah,12 V, ILTT25060 model) (https://kenbrooksolar.com/price-list/luminous-solar-panels-inverters-batteries-price#Luminous_Solar_Battery_Price).
3.5.5. Converter
In this research, a generic large free converter is selected, and default cost details as recorded in HOMER pro software are provided in (Peter Lilienthal Citation2016).
Table 6. Technical details of Generic large free converter (Lilienthal Citation2016).
3.5.6. Boiler
The boiler used in this hybrid design serves as a backup source of heat that can serve the required amount of thermal load whenever needed. HOMER needs to add a boiler whenever a thermal load is coupled to the system. The thermal load controller (TLC) permits surplus electrical production to serve loads connected to the thermal bus. In this work, a generic TLC of 1 kW is chosen from HOMER, and default cost details as recorded in software are initial capital cost $200 per 1 kW, replacement cost $200, and operation and maintenance cost per year $20.00/year for each converter a lifetime of 20 years (Peter Lilienthal Citation2016).
3.5.7. System economics
The nominal discount rate is considered 8% and 10%, and the inflation rate is 2% expected. The annual capacity shortage is assumed to vary from 0% to 10% in this designed hybrid system. The project lifetime of HRES design in this work is taken as 15 and 25 years. The operating reserve is considered 80% of solar and 70% of wind power output, 10% of the hourly load, and the minimum renewable fraction as 40%.
3.6. Other constraints
In this work, the constraints assumed while performing analysis are taken as follows: Maximum annual capacity storage is 10%, load in current time steps as 10% along with annual peak load as 5%, percentage solar power output as 80%, minimum renewable fraction as 40%, and wind power output as 75%.
3.6.1. Sensitivity variables
Sensitivity analysis allows monitoring the impact of certain input variables on system design and the system's economy. To assess their influence on the optimised HRES configuration, various input values and related economic parameters are changed within a given range. This work's sensitivity analysis aims to know the optimal value of a particular variable used in designing the best HRES configuration. Furthermore, this analysis will provide clear information during the optimisation process on how the obtained financial and technical results vary depending on different input assumption values and help design a perfect HRES system for the considered site.
Therefore, different project lifetimes were considered during this study's design and simulation process, such as 15 and 25 years. This variation in project lifetime will provide assistance to identify if the optimised HRES configuration is more cost-effective and feasible than the grid extension or not. In addition to project lifetime, for the first time, the sensitivity analysis is performed for different input variables variation in this research such as annual average load demand, diesel price, % PV derating factor, WT hub height/lifetime, annual interest rate, and a lifetime of the Battery. provides changed input values during sensitivity analysis, HRES design, and techno-economic analysis.
Table 7. Sensitivity variables.
4. Results and discussions
In the current study, simulation, optimisation, and sensitivity analysis are the three principal tasks performed using HOMER Pro software to obtain various HRES configurations (Lambert, Gilman, and Lilienthal Citation2006). The obtained economic parameter results in the optimisation process, such as NPC, LCOE, operating costs, and renewable energy fractions (REF), were used to rank and find out a winning HRES architecture. Furthermore, in this research work, prefeasibility techno-economic analysis of stand-alone HRES is performed, including the sensitivity parameters in order to obtain an optimal hybrid system for the considered site.
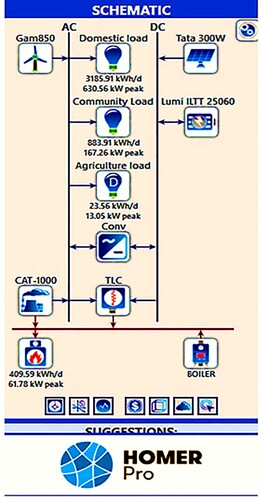
In case-1, the diesel generator and renewable energy source-based stand-alone system model with thermal load controller and boiler(off-grid) are designed as shown in . The simulation was carried out using HOMER, based on components input specifications, cost, available potentials, load demand, and other constraints. It creates various HRES designs that are suitable and reliable for meeting the load demand at the chosen location.
Figure 8. The schematic diagram of the stand-alone microgrid model.
4.1. Analysis of stand-alone HRES model performance
depicts the designed off-grid connected hybrid model. The summary of obtained results for two subcases, taking into account base and sensitivity analysis is shown in below.
Table 8. Summary of techno-economic and sensitivity analysis of standalone HRES.
Case 1(a): stand-alone HRES model base-case analysis
For this case study, the lifetime of the system is considered 25 years, with an annual real interest rate of 8%, diesel price as 1.16$/L, PV derating factor as 88%, the lifetime of a battery as 12 years, and wind turbine hub height and lifetime as 40 m,25 years. Therefore, the obtained optimal system for this case consists of 614 kW of PV arrays, one unit of 850 kW wind turbine, one unit of 800 kW of diesel generators, 1212 number of 12 V batteries, 591 kW of power converters, and 2000kW of TLC having the lowest NPC and COE value as $5.48M and $0.272 respectively. is obtained by filtering the overall simulation results, and the HRES comparison is performed based on NPC, COE, renewable fraction, CO2 emission, and total fuel cost. The total NPC of a system is ‘the present value of all the costs acquired over its lifetime, minus the current value of all the revenue it earns. Costs include capital costs, replacement costs with the waste disposal, operation with maintenance costs, and fuel costs’.
Table 9. Overall optimisation results of case 1(a) different HRES models ordered by NPC, COE.
The NPC of optimal system obtained in case 1(a) is $5.48M, which is the least expensive NPC in comparison with other system configurations such as: PV/Batt/TLC/BO/CONV: $6.27M, WT/DG/Batt/TLC/BO/CONV: $6.81M, PV/DG/Batt/TLC/BO/CONV: $6.98M, WT/Batt/TLC/BO/CONV: $7.19M, PV/WT/Batt/TLC/BO/CONV: $7.26M and PV/WT/DG/Batt/TLC/BO/CONV: $17.3M. The Levelized COE of this optimal HRES resulted from is $0.272/kWh; it is the least expensive COE in comparison with other system configurations such as PV/Batt/TLC/BO/CONV: $0.329/kWh, WT/DG/Batt/TLC/BO/CONV: $0.340/kWh, PV/DG/Batt/TLC/BO/CONV: $0.349/kWh, WT/Batt/TLC/BO/CONV: $0.383/kWh, PV/WT/Batt/TLC/BO/CONV: $0.364/kWh and PV/WT/DG/Batt/TLC/BO/CONV: $0.882/kWh. illustrates obtained the optimal stand-alone HRES result for case 1(a) with the least expensive NPC, COE, and REF for considered sites using HOMER.
Figure 9. The Homer optimisation results of case 1(a) hybrid stand-alone microgrid model PV/wind/diesel/battery system/thermal load controller/boiler.
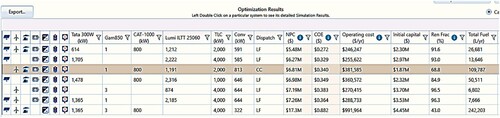
The REF of the optimal HRES obtained for this case is 91.6%, which is the fraction of energy delivered to the loads (domestic load (kWh/d): 3185.9, Community load (kWh/d): 883.9, agriculture load(kWh/d):23.56 and thermal load (kWh/d):409.59) that originated from renewable sources. The REF of the other systems configurations resulted is as follow: PV/Batt/TLC/BO/CONV:93.0%, WT/DG/Batt/TLC/BO/CONV: 68.8%, PV/DG/Batt/TLC/BO/CONV: 84.9%, WT/Batt/TLC/BO/CONV: 96.5%, PV/WT/Batt/TLC/BO/CONV: 96.3% and PV/WT/DG/Batt/TLC/BO/CONV: 43.0%. Therefore, results conclude that the renewable potential available at the site is abundant and fully utilised for power generation.
From the simulation results obtained, the total amount of fuel consumed by the PV/WT/DG/Batt/TLC/BO/CONV system is 26,681 L/year, which is the average amount of fuel consumed by the generator per kWh of electricity generated for one year. It is concluded that the total amount of fuel consumed by this optimal system is the minimum amount in comparison with other HRES configurations such as PV/Batt/TLC/BO/CONV: 13,646 L/year, WT/DG/Batt/TLC/BO/CONV: 109,787 L/year, PV/DG/Batt/TLC/BO/CONV: 50,511 L/year, WT/Batt/TLC/BO/CONV:6,802 L/year, PV/WT/Batt/TLC/BO/CONV: 7,666 L/year and PV/WT/DG/Batt/TLC/BO/CONV: 242,203 L/year. Therefore, if fuel consumption by the system is less, the cost of the system and carbon emission release will reduce.
Case 1(b): stand-alone HRES model with sensitivity analysis applied to design
For this case, the project lifetime is considered 15 years, the annual real interest rate as 10%, diesel price as 1.37 $/L, PV derating factor as 75%, the lifetime of a battery as 15 years, and wind turbine hub height and lifetime as 50 m,15 years. Therefore, the obtained optimal system for this case consists of 753 kW of PV arrays, one unit of 850 kW wind turbine, one unit of 800 kW diesel generators, 1396 number of 12 V batteries, 725 kW of power converters, and 2000kW of TLC along with boiler fuel consumption as 11,298L has lowest NPC and COE value as $5.01M and $0.299 respectively.
The NPC of optimal HRES obtained from simulation results in this case 1(b) is PV/WT/DG/Batt/TLC/BO/CONV: $5.01M, which is the least expensive NPC in comparison with other HRES configurations such as: WT/DG/Batt/TLC/BO/CONV: $6.18M, PV/Batt/TLC/BO/CONV: $6.23M, PV/DG/Batt/TLC/BO/CONV: $6.93M, PV/WT/Batt/TLC/BO/CONV: $7.09M, WT/DG/TLC/BO: $13.1M, PV/WT/DG/Batt/TLC/BO/CONV: $6.47M. The Levelized COE of HRES in this case obtained from the HOMER simulation result listed in is $0.299/kWh; it is indicated that this is the least expensive COE in comparison with other system configurations such as WT/DG/Batt/TLC/BO/CONV: $0.371/kWh, PV/Batt/TLC/BO/CONV: $0.394/kWh, PV/DG/Batt/TLC/BO/CONV: $0.418/kWh, PV/WT/Batt/TLC/BO/CONV: $0.428/kWh, WT/DG/TLC/BO: $0.800/kWh and PV/WT/DG/Batt/TLC/BO/CONV: $0.389/kWh. illustrates the various optimal stand-alone HRES from HOMER for case 1(b).
Figure 10. The Homer optimisation results of the case 1(b) hybrid stand-alone microgrid model PV/wind/diesel/battery system/thermal load controller/boiler with sensitivity variable.
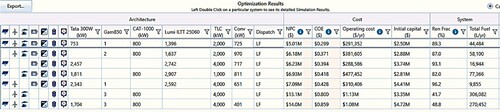
Table 10. Overall optimisation results of case 1(b) different system models ordered by NPC, COE.
The REF of the optimum system in this case obtained is 89.3%, which is the fraction of energy delivered to the loads (domestic load (kWh/d): 3982.38, Community load (kWh/d): 1104.88, agriculture load(kWh/d):23.56 and thermal load (kWh/d):511.98) that originated from renewable sources. The REF obtained for other systems configurations from HOMER is as follow: PV/WT/DG/Batt/TLC/BO/CONV:89.3%, WT/DG/Batt/TLC/BO/CONV: 87.0%, PV/Batt/TLC/BO/CONV: 93.1%, PV/DG/Batt/TLC/BO/CONV: 82.0%, PV/WT/Batt/TLC/BO/CONV: 96.2%, WT/DG/Batt/TLC/BO: 41.7% and PV/WT/DG/Batt/TLC/BO/CONV: 92.8%. Therefore, the obtained optimal system in this case is fully utilising RERs available at considered site for meeting load demand.
In this case, the total amount of fuel consumed by the optimal PV/WT/DG/Batt/TLC/BO/CONV system obtained is 44,484 L/year, which is ‘the average amount of fuel consumed by the generator per kWh of electricity generates for one year.’ Therefore, it is concluded that the total amount of fuel consumed by this optimal system is the minimum amount in comparison with other HRES configurations such as WT/DG/Batt/TLC/BO/CONV: 58,100 L/year, PV/Batt/TLC/BO/CONV: 16,944 L/year, PV/DG/Batt/TLC/BO/CONV:9,855 L/year, WT/DG/Batt/TLC/BO: 306,082 L/year and PV/WT/DG/Batt/TLC/BO/CONV: 27,123 L/year. Therefore, fuel consumption reduction will reduce system costs and carbon emissions into the environment.
4.3. Summary of component cost
provides obtained NPC summary of various components in terms of USD used in optimal design of HRES. (Such as TATA power solar system 300 TP, WT Gamesa-G52(850 kW), CAT-1000kVA-50Hz-PP diesel generator, Lumi-ILTT 25060-12 V Battery, Generic large free converters, and generic thermal load controller). From , it is noticed that NPC of optimal system obtained from simulation results for case 1(a) of TATA power solar system-300 TP, Gamesa-G52(850 kW) WT, CAT-1000kVA-50Hz-PP diesel generator, Lumi-ILTT 25060-12 V Battery, Generic large free converters, generic boiler and generic thermal load controller were $763,379.58, $1,622,077.00, $796,087.50, $1,550,007.43, $191,986.38, $105,332.25 and $455,655.59. From this table, it can also be concluded that during the system's total lifetime, the Battery must be changed with a replacement cost of $73,505.17.
Table 11. The total NPC and annualised costs of each component used in the optimal stand-alone HRES for Case 1(a) are summarised as.
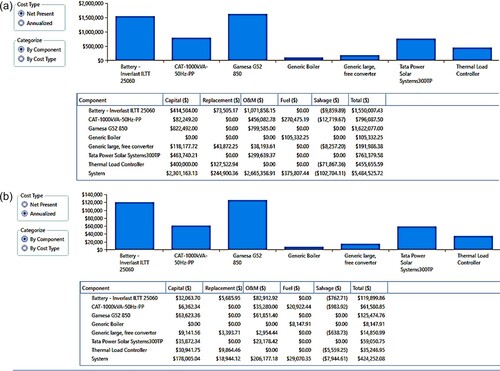
(a) and (b) show the NPC of each component used in the best off-grid connected HRES design for the site under consideration. It can be noticed that annualised costs obtained for components TATA power solar system 300 TP, WT Gamesa-G52(850 kW), CAT-1000kVA-50Hz-PP diesel generator, Lumi-ILTT 25060-12 V Battery, Generic large free converters, generic boiler, and generic thermal load controller of this optimal system were $59,050.75, $125,474.76, $61,580.85, $119,899.86, $14,850.99, $8,147.91, and $35,246.95 respectively. The total annual cost of this optimum HRES is estimated at $424,252.08.
Figure 11. (a). Components total NPC cost of obtained optimal HRES for case 1(a). (b) Components annualised NPC cost of optimal HRES for case 1(a).
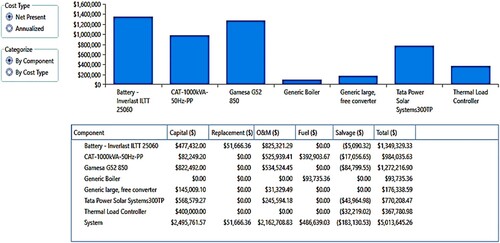
Case 1(b): provides the obtained NPC results summary of various components used to design optimal stand-alone HRES for sensitivity cases. From , it can be noticed that NPC obtained for case 1(b) of TATA power solar system-300 TP, Gamesa-G52(850 kW) WT, CAT-1000kVA-50Hz-PP diesel generator, Lumi-ILTT 25060-12 V Battery, Generic large free converters, generic boiler, and generic thermal load controller were $770,208.47, $1,272,216.90, $984,035.63, $1,349,329.33, $176,338.59, $93,735.36, and $367,780.98.00 respectively. It has been determined that the Battery will need to be replaced at the cost of $51,666.36 during the project's lifetime.
Table 12. Total NPC and annualised costs obtained for each component of optimal stand-alone HRES for case 1(b) (sensitivity variables were included in this case).
depicts a results summary of the NPC of each component when a sensitivity case is considered. From this table, it can be noticed that annualised costs of TATA power solar system 300 TP, WT Gamesa-G52(850 kW), CAT-1000kVA-50Hz-PP diesel generator, Lumi-ILTT 25060-12 V Battery, Generic large free converters, generic boiler, and generic thermal load controller of this optimal system were $89,123.09, $147,211.97, $113,865.66, $156,134.87, $20,404.66, $10,846.40, and $42,557.02 respectively. The annual cost of this optimal HRES is estimated as $580,143.67.
Figure 12. Components total NPC cost of obtained optimal HRES for case 1(b).
4.5. Electric summary of optimal hRES
reveals obtained simulation results of optimal HRES generation, consumption, excess and unmet loads. From this , it can be noticed that the total annual generation for case 1(a) stand-alone HRES is 3,467,437.00 kWh per year, power consumed by the loads is 1,494,072.00 kWh per year, and excess generated power from the system is 1,867,732.00 kWh/year. Similarly, for case 1(b), the power generation obtained is 3,712,924.00 kWh per year, power consumed by the loads is 1,865,438.00 kWh per year, and the systems have an excess power generated of 1,712,368.00 kWh/year. The monthly generation of different energy sources used in this optimal stand-alone HRES is depicted in .
Figure 13. Monthly average electricity generation from various sources of optimal stand-alone HRES.
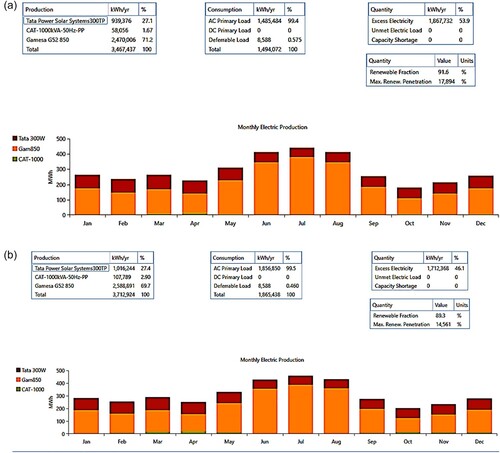
Table 13. Obtained electric summary of optimal HRES configuration
It is noticed that for case 1(a), power generated by PV modules (Tata power solar system 300TP) is 939,376 kWh per year (27.1%), diesel generator (CAT-1000kVA-50hz-PP) is 58,056.00 kWh/year (1.67%). More amount of power is generated by a wind turbine (Gamesa-G52-850kW) is 2,470,006.00 kWh/year (71.2%). Similarly, for case 1(b) is power generated by PV modules (Tata power solar system 300TP) is 1,016,244 kWh per year (27.4%), diesel generator (CAT-1000kVA-50hz-PP) is 107,789.00 kWh/year (2.90%) and more amount of power is generated by wind turbine (Gamesa-G52-850kW) is 2,588,891.00 kWh/year (69.7%).
4.6. Greenhouse gases emissions
provide the greenhouse gases emitted values for this optimal HRES, such as ‘carbon dioxide, carbon monoxide, unburned hydrocarbons, particulate matter, sulfur dioxide, and nitrogen oxides.’ According to this table, the PV/WT/DG/Batt/TLC/BO/CONV configuration designed was emitting CO2 into the atmosphere at a rate of 48,072 kg/yr, which is less than the WT/DG/Batt/TLC/BO/CONV system, which emits 263,327 kg/yr.
Tables 14. The info of greenhouse gases emissions of optimal HRES.
Similarly, for case 1(b), PV/WT/DG/Batt/TLC/BO/CONV configuration designed is emitting CO2 contains 87,690 kg/yr into the atmosphere, which is less quantity when compared to WT/DG/TLC/BO system release 808,871 kg/yr.
4.7. Compare economics
The TNPC is the most important economic outcome of HOMER software simulation findings (https://www.abhishekengg.com/caterpillar-make-400-to-5000-kva-lt-dg-set.html#1000-kva-caterpillar-diesel-generator). The economic comparison results for the base case and the current HRES designed in this study are summarised in .
Table 15. Summary of Economics results for the base case and current HRES system.
4.7.1. Optimal off-grid HRES obtained from homer to the considered site
The obtained optimal stand-alone HRES for case 1(a) comprises 614 kW of PV arrays, 850 kW of WT (1 unit), 800 kW of DG (1 unit), 1212 no. of 12 V batteries, 591 kW of power converters, and 2000kW of TLC is having minimum NPC and COE value of $5.48M and $0.272 respectively. For economic comparison of case1(a), the base-case system chosen in this study is the WT/DG/Batt/TLC-BO/CONV system (rated as:850 kW/800 kW/1191 number/2000kW/813 kW). The NPC and COE of the base system configuration are $6.81M and $0.340/kWh, respectively. The difference in investment costs between the base case and designed optimal PV/WT/DG/batt/TLC-BO/CONV configuration can roughly recover in three years. And this system has a high rate of return: 31.0%, interest rate: 28%, and a simple payback of 3.2 years. As a result, it is concluded that the fuel consumption and carbon emissions of this HRES (PV/WT/DG/batt/TLC-BO/CONV) configuration are lower than those of the base system.
Similarly, for case 1(b), when sensitivity variables (change in input variables) are considered, the obtained system comprises 753 kW of PV arrays, 850 kW of WT (1 unit), 800 kW of DG (1 unit), 1396 no. of 12 V batteries, 725 kW of power converters and 2000kW of TLC is having lowest NPC and COE value as $5.01M and $0.299 respectively. For economic comparison of case1(b), the base-case system taken in this study is the PV/DG/Batt/TLC-BO/CONV system (rated as 1811kW/800 kW/2907 number/2000kW/811 kW). The NPC and COE of the base system configuration are $6.93M and $0.418/kWh. The difference in investment costs between the base case and designed optimal PV/WT/DG/batt/TLC-BO/CONV configuration can nearly recover in three years. And this system has a high rate of return: 42.0%, simple payback of 2.9 years, and rate of interest: 35%. It is noticed that carbon emissions and fuel consumption of this HRES (PV/WT/DG/batt/TLC-BO/CONV) are lower than those of the base system.
4.8. Comparison of proposed research work model to other models that have been implemented in literature:
The HOMER software tool has been used commonly to execute several stand-alone HRES configuration prefeasibility techno-economic analyses for rural electrification in India. shows the prefeasibility techno-economic analysis of the existing and proposed model. According to simulation results, the PV/WT/DG/Battery/Converter/TLC/boiler design is the best off-grid HRES in case 1(a), with the lowest COE, highest RF, lowest unmet load percentage, and lowest carbon emission. In addition, many HRES models have been developed and integrated with various power sources based on potential availability (such as ‘solar irradiation, wind speed, temperature’) in the selected area before being deployed to meet load demands.
Table 16. Comparison of existing and proposed models in terms of available potentials
shows that the proposed off-grid HRES in case 1(a) is optimal based on the available potential at the considered location. Compared to other works performed in (Das et al. Citation2017; Pradhan, Mohanty, and Kar Citation2017), the proposed HRES model is the best feasible configuration for the chosen site, with the lowest COE: 0.272$/kWh and the highest RF: 91.6. As a result, these models were optimally feasible for the available potentials of 5.35 (kWh/m^2/day) solar irradiation and 5.75 m/s wind speed. Therefore, the government can suggest the proposed hybrid configurations for rural electrification in order to provide a reliable power supply at a low energy cost at the considered site.
5. Conclusions
Maximising the technological, economic, and environmental benefits of hybrid renewable energy systems has become a major concern for designers. In this paper, for the first time, the hybridisation of different energy sources such as WT/PV/Battery/TLC/Boiler/converter system to supply power for household load demands in chintalaya palle village, Andhra Pradesh, India, was studied from technical, economic, and environmental perspectives for various RE-based stand-alone scenarios. HOMER software is used for microgrid modelling due to its public availability and ease of implementation. The study compares various configurations to determine the winning architecture hybrid system solution with the lowest COE, lowest NPC, and highest renewable fraction. To determine the best configuration scheme for stand-alone hybrid systems, each optimal configuration's technical and economic advantages are assessed. A sensitivity analysis was performed to outline the impact of design parameter uncertainty on HRES design and cost.
The following are the main conclusions of this work:
1. The obtained results show that least cost-optimal stand-alone HRES consists of 614kW-PV,850kW-wind turbine,800kW-Diesel generator,1212 number of batteries and 591 kW converter system along with thermal load controller-2000kW rating having minimum NPC: $ 5.48M, least COE: $ 0.272/kWh and highest RF: 91.6% can provide 92% reliable power supply to onsite load demand of 4502.95kWh/day with 70% renewable sources in the considered site.
2. The stand-alone models with moderate battery size tend to be more efficient and cost-effective than a system without batteries.
3. Meanwhile, integrating RERs has yielded various benefits, such as providing hundred percent required power to fed load demand with excess energy of 53.9%, reducing the release of the harmful GHG emissions into the environment, and also minimising fuel consumption by nearly 15% when compared to base case system for the stand-alone scenario.
4. Therefore, RE-based hybrid systems in the considered site can provide at least 85% of the onsite electricity for load demand, with 80–92% of renewable energy fraction. In addition, the designed optimal hybrid systems are more environmentally friendly as it emits less carbon emission for the considered site.
Acknowledgment
The authors are extremely grateful to the chancellor, vice-chancellor, Vellore institute of technology, Vellore, for providing the VIT seed grant and the excellent infrastructure facilities and encouragement that have made this research work possible.
Disclosure statement
No potential conflict of interest was reported by the author(s).
References
- Al Busaidi, A. S., H. A. Kazem, A. H. Al-Badi, and M. F. Khan. 2016. “A Review of Optimum Sizing of Hybrid PV–Wind Renewable Energy Systems in Oman.” Renewable and Sustainable Energy Reviews 53: 185–193.
- Ammari, Chouaib, Djamel Belatrache, Batoul Touhami, and Salim Makhloufi. 2021. “Sizing, Optimization, Control and Energy Management of Hybrid Renewable Energy System-a Review.” Energy and Built Environment. doi:10.1016/j.enbenv.2021.04.002.
- Ariyo, B. O., M. F. Akorede, I. O. A. Omeiza, S. A. Y. Amuda, and S. A. Oladeji. 2018. “Optimisation Analysis of a Stand-Alone Hybrid Energy System for the Senate Building, University of Ilorin, Nigeria” Journal of Building Engineering 19: 285–294.
- Ashrafi Goudarzi, S., F. Fazelpour, G. B. Gharehpetian, and M. A. Rosen. 2019. “Technoeconomic Assessment of Hybrid Renewable Resources for a Residential Building in Tehran.” Environmental Progress & Sustainable Energy 38: 1–14.
- Aziz, A. S., M. F. N. Tajuddin, M. R. Adzman, M. A. Ramli, and S. Mekhilef. 2019. “Energy Management and Optimization of a PV/Diesel/Battery Hybrid Energy System Using a Combined Dispatch Strategy.” Sustainability 11 (3): 683.
- Baseer, M. A., A. Alqahtani, and S. Rehman. 2019. “Techno-economic Design and Evaluation of Hybrid Energy Systems for Residential Communities: Case Study of Jubail Industrial City.” Journal of Cleaner Production 237: 117806.
- Chen, Y., L. He, and J. Li. 2017. “Stochastic Dominant-Subordinate-Interactive Scheduling Optimization for Interconnected Microgrids with Considering Wind-Photovoltaic-Based Distributed Generations Under Uncertainty.” Energy 130: 581–598.
- Das, B. K., N. Hoque, S. Mandal, T. K. Pal, and M. A. Raihan. 2017. “A Techno-Economic Feasibility of a Stand-Alone Hybrid Power Generation for Remote Area Application in Bangladesh.” Energy 134: 775–788.
- Dawoud, S. M., X. Lin, and M. I. Okba. 2018. “Hybrid Renewable Microgrid Optimization Techniques: A Review.” Renewable and Sustainable Energy Reviews 82: 2039–2052.
- Farahi, S., and F. Fazelpour. 2019. “Techno-economic Assessment of Employing Hybrid Power System for Residential, Public, and Commercial Buildings in Different Climatic Conditions of Iran.” Environmental Progress & Sustainable Energy 38: 614–623.
- Gamesa G-52 wind turbine specifications: https://www.windpowerengineering.com/turbine/gamesa-g52-850kW.
- Halabi, L. M., and S. Mekhilef. 2018. “Flexible Hybrid Renewable Energy System Design for a Typical Remote Village Located in Tropical Climate.” Journal of Cleaner Production 177: 908–924.
- Haratian, M., P. Tabibi, M. Sadeghi, B. Vaseghi, and A. Poustdouz. 2018. “A Renewable Energy Solution for Stand-Alone Power Generation: A Case Study of KhshU Site-Iran.” Renewable Energy 125: 926–935.
- https://kenbrooksolar.com/price-list/luminous-solar-panels-inverters-batteries-price#Luminous_Solar_Battery_Price.
- https://www.abhishekengg.com/caterpillar-make-400-to-5000-kva-lt-dg-set.html#1000-kva-caterpillar-diesel-generator.
- Iqbal, W., K. S. Khokhar, A. Khalid, S. R. Ashraf, J. Ahmad, M. Imran, S. F. Ali, and M. Adnan. 2018. “Techno Economic Analysis of a Wind-Photovoltaic-Biomass Hybrid Renewable Energy System for Rural Electrification: A Case Study of Kallar Kahar.” Energy 148: 208–234.
- Jahangir, Mohammad Hossein, Ardavan Shahsavari, and Mohammad Amin Vaziri Rad. 2020. “Feasibility Study of a Zero Emission PV/Wind Turbine/Wave Energy Converter Hybrid System for Stand-Alone Power Supply: A Case Study.” Journal of Cleaner Production 262: 1–19. Article number: 121250.
- Jeyasudha, S., et al. 2020. “Techno Economic Performance Analysis of Hybrid Renewable Electrification System for Remote Villages of India.” International Transactions on Electrical Energy Systems 31 (10): 1–18.
- Kabalci, E. 2013. “Design and Analysis of a Hybrid Renewable Energy Plant with Solar and Wind Power.” Energy Conversion and Management 72: 51–59.
- Konchou, Franck Armel Talla, Hermann Djeudjo Temene, René Tchinda, and Donatien Njomo. 2021. “Techno-economic and Environmental Design of an Optimal Hybrid Energy System for a Community Multimedia Centre in Cameroon.” SN Applied Sciences 3 (1): 1–12.
- Lambert, T., P. Gilman, and P. Lilienthal. 2006. “Micropower System Modelling with HOMER.” National Renewable Energy Laboratory 15: 379–417.
- Lilienthal, Peter. 2016. How HOMER calculates PV output power, Wind turbine power and battery output, energy charge output, total net present cost, Cost of energy and break-even grid extension distance, homer help file 2016. HOMER® Pro Version 3.7 User Manual, August 2016, 〈http://homerenergy.com/〉.
- Mandal, S., B. K. Das, and N. Hoque. 2018. “Optimum Sizing of a Stand-Alone Hybrid Energy System for Rural Electrification in Bangladesh.” Journal of Cleaner Production 200: 12–27.
- Mendu, S. S., P. Appikonda, A. K. Emadabathuni, and N. Koritala. 2020. “Techno-Economic Comparative Analysis Between Grid-Connected and Stand-Alone Integrated Energy Systems for an Educational Institute.” Evergreen 7 (3): 382–395.
- Mudgal, V., K. S. Reddy, and T. K. Mallick. 2019. “Techno-economic Analysis of Stand-Alone Solar Photovoltaic-Wind-Biogas Hybrid Renewable Energy System for Community Energy Requirement.” Future Cities and Environment 5 (1): 1–16.
- Muh, E., and F. Tabet. 2019. “Comparative Analysis of Hybrid Renewable Energy Systems for off-Grid Applications in Southern Cameroons.” Renewable Energy 135: 41–54.
- Pradhan, A. K., M. K. Mohanty, and S. K. Kar. 2017. “Techno-economic Evaluation of Stand-Alone Hybrid Renewable Energy System for Remote Village Using HOMER-pro Software.” International Journal of Applied 6 (2): 73–88.
- Pujari, H. K., and M. Rudramoorthy. 2021. “Optimal Design and Techno-Economic Analysis of a Hybrid Grid-Independent Renewable Energy System for a Rural Community.” International Transactions on Electrical Energy Systems, e13007. doi:10.1002/2050-7038.13007.
- Rad, M. A. V., R. Ghasempour, P. Rahdan, S. Mousavi, and M. Arastounia. 2020a. “Techno-economic Analysis of a Hybrid Power System Based on the Cost-Effective Hydrogen Production Method for Rural Electrification, a Case Study in Iran.” Energy 190: 116421.
- Rad, M. A. V., A. Shahsavari, F. Rajaee, A. Kasaeian, F. Pourfayaz, and W. M. Yan. 2020b. “Techno-economic Assessment of a Hybrid System for Energy Supply in the Affected Areas by Natural Disasters: A Case Study.” Energy Conversion and Management 221: 113170.
- Salameh, T., C. Ghenai, A. Merabet, and M. Alkasrawi. 2020. “Techno-economical Optimization of an Integrated Stand-Alone Hybrid Solar PV Tracking and Diesel Generator Power System in Khorfakkan, United Arab Emirates.” Energy 190: 116475.
- Sawle, Y., S. Jain, S. Babu, A. R. Nair, and B. Khan. 2021. “Prefeasibility Economic and Sensitivity Assessment of Hybrid Renewable Energy System.” IEEE Access 9: 28260–28271.
- Sen, Rohit, and C. Subhes. 2014. “Bhattacharyya. Renewable Energy-Based Mini-Grid for Rural Electrification: Case Study of an Indian Village.” In Mini-Grids for Rural Electrification of Developing Countries, 203–232. Cham: Springer.
- Senthil Kumar, J., S. Charles Raja, D. Srinivasan, and P. Venkatesh. 2018. “Hybrid Renewable Energy-Based Distribution System for Seasonal Load Variations.” International Journal of Energy Research 42 (3): 1066–1087.
- Solar panel details: https://kenbrooksolar.com/system/hybrid-solar-system.
- Taghavifar, H., and Z. S. Zomorodian. 2021. “Techno-economic Viability of on Grid Micro-Hybrid PV/Wind/Gen System for an Educational Building in Iran.” Renewable and Sustainable Energy Reviews 143: 110877.
- Tezer, T., R. Yaman, and G. Yaman. 2017. “Evaluation of Approaches Used for Optimization of Stand-Alone Hybrid Renewable Energy Systems.” Renewable and Sustainable Energy Reviews 73: 840–853.
- Vishnupriyan, J., and P. S. Manoharan. 2018. “Prospects of Hybrid Photovoltaice /Diesel Stand-Alone System for six Different Climate Locations in Indian State of Tamil Nadu.” Journal of Cleaner Production 185: 309–321.
Appendix
Appendix 1
Table A1: Load data for period of 24 hours kWh/day
Table A2: Load demand of Domestic loads for 24 hours
Table A3: Community load data
Table A4: Commercial load data