
 ?Mathematical formulae have been encoded as MathML and are displayed in this HTML version using MathJax in order to improve their display. Uncheck the box to turn MathJax off. This feature requires Javascript. Click on a formula to zoom.
ABSTRACT
The gearbox system is one of the most critical subassemblies in offshore wind turbine (OWT) drivetrains whose failures could lead to long downtimes and high repair costs. Therefore, it is crucial to accurately diagnose and predict the gearbox faults at an early stage of development. This study develops a new dynamic Bayesian network (DBN) framework for fault diagnosis and reliability analysis of OWT gearbox systems by incorporating components’ degradation information and condition-based maintenance (CBM) strategy. The reliability, availability, and mean-time between failures (MTBF) as well as the failure criticality index (FCI) for each subassembly are estimated. The results identified the loss of function in the bearing subassembly as the most likely underlying cause of a failure in the gearbox system.
1. Introduction
The offshore wind energy industry has experienced an exponential growth over the past decade. Despite the COVID-19 pandemic, the world’s installed offshore wind capacity increased from 27.7 GW at the end of 2019 to 31.9 GW at the end of 2020 (Buljan Citation2021). To accommodate the growth of wind energy, new wind farm projects are moving further offshore and into deeper waters where there are more spaces available and the wind is often stronger (Shafiee Citation2015a). Due to extreme weather conditions and harsh environments, the offshore wind turbines are subject to larger loads and more complex maintenance processes as compared to onshore wind turbines (Shafiee Citation2015b). The transition to deeper waters has also necessitated the usage of alternative foundations such as floating substructures that are more expensive and more complex than fixed foundations (Shafiee and Sørensen Citation2020b).
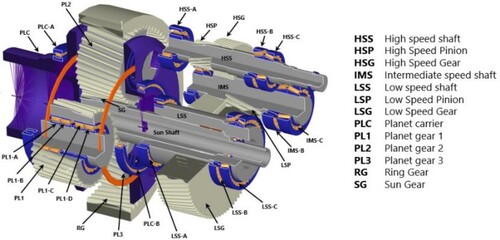
The gearbox system is one of the most important drivetrain components in both onshore and offshore wind turbines. The main function of a gearbox is to transmit power from the rotor to the generator by increasing the low input rotational speed from the rotor at high torque to a high output speed for the electric generator at low torque (Bhardwaj, Teixeira, and Soares Citation2019b). The wind turbine gearbox comprises many subassemblies and components that degrade over time due to environmental factors and material aging. shows a standard wind turbine gearbox system with its major components including gears, bearings, lubrication system, housing and shafts.
Figure 1. Typical modern design of a wind turbine gearbox (Onyx Insight Citation2019).
Wind turbine gearbox systems are subject to various complex loads which can cause wear and fatigue damage. These loads are often due to rapidly changing weather conditions, high winds and gusts, extreme turbulence, high operating temperature and oil degradation. Analyses of the wind energy databases such as SPARTA indicate that gearboxes are among the most frequently failing components of wind turbines (Fox and Hill Citation2020). Any functional failure in gearbox components could lead to long wind turbine shutdowns and major maintenance works, which consequently result in considerable losses in terms of both power and finances. In order to improve production availability and reduce operation and maintenance (O&M) costs, the operational safety and reliability of offshore wind turbine gearboxes must be given high priority.
Despite many studies about the reliability analysis of offshore wind turbines, the gearbox system has received little attention up to now. In particular, there are some gaps in the literature regarding the underlying causes of gearbox failure, the influencing factors in subasslemblies degradation, and how the reliability of the overall system can be improved. To address these gaps, this study aims to develop a new dynamic Bayesian network (DBN) framework to perform an advanced reliability analysis and fault diagnosis of the gearbox system and its subassemblies by taking into account degradation information and condition-based maintenance (CBM) strategy. Our proposed DBN model provides a number of advantages. First, it provides an ability to perform both prognostic (forward) and diagnostic (backward) analyses; Second, it accommodates both discrete and continuous models of time; and third, it supports maintenance decision-making by incorporating the health condition information.
The lifetime distributions of different subassemblies and their failure modes are considered as input for the reliability analysis of the gearbox system. For the purpose of our modelling, the gearbox system is broken down into five degradable subassemblies connected to each other in series. The health condition of each subassembly is classified into four different phases, represented by different time slices. The reliability, availability and mean-time between failures (MTBF) are estimated along with reliability importance and failure criticality index (FCI) for each subassembly. A sensitivity analysis is also conducted to determine the effects of the fault coverage factor on reliability, availability, MTBF and the expected number of failures, as well as the effects of redundancy on MTBF and average number of failures. Among different technologies available on the market, the R80 gearbox configuration with nominal power of 2MW has been considered in this study. This gearbox system is still one of the popular configurations in the wind energy industry and its failure information has been widely reported in the literature (e.g. see Smolders et al. Citation2010).
The rest of the paper is organised as follows. Section 2 reviews the literature on reliability analysis of offshore wind turbine gearboxes and provides some background information on Bayesian Networks. Section 3 presents our proposed dynamic Bayesian network model for the reliability analysis of offshore wind turbine gearboxes. Section 4 discusses the results, and finally, Section 5 concludes the paper.
2. Literature review
2.1. Reliability analysis of offshore wind turbine gearboxes
The reliability analysis of offshore wind turbines and their components is a relatively new subject that has attracted a great deal of attention over the last decade. Dinmohammadi and Shafiee (Citation2013) applied a fuzzy failure mode and effect analysis (FMEA) to assess the risks associated with the failure of offshore wind turbines. In this study, the gearbox was identified as the second and third most critical wind turbine subsystem based on the traditional and fuzzy FMEA analyses, respectively. In another work, Shafiee and Dinmohammadi (Citation2014) analysed the reliability of both onshore and offshore wind turbines using an extended FMEA technique and then compared the results from the risk priority number (RPN) measure with those obtained based on a cost priority number (CPN) measure. This study also identified the gearbox as the second most critical component in both types of wind turbines. Guo et al. (Citation2015) performed a reliability analysis of floating offshore wind turbines by combining both reliability block diagram (RBD) and fault tree analysis (FTA) techniques. The study concluded that the yaw system, gearbox, cooling system and mooring lines would need to be given the highest priority for maintenance. Kang et al. (Citation2017) applied the FTA to analyse the reliability of a semi-submersible floating offshore wind turbine in both qualitative and quantitative ways. They found out that the material degradation was the most prevalent failure mode of the gearbox system.
With respect to offshore wind turbine gearboxes, some studies have been conducted in recent years. Yang and Jiang (Citation2011) analysed the reliability of an offshore wind turbine gearbox as part of an effort to describe how wind farm SCADA systems contribute to the development of a reliability centred maintenance (RCM) strategy. Bhardwaj, Teixeira, and Soares (Citation2019a) performed a component level reliability analysis by using the FMEA technique to determine failure causes, and then applied a stepwise reliability prediction method to estimate the overall gearbox failure rate. Li et al. (Citation2019) considered the gearbox as a multi-state system and applied the non-homogenous continuous-time Markov process to optimise its maintenance policy.
A number of other studies have focused on failure analysis of the wind turbine gearbox at a component level. Zhao, Hu, and Li (Citation2012) proposed a method for the prediction of wind turbine gearbox failures based on a least square support vector machine (LS-SVM) algorithm. Sheng (Citation2014) conducted a study in which 320 gearbox damage records were analysed to identify top failure modes and root causes. The results revealed that the bearings were the most frequent failure mode of the gearbox.
Most of the reliability studies on wind turbine gearboxes have applied conventional analysis techniques. These techniques such as FMEA and FTA possess several drawbacks (Shafiee and Sørensen Citation2019; Shafiee, Elusakin, and Enjema Citation2020a). One of the major drawbacks is that the conventional techniques fail to take into account the dynamic, non-binary and multi-component nature of a mechanical system such as the wind turbine gearbox. Another drawback is that incorporating degradation information of assets over time can be complicated. Furthermore, the traditional reliability measures such as RPN do not provide detailed information on the criticality of components and subsystems in a complex system such as the offshore wind turbine gearbox.
To overcome these drawbacks, advanced reliability analysis techniques have been adopted in a number of studies. Le and Andrews (Citation2016) applied the Petri net (PN) technique to model the degradation process and optimise the inspection and maintenance schedules for offshore wind turbines. They used an extended version of the PNs, known as stochastic Petri net (SPN) to capture the dynamic and stochastic nature of offshore wind turbine operation. The wind turbine components were assumed to degrade in multiple discrete states based on Weibull distributed failure times. In another study, Elusakin et al. (Citation2021) presented a SPN model for reliability analysis and maintenance scheduling of floating offshore wind turbines and their support structure components, including floating platform, moorings and anchoring system. Lazakis and Kougioumtzoglou (Citation2019) applied the Bayesian Belief Networks (BBN) with failure mode, effect and criticality analysis (FMECA) as well as hazard identification (HAZID) techniques to rank offshore wind turbine components based on their failure criticality.
2.2. Bayesian networks
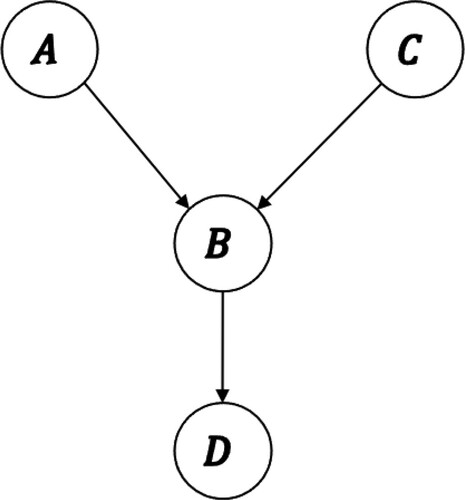
Bayesian networks (BN) provide a method through which probabilistic connections between variables can be modelled. Developed in the 1980s, the technique is rooted in statistics and it provides a simplistic way to solve complex decision-making problems (Adedipe, Shafiee, and Zio Citation2020). The BN consists of nodes which represent random variables, arcs which link nodes in a directed acyclic graph (DAG), and conditional probability tables (CPT) which define the probability of a node given all potential combinations of its parent nodes (Yang and Frangopol Citation2018). Each node holds a finite number of states which cannot occur simultaneously and arcs which are used to connect multiple nodes indicating direct probabilistic relationships.
BNs, also known as belief networks, are based on the application of the Bayes theorem to calculate conditional probabilities. The network is normally built from existing data or expert opinion on the variables of consequence and the dependencies between them (Kammouh, Gardoni, and Paolo Citation2020). The Bayes theorem is based on the knowledge that observations about the end result of a system/process must be updated when new evidence is introduced. BNs can be applied to solve decision-making problems based on prior knowledge about system operation (Adedipe, Shafiee, and Zio Citation2020). A simple BN structure is shown in .
Figure 2. Simple representation of a BN.
In Bayes theorem, posterior probability of an event can be expressed in terms of its prior probability, likelihood function and normalisation constant. This can be expressed mathematically as:
(1)
(1) where
is the posterior probability and constitutes the belief of
occurring given the observation of evidence
,
signifies the likelihood of
being observed given that the event
holds true,
represents the probability of the evidence occurring and
is the prior probability.
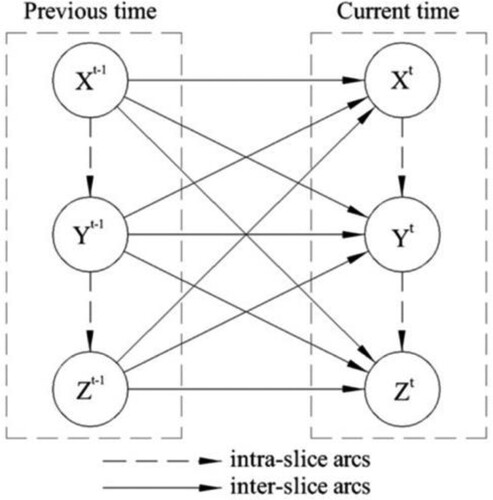
Dynamic Bayesian networks (DBN) are an extension of BNs which include an explicit time dimension. The DBN approach expands the power of conventional reliability analyses by including common causes and multi-state variables (Ashrafi and Zadeh Citation2017). A DBN is a transition model based on random probability distribution splintered over a set of random variables, over which a collection of conditional probability assumptions is defined. The feature of time-invariance also ensures that the variable dependency model remains unchanged at any time. The term ‘dynamic' is adopted as an attachment to BN when multiple time slices are needed to accurately represent the evolution of the system through time (Montani et al. Citation2008). Due to a DBN being analogous to a semi-Markovian random process with order , a local BN is extended to t number of time slices when
. Such models are referred to as ‘two-time slice temporal Bayesian network' or 2-TBN (Montani et al. Citation2008). A general structure of a DBN is shown in .
Figure 3. Typical structure of a DBN (Cai et al. Citation2013).
If is a Bayes net that represents the prior probability distribution of variable states
and
is a Two-Time slice BN (2TBN) which represents
, a DBN can be defined as (
,
) by means of a DAG as (Murphy Citation2002):
(2)
(2) where
represents the ith node at time
, and
are the parent nodes of
within the network which can be in the same or preceding time slice. The joint distribution of a DBN can be obtained by expanding the 2TBN into T number of time slices, as follows:
(3)
(3) In the context of wind energy, BNs have been applied towards reliability assessment, fault diagnosis and prognosis, and operation and maintenance (O&M) planning. BNs are adopted in reliability analysis of wind turbines due to the effect of better reliability on the reduction of O&M costs which in turn leads to a reduction in levelised cost of electricity (LCOE) (Shafiee, Brennan, and Espinosa Citation2016). To this effect, Nielsen and Sørensen (Citation2017) applied the DBN technique to incorporate wind turbine blade inspection measurements into the remaining useful life (RUL) prediction. With the emergence of condition monitoring (CM) and condition-based maintenance (CBM) in reliability engineering research and practice, the concept of BN as a tool for fault detection has warranted further exploration. Furthermore, to avoid the computational complexities associated with calculating conditional probabilities for large networks, some software tools such as Netica (Norsys Software Corporation Citation2021), WinBUGS (Griffin and Steel Citation2007), Hugin (Nielsen and Sørensen Citation2010) and MSBNx (Kadie, Hovel, and Horvitz Citation2001) have been developed to create and manipulate BNs and their different variations. For this study, the Netica software application has been used.
3. DBN model development
In this section, a DBN model is developed for the reliability analysis as well as fault diagnosis of offshore wind turbine gearboxes by taking into account the degradation information of subassemblies. The DBN model has been divided into three layers: the fault layer, the subassembly layer, and the system layer. The model is broken down to the fault layer in order to highlight the progression from a fault to the failure of the gearbox system. The system layer consists of the gearbox which has been divided – based on modular composition – into five components in the subassembly layer that are most critical to the reliable operation of the gearbox. These components include the gears, bearings, lubrication system, housing and shaft. The subassembly layer is further broken down to the fault layer which shows the different avenues through which each subassembly may fail. The nodes in the fault layer are referred to as the root nodes as they have no parents. The manifestation of one of the failure modes triggers the failure of its associated subassembly which in turn leads to the failure of the gearbox system.
The system was assumed to degrade in four stages, which were represented as four time slices denoted by ,
,
and
. The progression of the root nodes in the DBN model between degradation states follows a Weibull distribution as it can be used to represent system deterioration (see e.g. Le and Andrews Citation2016; Dinwoodie, Quail, and McMillan Citation2021; Douard, Domecq, and Lair Citation2012). The degradation factor of each failure mode in the DBN is determined from the reliability function of the analogous 2-parameter Weibull distribution. This is given below as (Nielsen Citation2011)
(4)
(4) where
represents the shape parameter and
represents the scale parameter. The failure rates which were used as the basis for gearbox Weibull distributions (life data) were obtained from Smolders et al. (Citation2010) and Bhardwaj, Teixeira, and Soares (Citation2019a). For ease of computation, it was assumed that the degradation parameters for each time slice are identical. The life data for gearbox subassemblies are shown in .
Table 1. Life data for gearbox subassemblies.
To incorporate CBM strategy, a repair action was introduced at the first stage of degradation, i.e. at time slice . This was done through adding decision and utility nodes to the DBN model to form an influence diagram (ID). A decision node is a type of node which presents different options of decisions that are to be made. This node can have a direct impact on chance nodes which are nodes that represent variables of interest and show the probabilities of different results. Decision nodes can also have certain associated costs which are represented by utility nodes (Yang and Frangopol Citation2018). The effects of CBM strategy on the reliability of the gearbox system are described further in Section 4.4.
The local BN models which represent the gearbox assembly are based on the causal relationship between the performance of the subassemblies and that of the gearbox. These BN models are then connected by time-based arcs to incorporate time dependence. Each subsystem is represented by a chance node with two states:
‘Yes', which signifies the reliability of the subassembly/assembly, and
‘No', which signifies the probability of failure.
The representation of the unexpanded BN model can be seen in .
Figure 4. Unexpanded DBN model.
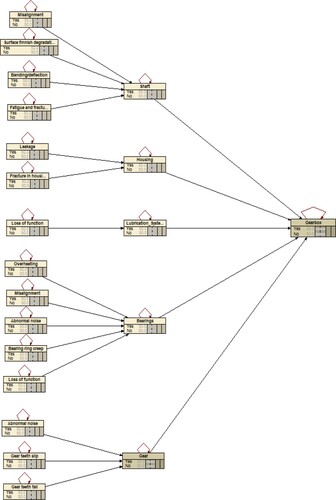
The conditional probability tables (CPTs) for gearbox system performance have been generated for the subassembly and system layers to complete the BN model. They represent the relationship between the failure modes and each subassembly and the relationship between the subassemblies and the gearbox system respectively. present the conditional probability tables for each of the subassemblies and the system. In these Tables, the value ‘1' represents the state of the system working while the value ‘0’ represents the state of system failure. The probabilities of each child node are obtained based on the gearbox assembly being a series system. For example, shows that one of the failure modes having a state of ‘0' causes the gear subassembly to have a state of ‘0' itself, meaning that the gear subassembly only works when none of its failure modes occur.
Table 2. CPT of gear subassembly performance.
Table 3. CPT of bearings subassembly performance.
Table 4. CPT of lubrication system performance.
Table 5. CPT of housing subassembly performance.
Table 6. CPT of shaft subassembly performance.
The data obtained from the DBN analysis of the gearbox system is then used as input for further analysis using the BlockSim® software tool (Reliasoft Blocksim Citation2021).
4. Results and discussion
4.1. Reliability analysis
The reliability of a system is described as the ability of that system to perform its desired functions, for a specific time and under specific conditions (BSI Citation2016). The reliability of the offshore wind turbine gearbox, given that it is a series system, can be calculated as:
(5)
(5) where
is the number of components and
indicates the reliability of the component
(in the context of this study, subassembly
) within the system. The transient reliability function plot for the entire gearbox system is shown in .
Figure 5. Reliability plot for gearbox over its lifetime.
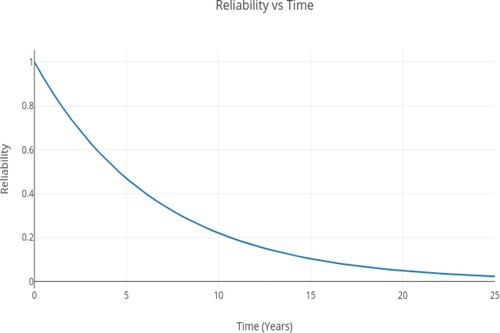
As can be seen, the reliability of the system gradually decreases until it reaches a value of 0.0228 at the end of its design lifetime. The transient reliability of each subassembly over the gearbox lifespan was also determined and can be seen in . The reliability for each subassembly can be calculated using the Equation below:
(6)
(6) where
is the shape parameter and
is the scale parameter.
Figure 6. Reliability plot for gearbox subassemblies over its lifetime.
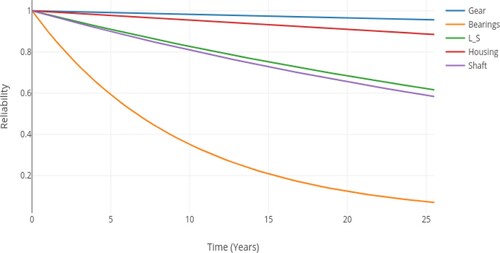
The reliability plot for each subassembly varies considerably and this can be attributed to the different rates at which each subassembly fails. The mean availability of the gearbox over its lifetime was obtained and can be seen in . The mean availability is defined as the proportion of time in which the system is able to operate during a given time period. Therefore, the mean availability can be calculated using the following Equation:
(7)
(7) where
is the time of the most recent repair.
Figure 7. Mean availability for the gearbox over its lifetime.
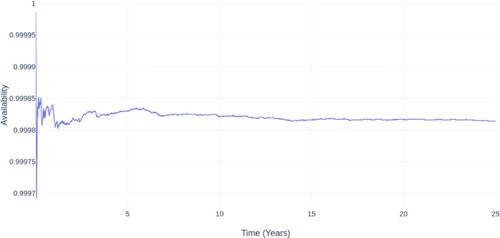
As can be seen, the availability drops in the first seven years of operation before stabilising at a value of about 0.99981 over the remaining lifetime of the gearbox system. This availability information can be used in a variety of different manners, such as estimating the annual energy output (AEO) and associated costs for a specified offshore wind farm.
The mean-time between failure (MTBF), which is defined as the total time the system should be in operation divided by the number of times maintenance interventions have been performed on the system, is obtained for the entire gearbox system. Mathematically, this can be represented as:
(8)
(8) where T represents the total time that the gearbox should be in operation and M represents the number of maintenance interventions performed on the system during its 25-year lifespan. M is calculated mathematically using the equation:
(9)
(9) where
is the rate of occurrence of failure at time t. The gearbox is expected to experience functional failure for approximately 3.8 times. This means that the maintenance/repair actions, including both up-tower repairs and full gearbox replacements, will occur 4 times over the system lifetime.
4.2. Fault diagnosis
As stated previously, the BN technique has the ability to perform both forward (predictive) and backward (diagnostic) analyses. Fault diagnosis is performed on the gearbox system through backward analysis of the DBN model. As faults are known to contribute to the deterioration in the performance of complex mechanical systems, fault diagnosis plays an important part in identifying and isolating faults (Ren, Wang, and Wang Citation2015).
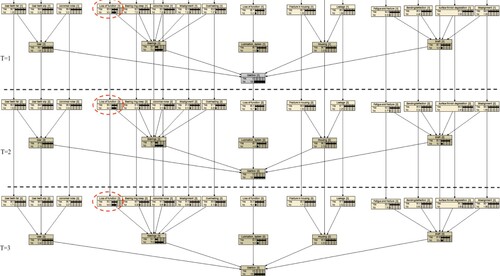
Fault diagnosis through BN backward analysis is performed by following the direction of arcs from child nodes back to their parent nodes, i.e. moving from effect to cause (Kabir and Papadopoulos Citation2019). This analysis involves obtaining new beliefs (posterior probabilities) about any node given new evidence is provided. It is important to note that this method of fault diagnosis can only present the probability of a fault occurring. The higher the posterior probability of the fault node, the more likely it is that the corresponding fault has occurred (Liu et al. Citation2020).
In this model, if evidence of system failure is presented at time slice T = 1 (i.e. the ‘No' state at the gearbox node = 100% or 1), the posterior probabilities at the fault and subassembly layer will be updated. As can be seen in , the node with the highest probability of failure is the loss of function for the bearings subassembly, identifying this as the most probable cause of system breakdown/failure across all time slices.
Figure 8. Backward (diagnostic) analysis of the wind turbine gearbox system.
4.3. Reliability importance
The reliability importance of each gearbox subassembly is also obtained in order to determine the effect of the reliability of each subsystem on the reliability of the entire gearbox system. Analysing the reliability importance of individual subassemblies is imperative for a variety of reasons such as determining the major causes of system breakdown, evaluating the consequences of failure of each subassembly, scheduling of timely maintenance activities, and so on (Daemi, Ebrahimi, and Fotuhi-Firuzabad Citation2012).
The importance measures in this DBN model are derived by calculating the difference between the prior and posterior probabilities for each subassembly when an evidence of system failure at the final time slice (i.e. the ‘No' state at the gearbox node = 100% or 1 at T = 3) is provided. The higher the difference, the higher the importance measure. The prior and posterior probabilities for each subsystem at each time slice are given in .
Table 7. Prior and posterior probabilities of all gearbox subsystems in each time slice.
The prior probabilities in were determined using the relationship between the performance of each subassembly and the performance of the gearbox at the final time slice before evidence of a failure is introduced (i.e. the ‘No' state at the gearbox node = 100% or 1 at T = 3). The posterior probabilities were determined following the introduction of evidence of failure. The difference between prior and posterior probabilities for different subassemblies is also shown in .
Figure 9. Difference between prior and posterior probabilities.
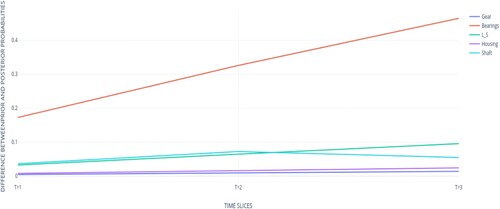
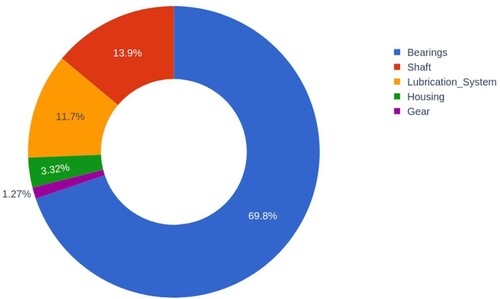
As can be seen, the bearings subassembly has the highest probability difference value, followed by the shaft, lubrication system, housing and eventually the gear subassemblies. This order is confirmed by the failure criticality index, which identifies and ranks the impact that each subsystem has on the overall gearbox failure. This can be expressed mathematically as:
(10)
(10)
depicts the FCI values for subassemblies of the wind turbine gearbox system which confirms that the bearings subsystem has the highest index, followed by the shaft, lubrication system, housing and gear. This is consistent with the results of the study performed on wind turbine gearbox failures by Sheng (Citation2014) and the reliability of floating offshore wind turbines by Li et al. (Citation2019) which showed that 70% of gearbox failures are attributable to bearings.
Figure 10. Failure criticality index for subassemblies of the wind turbine gearbox system.
4.4. Incorporation of CBM strategy
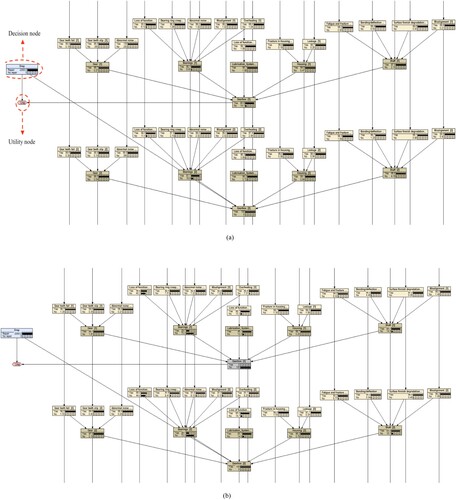
CBM is introduced through adding decision and utility nodes to the DBN model. As shown in , if an evidence of failure in the time slice T = 1 is provided, and the decision is made to repair (represented by the decision node Drep), the reliability of the gearbox in time slice T = 2 will increase to 100%. This is because the perfect maintenance actions performed on the gearbox system restore it to its original condition. The utility of performing repair action, which is the negative value of its relative cost, is represented by utility node Urep and assumed to be Urep = −1000 for this analysis.
Figure 11. Gearbox system performance (a) without evidence of CBM (b) with evidence of CBM.
4.5. Sensitivity analysis
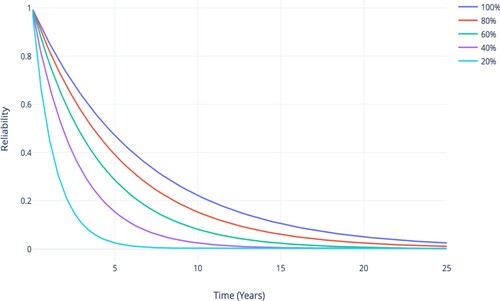
A sensitivity analysis has been performed to determine the effects of variations in key metrics (such as coverage factor and redundancy) on the performance of the wind turbine gearbox system. The coverage factor, which refers to the percentage of faults that can be detected in any engineering system while it is being monitored, is an important measure in the assessment of how effective a CM technology is (Elusakin and Shafiee Citation2020).
The effects of the coverage factor on reliability, availability, MTBF, and expected number of failures were determined. shows the transient reliability plots for the gearbox system at coverage factors of 100%, 80%, 60%, 40%, and 20%. As can be seen, the reliability of the gearbox will decrease faster with the reduction in the coverage factor.
Figure 12. Effect of 100%, 80%, 60%, 40%, and 20% coverage factor on system reliability.
The effect of the coverage factor on mean availability is shown in . As can be seen, the mean availability decreases with the reduction in the coverage factor.
Table 8. Effect of coverage factor on the gearbox’s availability.
The effect of the coverage factor on the gearbox’s MTBF was also analysed. It can be seen from that the MTBF decreases with the reduction in the coverage factor. This signifies that the amount of time in which the system is in operation decreases as the fault detection capacity declines.
Table 9. Effect of coverage factor on the gearbox’s MTBF.
shows the effect of the coverage factor on the average number of failures. As can be seen, the average number of failures increases with the reduction in the coverage factor. This shows that a lower level of fault detection leads to a larger number of system failures.
Table 10. Effect of coverage factor on average number of failures.
The effect of redundancy on the gerabox’s MTBF was also analysed by adding another bearing subsystem to the gearbox system. Redundancy has a positive impact on MTBF as it is seen to increase the gearbox’s MTBF from 6.5 years to 21.9 years. The redundancy also leads to a reduction in the average number of failures from 3.8 to 1.1 over the gearbox’s lifetime.
5. Conclusion and further works
This paper presented a reliability analysis and fault diagnosis model based on a dynamic Bayesian network (DBN) for offshore wind turbine gearboxes while incorporating degradation information and condition-based maintenance (CBM) strategy. The gearbox was divided into five subassemblies including gears, bearings, lubrication system, housing and shafts that are connected with each other in series. The reliability, availability and mean-time between failures (MTBF) of the gearbox system over its lifetime were estimated. Fault diagnosis of the offshore wind turbine gearbox was performed and the reliability importance and failure criticality index were calculated. The bearing subassembly was determined to be the least reliable component, confirmed by it having the highest failure criticality index as well as the highest difference between prior and posterior probabilities over time. This was then followed by the shaft, lubrication system, housing and gears. The fault diagnosis results showed that loss of function in the bearing subassembly is the most likely root cause for the gearbox failure. A sensitivity analysis was also conducted to determine the effects of fault coverage factor (as an indicator of the fault detection ability) on reliability, availability, and MTBF, as well as the effect of redundancy on MTBF and average number of failures. The results showed that fault coverage factor and adding a redundant bearings subassembly have a considerable positive impact on system performance. A reduction in coverage factor is directly correlated with decreases in reliability, availability and MTBF. The introduction of redundancy also resulted in an increase in MTBF.
For future research, a number of opportunities are available. Lessons learned from the present reliability analysis and fault diagnosis study can be extended to other multi-component systems within or outside of the wind energy sector. Another opportunity for further work can be to apply the DBN approach to reliability analysis while taking into account imperfect repair and common-cause failures. Understanding the effects of weather-induced loads on wind turbines reliability can be an interesting subject for research.
Disclosure statement
No potential conflict of interest was reported by the author(s).
References
- Adedipe, T., M. Shafiee, and E. Zio. 2020. “Bayesian Network Modelling for the Wind Energy Industry : An Overview.” Reliability Engineering & System Safety 202: 107053.
- Ashrafi, M., and A. S. Zadeh. 2017. “Lifecycle Risk Assessment of a Technological System Using Dynamic Bayesian Networks.” Quality and Reliability Engineering International 33: 2497–2520.
- Bhardwaj, U., A. P. Teixeira, and C. G. Soares. 2019a. “Reliability Prediction of an Offshore Wind Turbine Gearbox.” Renewable Energy 141: 693–706.
- Bhardwaj, U., A. P. Teixeira, and C. G. Soares. 2019b. “Reliability Prediction of Bearings of an Offshore Wind Turbine Gearbox.” In Proceedings of the 3rd International Conference on Renewable Energies Offshore (RENEW 2018), 779–787, Lisbon.
- BSI. 2016. BS EN 61078. Reliability Block Diagrams. https://shop.bsigroup.com/products/reliability-block-diagrams?pid=000000000030310507.
- Buljan, A. 2021. Rystad Energy: Global Installed Offshore Wind Capacity to Grow by 37% in 2021. https://www.offshorewind.biz/2021/02/04/rystad-energy-global-installed-offshore-wind-capacity-to-grow-by-37-in-2021/.
- Cai, B., Y. Liu, Y. Zhang, Q. Fan, Z. Liu, and X. Tian. 2013. “A Dynamic Bayesian Networks Modeling of Human Factors on Offshore Blowouts.” Journal of Loss Prevention in the Process Industries 26 (4): 639–649.
- Daemi, T., A. Ebrahimi, and M. Fotuhi-Firuzabad. 2012. “Constructing the Bayesian Network for Components Reliability Importance Ranking in Composite Power Systems.” International Journal of Electrical Power & Energy Systems 43: 474–480.
- Dinmohammadi, F., and M. Shafiee. 2013. “A Fuzzy-FMEA Risk Assessment Approach for Offshore Wind Turbines.” International Journal of Prognostics and Health Management 4: 1–10.
- Dinwoodie, I., F. Quail, and D. McMillan. 2021. “Analysis of Offshore Wind Turbine Operation & Maintenance Using a Novel Time Domain Meteo-Ocean Modeling Approach.” In Proceedings of the ASME Turbo Expo, 847–857. Copenhagen, June 11–15.
- Douard, F., C. Domecq, and W. Lair. 2012. “A Probabilistic Approach to Introduce Risk Measurement Indicators to an Offshore Wind Project Evaluation – Improvement to an Existing Tool ECUME.” Energy Procedia 24: 255–262.
- Elusakin, T., and M. Shafiee. 2020. “Reliability Analysis of Subsea Blowout Preventers with Condition-Based Maintenance Using Stochastic Petri Nets.” Journal of Loss Prevention in the Process Industries 63: 104026.
- Elusakin, T., M. Shafiee, T. Adedipe, and F. Dinmohammadi. 2021. “A Stochastic Petri net Model for O&M Planning of Floating Offshore Wind Turbines.” Energies. doi:10.3390/en14041134.
- Fox, A., and C. Hill. 2020. System Performance, Availability and Reliability Trend Analysis (SPARTA): Portfolio Review 2018/19. https://pod.ore.catapult.org.uk/sites/default/files/associated-documents/SPARTA-Portfolio-Review-201819.pdf.
- Griffin, J. E., and M. F. J. Steel. 2007. “Bayesian Stochastic Frontier Analysis Using WinBUGS.” Journal of Product Analysis 27: 163–176.
- Guo, Y., L. Sun, N. Luo, and Z. Liu. 2015. “Reliability Allocation and Fault Tree Qualitative Analysis for Floating Wind Turbines.” In Proceedings of the Twenty-Fifth International Ocean and Polar Engineering Conference, Hawaii, USA.
- Kabir, S., and Y. Papadopoulos. 2019. “Applications of Bayesian Networks and Petri Nets in Safety, Reliability, and Risk Assessments: A Review.” Safety Science 115: 154–175.
- Kadie, C., D. Hovel, and E. Horvitz. 2001. MSBNx: A Component-Centric Toolkit for Modeling and Inference with Bayesian Networks. Technical Report MSR-TR-2001-67. https://www.microsoft.com/en-us/research/wp-content/uploads/2016/02/tr-2001-67.pdf.
- Kammouh, O., P. Gardoni, and G. Paolo. 2020. “Probabilistic Framework to Evaluate the Resilience of Engineering Systems Using Bayesian and Dynamic Bayesian Networks.” Reliability Engineering & System Safety 198: 106813.
- Kang, J., L. Sun, H. Sun, and C. Wu. 2017. “Risk Assessment of Floating Offshore Wind Turbine Based on Correlation-FMEA.” Ocean Engineering 129: 382–388.
- Lazakis, I., and M. A. Kougioumtzoglou. 2019. “Assessing Offshore Wind Turbine Reliability and Availability.” Journal of Engineering for the Maritime Environment 233 (1): 267–282.
- Le, B., and J. Andrews. 2016. “Modelling Wind Turbine Degradation and Maintenance.” Wind Energy 19: 571–591.
- Li, M., J. Kang, L. Sun, and M. Wang. 2019. “Development of Optimal Maintenance Policies for Offshore Wind Turbine Gearboxes Based on the non-Homogeneous Continuous-Time Markov Process.” Journal of Marine Science and Application 18: 93–98.
- Liu, P., Y. Liu, B. Cai, X. Wu, K. Wang, X. Wei, and C. Xin. 2020. “A Dynamic Bayesian Network Based Methodology for Fault Diagnosis of Subsea Christmas Tree.” Applied Ocean Research 94: 101990.
- Montani, S., L. Portinale, A. Bobbio, and D. Codetta-Raiteri. 2008. “Radyban: A Tool for Reliability Analysis of Dynamic Fault Trees Through Conversion Into Dynamic Bayesian Networks.” Reliability Engineering & System Safety 93: 922–932.
- Murphy, K. P. 2002. Dynamic Bayesian Networks: Representation, Inference and Learning. Berkeley: University of California.
- Nielsen, M. A. 2011. “Parameter Estimation for the Two-Parameter Weibull Distribution.” MSc Thesis, Brigham Young University. https://scholarsarchive.byu.edu/cgi/viewcontent.cgi?article=3508&context=etd.
- Nielsen, J. J., and J. D. Sørensen. 2010. “Bayesian Networks as a Decision Tool for O&M of Offshore Wind Turbines.” In Proceedings of the 5th International ASRANet Conference, Edinburgh, June 14–16.
- Nielsen, J. S., and J. D. Sørensen. 2017. “Bayesian Estimation of Remaining Useful Life for Wind Turbine Blades.” Energies 10. doi:10.3390/en10050664.
- Norsys Software Corporation. 2021. Norsys – Netica Application. https://www.norsys.com/netica.html.
- Onyx Insight. 2019. Managing Planetary Bearing Failures on Aging Assets Through O&M Decision Support. https://oldwebsite.onyxinsight.com/2019/08/29/managing-planetary-bearing-failures-on-aging-assets-through-om-decision-support/.
- Reliasoft Blocksim. 2021. System Reliability, Availability, and Maintainability Analysis. Accessed September 2, 2021. https://www.reliasoft.com/products/blocksim-system-reliability-availability-maintainability-ram-analysis-software.
- Ren, Y., A. Wang, and H. Wang. 2015. “Fault Diagnosis and Tolerant Control for Discrete Stochastic Distribution Collaborative Control Systems.” IEEE Transactions on Systems, Man, and Cybernetics 45: 462–471.
- Shafiee, M. 2015a. “A Fuzzy Analytic Network Process Model to Mitigate the Risks Associated with Offshore Wind Farms.” Expert Systems with Applications 42 (4): 2143–2152.
- Shafiee, M. 2015b. “Maintenance Logistics Organization for Offshore Wind Energy: Current Progress and Future Perspectives.” Renewable Energy 77: 182–193.
- Shafiee, M., F. Brennan, and I. A. Espinosa. 2016. “A Parametric Whole Life Cost Model for Offshore Wind Farms.” The International Journal of Life Cycle Assessment 21 (7): 961–975.
- Shafiee, M., and F. Dinmohammadi. 2014. “An FMEA-Based Risk Assessment Approach for Wind Turbine Systems: A Comparative Study of Onshore and Offshore.” Energies 7: 619–642.
- Shafiee, M., T. Elusakin, and E. Enjema. 2020a. “Subsea Blowout Preventer (BOP): Design, Reliability, Testing, Deployment, and Operation and Maintenance Challenges.” Journal of Loss Prevention in the Process Industries 66: 104170.
- Shafiee, M., and J. D. Sørensen. 2019. “Maintenance Optimization and Inspection Planning of Wind Energy Assets: Models, Methods and Strategies.” Reliability Engineering & System Safety 192: 105993.
- Shafiee, M., G. Stamelos, M. M. Aziminia, T. Elusakin, T. Adedipe, and F. Dinmohammadi. 2020b. “Failure Analysis of Floating Offshore Wind Turbine Technologies.” In Proceedings of the 4th International Conference on Renewable Energies Offshore, Lisbon, Portugal, October 12–15.
- Sheng, S. 2014. Gearbox Reliability Database: Yesterday, Today, and Tomorrow. Chicago, IL, October 29–;31. https://www.nrel.gov/docs/fy15osti/63106.pdf.
- Smolders, K., H. Long, Y. Feng, and P. Tavner. 2010. “Reliability Analysis and Prediction of Wind Turbine Gearboxes.” In Proceedings of the European Wind Energy Conference, 2660–2670, Warsaw, Poland, April 20–23.
- Yang, D., and D. Frangopol. 2018. “Evidence Based Framework for Real Time Life Cycle Management of Fatigue Critical Details of Structures.” Structure and Infrastructure Engineering 14: 509–522.
- Yang, W., and J. Jiang. 2011. “Wind Turbine Condition Monitoring and Reliability Analysis by SCADA Information.” In Proceedings of the Second International Conference on Mechanic Automation and Control Engineering, 1872–1875, Hohhot, People’s Republic of China, July 15–17.
- Zhao, H., Q. Hu, and Z. Li. 2012. “Failure Prediction of Wind Turbine Gearbox Based on Statistical Process Control.” Power System Protection and Control 40: 67–73.