
 ?Mathematical formulae have been encoded as MathML and are displayed in this HTML version using MathJax in order to improve their display. Uncheck the box to turn MathJax off. This feature requires Javascript. Click on a formula to zoom.
ABSTRACT
This study evaluates the renewable energy potential in northern Afghanistan by employing the Analytical Hierarchy Process (AHP) and a genetic optimization algorithm. Eleven geodata layers, including factors like solar radiation, elevation, and proximity to various infrastructures, were considered for assessing suitable solar energy development sites across nine provinces. The research combines AHP and genetic algorithm approaches to determine optimal locations for solar energy projects, aiming to aid policymakers and investors in decision-making. Morphological factors such as slope, elevation, and solar radiation were identified as significant determinants of site suitability for solar photovoltaic systems. The study revealed that Afghanistan's northwest and western regions have the most promising areas for solar PV systems due to their lower topographic complexity. The genetic algorithm accurately outperformed AHP, identifying over 29,000 square kilometers of suitable land for solar power plants in northern Afghanistan. The outputs of genetic algorithm are classified into strongly suitable (4504 km²), moderately suitable (5899 km²), and suitable (7088 km²) categories for solar energy development. Balkh province demonstrated the highest potential with an area of 7960 km², while Badakhshan showed the lowest capacity. These findings offer valuable insights for stakeholders interested in solar energy development in northern Afghanistan, aiding them in making well-informed decisions and investments.
1. Introduction
Renewable energy sources have been used throughout history and are now recognized as necessary due to limited fossil fuels and environmental concerns (Al-Shahri et al. Citation2021; Zereshkian and Mansoury Citation2021). Fossil fuel burning causes pollution and increased CO2, which can be reduced by using renewable energy (Firozjaei et al. Citation2019; Belessiotis and Delyannis Citation2000; Moonchai and Chutsagulprom Citation2020; Zeng et al. Citation2017). Access to affordable and sustainable energy is essential for economic development, but Afghanistan has one of the lowest grid power access rates and relies heavily on imported energy (Korkovelos et al. Citation2017; Patmal and Shirani Citation2021). Hydro, thermal, and fossil fuel resources are the primary sources of domestic power generation, but there is significant untapped potential for solar and wind energy in Afghanistan (Qasimi, Isazade, and Toomanian Citation2022; Anwarzai and Nagasaka Citation2017; Mostafaeipour et al. (Citation2020). The world is moving towards sustainable and clean energy, and it is estimated that 28% of the world’s electricity will be produced from renewable sources by 2020 (Moonchai and Chutsagulprom Citation2020; International Energy Agency Citation2021; Zhang and Li Citation2021). Developing small hydro, solar, and wind energy plants and investing in new survey research are encouraged to meet the rising energy demand (Larentis et al. Citation2010; Janke Citation2010). Deploying solar energy in urban areas is becoming a dominant trend, and the right tools and procedures for evaluating local solar potential are crucial (Catita et al. Citation2014; Zhang and Li Citation2021). In terms of their functions, restrictions, research gaps, and contributions, solar energy systems apply the most modern intelligent optimization approaches introduced by (Al-Shahri et al. Citation2021). The review’s key finding is that the main goals of optimization strategies are to reduce emissions while increasing system dependability and investment, process, and maintenance costs. The inquiry further evaluated the significance of assertions by developing an optimization model to investigate the cost-effectiveness of large-scale solar energy deployment up to 2050 (Barbosa et al. Citation2020). A spatial and temporal assessment of resource disposal is necessary to fully use the potential of renewable energy sources (Datta and Karakoti Citation2010). The application of GIS models in site selection offers valuable insights for various fields. Shahabi et al. (Citation2016) compared the weighted linear combination (WLC) and fuzzy logic (FL) models to determine suitable locations for a water reservoir in Batu Pahat, Johor, Malaysia. The findings indicate that the FL method outperforms the WLC method in decision-making and validation, suggesting its usefulness for GIS analysis in identifying water reservoir locations in the area. Examining waste accumulation in Saqqez, Iran, Shahabi et al. Citation2014) investigated the impact of population growth and changing consumption patterns. They utilized geographic information systems and multi-criteria decision-making models, highlighting the effectiveness of AHP and WLC methods in identifying an appropriate landfill site for the city. In their recent work, Shahabi et al. (Citation2021) introduced a novel flood susceptibility mapping approach called DBPGA, which utilizes a Deep Belief Network (DBN) with Back Propagation (BP) algorithm optimized by the Genetic Algorithm (GA). The study demonstrates that the proposed model outperforms benchmark models, showcasing its potential as an effective tool for predicting flash flood susceptibility in regions prone to such incidents.
Models that deviate from straightforward empirical equations by using alternative algorithms and complexity. In order to help the model choose the best location for solar power plants, the process-based physical technique has been created to parameterize and calculate the prospective radiation (under clear-sky circumstances) and the actual radiation (under cloudy, overcast situations) (Liu et al. Citation2012). Meteorological data on solar radiation and wind speed simulate hourly facility factors for solar and wind power in Germany from 1995 to 2015. These data are transformed into time series of electrical power output using data from renewable energy production in 2015 (Drücke et al. Citation2021). According to the results, the energy-sharing network for interactive building vehicles has greater resilience and competitiveness than the traditional isolated system regarding cost, pollution, and energy flexibility (Zhang et al. Citation2021). An approach was created using a geographic information system. It gave the resources needed to access the temporal and spatial gaps between solar radiation and energy demand. The monthly and annual coverage of the water heating load is estimated using a geographic database containing climate data (Voivontas, Tsiligiridis, and Assimacopoulos Citation1998). A GIS MCDA-based methodology for passive solar design for water heating has been created and will greatly ease the use of solar energy (Rylatt, Gadsden, and Lomas Citation2001). In spatial site evaluation, several research endeavors have employed genetic optimization algorithms and provided insights into the feasibility of such algorithms. For instance, ) in Ireland, a study employed genetic algorithms to optimize the placement of vehicle charging stations with a dimension of 350 km by 250 km in Irish territory, and the results demonstrated that genetic algorithms were able to determine the most fitting charging locations within the designated area (Zhou, Zhu, and Luo Citation2022). Another study in India integrated multilayer perceptrons and genetic algorithms to map appropriate sites for constructing solar photovoltaic installations. The findings indicate that the functional capabilities of genetic algorithms outperformed other models(Malemnganbi and Shimray Citation2022a). Additionally, in Spain, a study deployed genetic algorithms to identify optimal sites for solar photovoltaic installations, and the study outputs provided evidence of the capabilities of genetic algorithms in determining site suitability for solar photovoltaic projects (Nagkoulis, Loukogeorgaki, and Ghislanzoni Citation2022).
A country’s success depends on energy independence since it allows less reliance on foreign energy sources. Socio-economic success and the growth of national stability are intimately correlated with energy independence and promoting domestic source diversification. The nation has enough primary energy resources to accomplish this goal, but converting those resources into secondary energy that the country can use requires cutting-edge technology and skills. There are cheap and easily accessible domestic natural resources, particularly the hydropower potential, which can be used cost-effectively in various ways with less advanced technologies and low costs. Ensuring sustainability and limiting greenhouse gas emissions are crucial (Sadat and Sabory Citation2020). Afghanistan can produce renewable energies using solar radiation, wind, and water resources. Required energy inside Afghanistan is generally prepared by imported energy from neighboring countries such as Turkmenistan, Uzbekistan, Tajikistan, and Iran. This study aims to find the most suitable locations and facilities to produce renewable energies in the north of Afghanistan and assess the capacity of renewable energy production in nine provinces in Afghanistan. Furthermore, it intended to identify the sustainable location for solar energy plants using the weighted linear combination (WLC) and Genetic Algorithm (GA) within nine provinces in northern Afghanistan. This research presents a novel approach to assessing the potential for renewable energy sources in northern Afghanistan. By combining the Analytical Hierarchy Process (AHP) and genetic optimization algorithm, the study identifies the optimal locations for solar energy development in nine provinces. This study investigates the effectiveness of genetic algorithms (GA) and the Analytic Hierarchy Process (AHP) in solar power site selection. It is important to note that our comparison comparing takes a qualitative approach rather than relying on specific metrics. By assessing each region individually, we aim to evaluate the accuracy and suitability of the GA solution compared to AHP.
2. Data and methodology
2-1. Study area
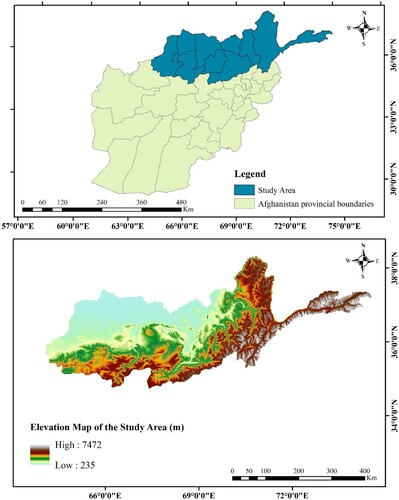
The study area is located in the north and northeast parts of Afghanistan, with an area of 161,883 km2. The specified research area’s geographic coordinates are between 34° 52’ 47” to 38° 29’ 28” north latitudes and between 63° 52’ 59” to 74° 53’ 39” east meridian longitudes. The study area comprises nine provinces, from east to west: Badakhshan, Takhar, Kunduz, Baghlan, Samangan, Balkh, Sari Pul, Jawzjan, and Faryab. These nine provinces collectively cover 26% of Afghanistan’s total land area. The population of the research area is 8,736,732 people, constituting 30% of the country’s total population. The case study area represents a complex landform geomorphologically, and the elevation varies from 235 meters in the west to 7472 meters in the east. Afghanistan typically experiences an arid continental climate with cool, rainy winters (with a peak in the spring) and warm, sunny summers. Significant differences depend on area and altitude: the western part of the study area is desert, the south is rather cold because of altitude, and the east has freezing weather because of the high mountains. Jawzjan, Balkh, Faryab, Samangan, and Baghlan provinces have an arid climate (almost no precipitation during the summer and fall) (Qasimi, Isazade, and Toomanian Citation2022) . The selected study area comprises nine provinces that share their borders with four countries: China, Tajikistan, Uzbekistan, and Turkmenistan, respectively, from east to west.
Three crucial trade ports in the selected study area make the subject more critical. However, these harbors can affect the population density in any geographical location of the study area. North Afghanistan possesses suitable lands for agriculture and fertile rivers and is currently regarded as the primary source of the nation’s domestic products. Economic growth, Social Welfare, and Solving the electricity difficulties in this area will expedite growth. The selected study area in North and Northeast Afghanistan is suitable for building solar farms due to several factors. The region receives abundant solar radiation throughout the year, has a large land area that provides ample space for solar farms, features diverse geography that allows for innovative solar panel mounting systems, and has a growing population with rising demand for electricity. Additionally, the study area’s strategic location, sharing borders with four countries and featuring three crucial trade ports, could enhance energy security and economic activity in the region and its neighbors. 3- Solar energy offers significant benefits to the selected study area for multiple reasons. Firstly, it reduces dependence on energy imports, promoting energy independence and enhancing overall energy security. Secondly, by utilizing clean solar energy, the region can combat air pollution and contribute to a cleaner and healthier environment. Additionally, the current imported energy falls short of meeting the growing energy demand, highlighting the urgent need for solar energy farms. These farms can tap into abundant sunlight, providing a sustainable and reliable power source. Overall, adopting solar energy is imperative for addressing energy needs and fostering a greener future in the selected study area. The geographical location of the research is presented in .
Figure 1. a) presents the map and coordinates of Afghanistan, and b) indicates the research area.
2-2. Data
The data for this research were collected from various sources, each explained in detail independently. The summary of the information regarding to the source data is provided in .
Table 1. Presents a concise overview of the source datasets utilized in this research.
2-2-1. Population of the cities
The latest update of the estimated population for the selected study area is acquired from (http://www.nsia.gov.af/) used in this research and presented in () in detail and classified based on the rural and urban population.
Table 2. Population of study area separated by provinces.
2-2-2. Solar radiation
The suitable sites for solar energy were highly determined according to the solar radiation (Patel and Singal Citation2019). The solar radiation for the north of Afghanistan was calculated using Shuttle Radar Topography Mission (SRTM) data with a resolution of 30 × 30 meters. The calculated surface solar radiation indicated an annual average of 1543 kWh/m2, which exhibits that the north of Afghanistan is one of the potential locations to install solar PV power plants. Due to the vastness of the study area, the surface solar radiation was calculated for 5000 randomly distributed points utilizing ArcGIS 10.8. After calculating the solar radian for the selected random points, the obtained values were interpolated using inverse distance weighting (IDW). Solar radiation in the north of Afghanistan exposed an annual minimum value of 381 kWh/m2 and a maximum value of 2656 kWh/m2, which is feasible for installing solar panels. The obtained raster is classified into five classes according to suitability (). presents classified solar radiation for the study area.
Figure 2. Map of criteria used in this research; a) solar radiation, b) LST, c) slope, d) elevation, e) aspect, f) distance to grid network, g) distance to road, h) distance to rivers, i) distance to the residential area, j) land use/cover, k) air temperature.
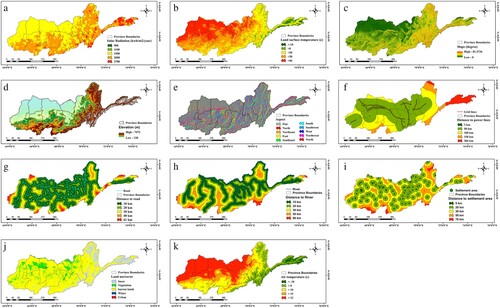
Table 3. Statistical information of the criteria used in this research.
2-2-3. Land use/Cover
The optimal sites should expose topographic land use features to install a solar power plant, according to the IEA (International Energy Agency) and NREL (National Renewable Energy Limited, USA). They are; a) plain regions, b) Without shadow, and c) non-agricultural lands. In the case of the selected study area, a land use/ cover map was created using sentinel-2 high-resolution Images utilizing the google earth engine platform. Support vector machine SVM algorithm is used to extract various classes of LULC maps of the study area. Four classes are obtained for the LULC map, relative information about this criteria is provided in , and the map of LULC is presented in .
2-2-4. Digital elevation model
The elevation is considered an essential factor for selecting suitable solar energy sites. The digital elevation model allows one to consider the essential roles of the topographic characteristics (elevation, aspect, slope, and Skyview). In complicated terrain, the distribution of solar radiation changes significantly. The effect of the topography can be calculated using the DEM and a geometric method whose correctness relies on the DEM resolution. For each point, the digital elevation model offers the artificial horizon and relative position of the sun (Dubayah and Rich Citation1995). It is also possible to predict the direct and diffuse solar irradiance given the sun’s location at each time and for each point in the region, allowing one to ascertain whether direct and diffuse radiation makes up most of the global radiation (Tovar-Pescador et al. Citation2006). The DEM of the Shuttle Radar Topography Mission (SRTM) calculates the study area’s solar radiation, elevation, aspect, and slope. presents the digital elevation of the area, and presents the classified elevation of the research area.
2-2-5. Slope
The slope measures steepness or inclination to the horizontal plane(Türk, Koç, and Şahin Citation2021). The slope is considered necessary in specifying the optimal location for solar power plants. The amount of solar radiation received by the earth’s surface varies according to slope degrees. Moreover, the slope degree affects the placement of solar panels to harvest the sun’s energy. Using ArcGIS 10.8, the slope of the study area was created using the Shuttle Radar Topography Mission (SRTM) with a resolution of 30 m DEM and classified into five classes. , presents the values and classes for the slope of the study area.
2-2-6. Aspect
Aspect is considered an essential factor in solar PV power plants; the direction of the aspect significantly impacts the amounts of solar energy received by the earth’s surface (Munkhbat and Choi Citation2021). The east, west, and south receive more solar radiation than other northern hemisphere aspects. Flat and south aspects receive the highest amounts of sunshine in different seasons (Soydan Citation2021). Aspect maps for the specified study area were created using the SRTM digital elevation model with a resolution of 30 m and reclassified into five classes according to the direction. shows the slope map of the study area, and presents detailed information on the slope of the research area.
2-2-7. Distance to the transmission line
The transmission network data in polyline shapefile format was obtained from (Afghanistan - Transmission Network - Datasets - ENERGYDATA.INFO, 2017). The transmission grid shapefile includes the main transmission lines that pass through major cities. The polylines were clipped to the extent of the research area. ArcGIS was used to create a polyline shapefile from the transmission grid data and clip it to the desired study area. The clipped polylines used to calculate the proximity to these lines were classified into five classes and presented in , and the statistical details are provided in .
2-2-8. Distance to road
The road is essential in identifying suitable solar energy power (PV) locations. Regarding equipment transportation, access to the site, regular maintenance, and monitoring, the road plays a significant role in building the solar power gathering plant. The construction site, however, will be located outside a specific road buffer zone. displays the proximity of the study area to the road network. The road networks for Afghanistan were received as a polyline shapefile from the World Bank data source and clipped according to the extent of the study area. The distance to this network was calculated using ArcGIS 10.8’s Euclidean distance tools. indicates the information related to proximity to roads.
2-2-9. Distance to river
The distance to rivers is essential because of the various rivers in the research area. The river network was extracted from SRTM DEM and used to create the distance map to the rivers utilizing Euclidean distance tools of ArcGIS 10.8. According to the reviewed publications, the raster is divided into five classes. The information related to this criteria is provided in , and shows the distance map to the rivers.
2-2-10. Distance to the residential area
Constructing SPPs close to residential neighborhoods should cause environmental issues and influence the future growth of inhabited regions (Soydan Citation2021). On the other hand, areas with a long distance to residential areas could not be more economically favorable since the closeness to residential areas could be vital for delivering the occupants’ necessary electricity [32]. As a result, locations with fewer than 30 km and more than 3 km are deemed the most acceptable. Areas with a distance of more than 50 kilometers but fewer than 3 kilometers are regarded as less desirable. The distance map to the settlement regions is shown in .
2-2-11. Land Surface Temperature
Land surface temperature directly depends on the amount of solar radiation received by the earth’s surface. Hence it is considered an essential factor in selecting feasible sites for solar power plants(Türk, Koç, and Şahin Citation2021). The land surface temperature map for the chosen research region was produced using Landsat 8 images with a spatial resolution of 100 by Equation (1) utilizing the Google Earth Engine cloud computing platform.
(1)
(1) LST is the calculated land surface temperature in Celsius, TB is the brightness temperature, and PV is the Proportion of the vegetation (C. L. Yin, Meng, and Yu Citation2020). The Obtained surface temperature map is classified into five classes in ; detailed information related to LST is provided in .
2-2-12. Air temperature
In this study, an annual average Land Data Assimilation System (LDAS) product for 2020 is utilized for air temperature with a resolution of 0.1 degrees. The resultant raster is resampled according to the resolution of other data in 30 m and categorized into five classes. The air temperature map of the research region is shown in , and the statistical information for this thematic layer is shown in .
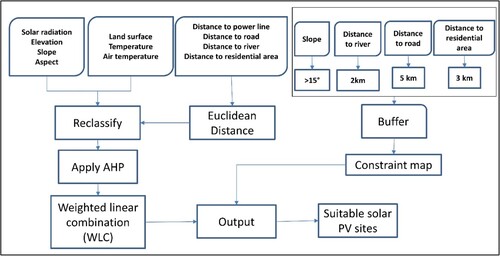
2-3-1. Methodology
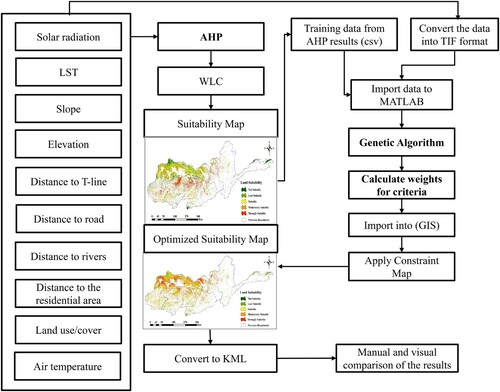
The methodology utilized in this study involved the integration of genetic algorithms (GA) and the Analytic Hierarchy Process (AHP) to facilitate the selection of solar power sites. The AHP results were employed as inputs for the GA to achieve this. The genetic algorithm was trained in the optimization process by utilizing the AHP approach, which offered valuable insights and prioritization regarding the selection criteria for evaluating solar power sites. This integration was instrumental in effectively harnessing the AHP information to train and enhance the performance of the genetic algorithm throughout the site selection process. A well-designed method will produce acceptable research results (Türk, Koç, and Şahin Citation2021). Site selection for large-scale solar PV plants and turbines is complex, and many factors must be considered (Munkhbat and Choi Citation2021). Solar potential alone is insufficient; land suitability and disposal must also be considered (Munkhbat and Choi Citation2021). As described in the previous section, the case study data came from multiple sources and formats to meet this condition. Image processing, spatial data modeling, and coding used various software packages. Google earth engine platform is used to obtain land use/cover maps and land surface temperature, and Javascript is used to analyze and process satellite images. ArcGIS 10.8 prepares all data for modeling, site selection, and final maps and outputs. Expert Choice calculates criteria weights. MATLAB software codes the Genetic algorithm to optimize selected sites. presents the workflow of the current research.
Figure 3. Workflow of the methodology.
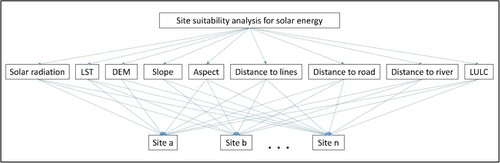
2-3-2. GIS-based multicriteria analysis
Site selection for large-scale solar PV encompasses social, technological, environmental, and economic considerations (Kundakcı Citation2019). In order to confront this challenge, Multicriteria Decision Making (MCDM) techniques are utilized by researchers and policymakers to effectively handle and integrate diverse factors that have been scrutinized through various methods (Kundakcı Citation2019). The decision-maker can discern and choose suitable locations (Gerbo, Suryabhagavan, and Kumar Raghuvanshi Citation2020). depicts the link between objectives, criteria, and options. Multicriteria decision-making (MCDM) is a commonly used method in GIS for selecting suitable sites for various purposes. Various methods of MCDM are used in site suitability analysis, including Analytic Hierarchy Process (AHP). Analytic Network Process (ANP), Technique for Order of Preference by Similarity to Ideal Solution (TOPSIS), Weighted Linear Combination (WLC), Simple Additive Weighting (SAW), Ordered Weighted Averaging (OWA). AHP (Analytical Hierarchy Process) is a widely used MCDM method for site selection in GIS. AHP is preferred over other MCDM methods because of its Flexibility, Simplicity, and Transparency. Overall, AHP is a powerful tool for decision-making in GIS. Its application in selecting suitable sites for solar energy projects can help identify the most viable options and maximize the benefits of renewable energy.
2-3-3. Analytical hierarchy process (AHP)
AHP prioritizes qualitative and quantitative variables. AHP determines the best location for solar power plants (Al Garni and Awasthi Citation2017; Yahyaoui Citation2018). AHP is used in GIS-based site selection because it is simple and effective. Creating a per-wised compression matrix determines the relative importance of criteria and sub-criteria. Per-wised compression matrices are used for solar site analysis . Using the importance scale to create matrices (Yahyaoui Citation2018). In , ‘W’ indicates importance, and ‘I’ and ‘j’ are per-wised factors. Clustering is required to compare more than nine input matrix criteria.
Calculating the weights for each factor: the compression matrix only identifies the importance of one criterion compared to another. The weights for each column can be calculated according to Equation (2) (Mostafaeipour et al. Citation2020).
(2)
Table 4. Dictates the scale of the importance.
Table 5. Shows the compression of the criteria.
Table 6. Presents the Random index values.
Table 7. Per-wised compression matrix for solar power site selection.
The accuracy of the AHP result depends on how consistently the compressions are applied to the resulting matrix. Consistency ratio CR, which is called accuracy rate, is calculated. The number of factors and a coefficient known as the base value (λ) are compared to determine the CR value. When determining the λ value, the comparison matrix A and the weight matrix of W are used to create the D column vector. The mutual elements section of the weight column D and the weight matrix of W Eq are used to calculate the basis value (E) for each evaluation factor (4). The arithmetic mean of these values yields the base value (λ) for comparison, as shown in Equation (6).
(4)
(4)
(5)
(5) After calculating the basic value λ, the consistency index (CI) is calculated in Equation (6).
(6)
(6) In Equation 5, the λ is the basic value, and n is the number of the criteria.
Eventually, the CI is divided by the random indicator value to obtain the consistency ratio Equation (7); the Random indicator values are presented in
(7)
(7)
2-3-4. Weighted Linear Combination (WLC)
Weighted Linear Combination (WLC) is a multicriteria assessment model based on geographic information systems (GIS). This model is extensively used for land suitability analysis, land-use priority, and site selection by standardizing values, weighting, and overlapping (Overlay) (Subandi and Ardiansyah Citation2019). WLC based on GIS can provide clarifications and considerations for various criteria in selecting absolute locations suitable for development for specific activities (Yin et al. Citation2020a). WLC calculates the final value of land suitability by combining all the factors/sub-factors and constraints (Silva-Gallegos et al. Citation2017). WLC is a method for combining triggered parameters affecting a landslide using weights. The primary issue with this method is assigning weights to each parameter separately (Silva-Gallegos et al. Citation2017). The weighted linear combination is mathematically defined as Equation (8).
(8)
(8) where S is the suitability, wi is the Normalized weight of factor i, and xi is the criterion score of factor i.
Following the preparation of thematic layers for the factors, reclassification, and the acquisition of weights for each criterion, WLC was used to determine the most suitable sites for solar PV plants. The methodological process is shown in .
Figure 4. Presents the AHP structure.
2-4. Genetic algorithm
The genetic algorithm is a computational model replicating biological evolution’s genetic selection and natural elimination processes (Mehdipour et al. Citation2011). Wu and Shan (Citation2000) carried out groundbreaking research in this area. The goal was to narrow the vast search space to the local or global optimum solution. In contrast to conventional artificial intelligence (AI) optimization algorithms, the genetic algorithm can automatically gather the necessary information about the search space during its search process and self-adaptively control the entire search process using random optimization techniques (Kumar et al. Citation2020). As a result, the likelihood of acquiring the optimal global solution increases without dealing with the combinatorial explosion brought on by ignoring the crucial information within the search space (Buontempo Citation2019). The genetic algorithm also stands out for its ease of use, resilience, ability to adapt to parallel processes, and application adaptability. Combinatorial optimization and non-linear issues with challenging constraints or non-differentiable objective functions have been solved using it (Van Dijk, Thierens, and De Berg Citation2002). Genetic selection and natural removal in biological evolution are modeled in the computation of genetic algorithms. Candidate solutions are kept and ranked following their quality in each iteration. Unqualified members of the generation are weeded out using a fitness value. These suitable solutions are then subjected to genetic operations like mutation, crossover, translocation, and inversion to estimate new candidate solutions for the following generation. The procedure, as mentioned above, is repeated until a specific convergent condition is met. The traditional knapsack problem illustrates the principle and its Algorithm (Wu and Shan Citation2000).
2-4-1. The general structure of the genetic algorithm
Objective function
Suitable site selections based on their purpose comprise objectives. The final objectives must be compatible with the environmental and economic issues in the research area. MCDM and MODM should be integrated with genetic algorithms to obtain feasible and consistent outputs. The fitness function aims to identify suitable sites for solar power, considering various variables. The genetic algorithm encompasses two primary goals: minimizing certain factors and maximizing others. The factors targeted for minimization include distance to transmission lines, roads, population centers, elevation, and slope. Conversely, the aim is to maximize solar radiation, land surface temperature, and air temperature. To integrate these objectives, fitness scores are assigned to potential solutions based on their ability to meet both criteria effectively. The fitness function assesses the feasibility of each solution and assigns a corresponding score. Feasibility is determined by minimizing the distance to transmission lines, roads, population centers, elevation, and slope while maximizing solar radiation, land surface temperature, and air temperature. The objective functions conducted in this research are as follows:
Minimization: minimizing the distance to the settlement areas, roads, transmission lines, and slopes is necessary to reduce the cost of implementation and result in efficiency. The closeness of the selected sites to the national electricity grid networks provides the facilities to connect generated power from the installed site to the national grid of the network. The allocated sites must have less distance from the populated area, Urban areas, and industrial parks to expose economic and effective utilization. The increase of the slope degree will decrease the efficiency of the land suitability; hence the slope degree must be minimized. Afghanistan is a mountainous country. The elevation varies significantly within a more prominent geographical location, and the location with an altitude more remarkable than a threshold is inappropriate for installing solar PV. The minimizing function is presented in Equation (9)
Maximizing the benefits: The effectiveness and viability of the designated site will increase by maximizing solar radiation. The potential for power generation will increase in areas with higher levels of solar radiation, and the maximizing functions are defined below:
the degree of the slope increases, and the suitability of the land decreases
2-4-2. Fitness function
To solve any problem using genetic algorithms, a fitness function must first be devised for that problem. For each chromosome, this function returns a non-negative number that indicates that chromosome’s individual merit or ability (Nagkoulis, Loukogeorgaki, and Ghislanzoni Citation2022); the workflow of the GA optimization is presented in .
Figure 5. The workflow of the methodology, based on the AHP method.
3. Results and discussion
3-1. AHP suitable maps for solar PV obtained utilizing WLC
All selected data is processed and categorized to create solar energy maps. The weighting process is conducted using the AHP method to determine the degree of importance of the layers. Consequently, the calculated weights are applied to generate the suitability maps for Solar energy potential locations. Totally nine criteria are utilized for the solar energy suitability assessment, and nine for each of them, according to the AHP process, three factors (Solar radiation, slope, and aspect) exposed more importance than the other criteria. Pairwise compersion metrics and the obtained weights for each criterion are presented in ( and ).
Table 8. Obtained weights for the criteria for the solar PV.
3-2. Potential area for solar PV
The potential area for solar energy, according to the AHP method, is specified mainly in the southern and western parts of the study area. The result obtained for the solar PV by AHP highly depends on the calculated weights of the layers. According to the AHP, the higher weights are dedicated to the Solar radiation, Slope, and Aspect, respectively, due to the ranks of the slope being the most suitable areas exposed in southern parts of the study area because of the availability of the higher amount of solar radiation. East and northeast parts of the research area, especially the provinces of Badakhshan, Takhar, and Baghlan, exhibited less suitable areas because of the higher heterogeneity of the topography. This province was selected as less suitable or non-suitable in the AHP process. The eastern parts of the Badakhshan province are classified as non-suitable areas. Three suitable areas are distributed in small areas in the north and south of this province and cover small areas.
According to economic aspects, this area is considered less feasible because of the low adequate area and high dispersion. Applicable regions in Badakhshan province are primarily revealed in the western part of this province, with lower dispersity, higher aggregation, and a combination of the pixels, making this region feasible according to financial aspects. Moreover, this region is near the province’s primary and secondary roads, which will help its applicability. Generally, a 1061 sq km area is classified as a low feasible area, 216 km as suitable, 279 sq km as moderately suitable, and 426 sq km as firmly suitable lands for Solar power potential area. According to the AHP result, Takhar province can be divided into two major geographical regions. The southern part is considered a non-feasible area due to its complex topography and high slope. Suitable location potential for solar energy is exposed in northern and central parts of this province, which has more application flexibility because of owning transportation and transmission facilities. All three classes of suitable regions in this province are situated parallel to the transmission lines and roads, which facilitates the application and causes lower power loss in connecting to transmission lines. Totally 1665 sq km was selected as the suitable and less suitable area, 147 sq km as less suitable, 307 sq as suitable, 377 sq km as moderately suitable, and 844 sq km as intensely suitable locations within this province. Baghlan and Pol-e-Khumri are productive cities, so specifying potential solar PV areas close to these cities will significantly impact the cost and productivity of the industrial goods in this province. High-suitable areas in Baghlan Province are primarily specified within regions with lower elevation and flat topography, parallel to the highway of Kunduz Kabul and near Baghlan and Pol-e-Khumri cities. Generally, 531 sq km area is classified as less suitable and 479 sq km as suitable, 545 sq km as moderately suitable, and 1168 sq km as the highly suitable area in this province, strongly suitable locations mainly situated within the plain areas between the mountains and spatially dispersed in different locations. The western part of this province which has a smoother topography and low elevation and contains vast plains is classified as moderate and strongly suitable.
The provinces of Kunduz, Samangan, and Balkh revealed a medium potential of suitability. Suitable locations in Kunduz province are exposed primarily on northern and northwestern parts of the province, mostly bare lands and covered by sands which are highly feasible for solar PV according to land const and economic aspects. Kunduz province is one of northern Afghanistan’s most active industrial and agricultural provinces. Utilizing renewable and sustainable energy will improve this province’s economic activities and productivity. According to this province’s land usability, agricultural lands are excluded and considered constraint areas. All suitable classes in this province are mainly distributed in the eastern and southeastern parts, western parts, and partially in the northern parts of this province. A total of 3292 square kilometers in this province have been determined to have solar energy potential; of these, 156 are deemed less suitable, 1317 to be suitable, 1569 to be moderately suitable, and 250 to be strongly suitable for solar PV generation. Samangan province exposed a high potential for suitability compared to neighboring provinces; all the classes of the suitable regions, especially the regions categorized as strongly suitable located in the center and northern parts of this province, which have a lower distance to the grid lines and road networks. The total area with solar energy potential in this province was calculated at 3076 sq km, 111 sq km considered less suitable, 237 sq km as suitable, 506 sq km as moderately suitable, and 2222 sq km classified as strongly suitable in Samangan province. Potentials of solar PV in Balkh province exposed a well geographical distribution; the strongly suitable class of potential is situated mainly in the southwestern part of this province, while other classes are distributed in the north and eastern parts. Balkh Province exposed the highest amount of potential solar energy area compared to other provinces of the selected study area. This province’s total potential for solar energy is calculated at 7960 sq km, 355 sq km as less feasible, 2667 sq km as suitable, 3118 sq km as moderately suitable, and 1890 sq km as strongly feasible. Considering this province’s economic and industrial role, applying this potential will increase the productivity of this state and mitigate the existing problem of energy access.
The potential area for solar PV in Sari-pul province is specified chiefly in the northern part of this province; southern parts are connected with the mountains and have a complex topography. Due to this reason, this region of the province needs to have the potential to build solar farms. Southern parts of the province contain suitable areas from suitable classes, and some regions of moderately suitable; the strongly suitable classes are rarely available in this region. In contrast, the northern parts of this province exposed more capability to be suitable for building solar PV plants. The strongly suitable category of potential in this province revealed well spatial distribution, which increases the feasibility and provides the facility to expand the farm. The total area specified as the potential region in this province according to the AHP model is 3322 sq km, 416 sq km categorized as less feasible, 580 sq km as suitable, 768 sq km as moderately suitable, and 1558 sq km classified as the strongly suitable area in this province. Specified locations, especially in middle and robust classes, are situated close to the grid line and transportation network, and these facilities will simplify the application and minimize the financial cost.
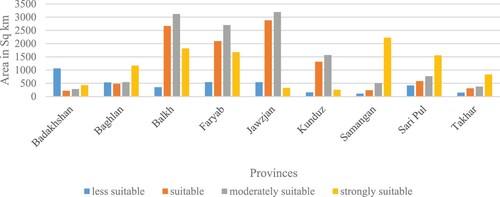
Most potentials exposed in Jawzjan province are classified into suitable and moderate classes. The region with the strong potentiality has the lowest area in this province; the total area for the potential of solar energy in this province is 6946 sq kilometers, 544 sq kilometers as less feasible, 2880 sq kilometers as suitable, 3195 kilometers as moderately suitable and 327 kilometers as strongly suitable. Faryab provinces revealed a high capability of solar potential, especially in middle and robust suitability classes. The strongly suitable class of the potential is spatially distributed in the southern parts of these provinces, while other classes are dispersed mainly in the northern parts. The total potential obtained for this province is 7015 sq kilometers, and 545 sq kilometers in the less feasible class, 2092 sq kilometers in the suitable class, 2702 in the moderately suitable class, and 1676 kilometers categorized as strongly suitable. Considering land availability and cost, Faryab is one of the most capable provinces for building solar PV plants. Statistical information related to the amount and level of the potential area within each province is provided in and presents the spatial distribution of the potential locations.
Figure 6. Indicates conducted workflow used in GA optimization.
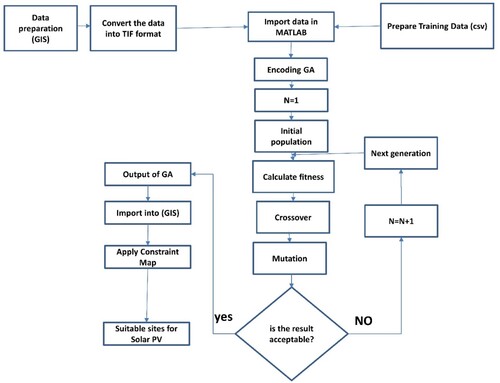
Figure 7. Indicates available lands of potential, based on classes of potentiality and provinces
3-3. Result of genetic optimization algorithm For solar PV
A genetic optimization technique determines the most appropriate weights for each layer to determine the most accurate prospective sites within the study region. GA exposed more accurate results compared to the AHP method. The outcome of the AHP approach was used to train a genetic algorithm, which was then used to apply a genetic algorithm. For this issue, the 5000 randomly distributed points created and the values of eight of the most critical factors (Elevation, Slope, Aspect, Solar radiation, Land surface temperature, Distance from transmission lines, distance from road, and Distance from settlement areas) were extracted for the created points and the suitability value of AHP result as well. We introduced two specific records to the training data to enhance the genetic algorithm’s (GA) performance in optimizing the solar power site selection. The first record was designed with optimal values for each variable, representing the highest suitability (assigned a value of 1). This record serves as an example of the most favorable conditions for solar power site selection. Conversely, the last record in the training data was created with unfavorable values for each factor, representing the lowest suitability (assigned a value of zero). This record represents the minor desirable conditions for solar power site selection. By including these extreme cases in the training data, we aimed to train the GA optimization algorithm to recognize and prioritize the most suitable sites for solar power generation. To achieve this, the training data, including these records, was imported into MATLAB and used to train the genetic algorithm. This approach allowed the GA to learn and adapt based on the provided training data, helping it to make more informed decisions when optimizing the selection of solar power sites. presents the weights for each layer.
Table 9. Presents the weights of layers calculated by GA.
3-4. Potential area for solar PV
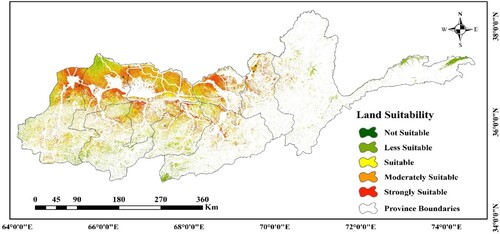
the result of the genetic algorithm revealed the high impacts of the morphological factors on the area’s suitability. the slope, elevation, and solar radiation highly affected the output obtained by the Genetic algorithm. The global analysis of the GA result shows that the most potential locations are in the northwest and western parts of the study area, which have lower topographic complexity. The capability of the provinces increases from east to west.
Mountainous provinces are exposed to low potentiality compared to those with smothered topography. Badakhshan, Takhar, Baghlan, and Sari-pul provinces have a lower capability of solar PV potential according to the result acquired by the GA optimization algorithm. Badakhshan province, in the eastern part of the study area with the most complex topography, shows the lowest potentiality considering the total area of this province. The eastern parts of this province indicate non-suitability, and suitable classes are rarely seen in the northern and southern parts. The suitable locations indicated by moderate and strong classes are spatially distributed in this province’s central and western parts. The dispersion of the suitable pixels shows an improper distribution. In most conditions, only a few suitable pixels are visible together; this improperness will negatively affect the building of large-scale solar farms in this province. Meanwhile, the suitable locations are close to Faizabad city, the center of this province and the most populated area. The total area potential for the solar energy calculated according to GA results for this province is 559 sq kilometers, 274 sq classified as low suitable, 125 sq kilometers as suitable, 104 sq kilometers as moderately suitable, and only 56 sq kilometers as suitable locations for solar PV in this province.
Takhar Province exposed the next lowest potentiality of solar energy. The southern parts of this province are determined as non-feasible locations for solar PV. At the same time, the suitable classes are distributed mostly in the central and northern parts of this province. The spatial dispersal of the suitable pixels shows a proper distribution, providing the facility to build large-scale solar farms. According to the GA results, the overall competent area for solar energy in this province is 1510 square kilometers, of which 452 square kilometers are classed as less practicable, 332 square kilometers as appropriate, and 355 and 371 kilometers as highly and strongly suitable, respectively. According to the availability of relevant infrastructures like transportation facilities and transition lines, specified potential locations have a high application capability. The outputs of the GA for Baghlan province indicate that the potential region for this province is available in the northern and northwestern parts. According to the result of GA, The southern and southeastern parts are generally considered infeasible locations for solar PV, potential lands are available among the valleys and in the lowlands, and the availability increases toward the northern part of the province. The prospective places are more accurately assessed when considering this province’s economically vibrant areas and cities. The aggregation and spatial delivery of the suitable pixels indicate an appropriate distribution and strongly facilitate the application and building of large-scale solar power plants in this province. The total area for solar energy in this province is 1737 sq kilometers and classified into the classes of less suitable, suitable, moderately suitable, and strongly suitable, respectively, 735 sq kilometers, 434 sq kilometers, 360 sq kilometers, respectively, and 208 sq kilometers. GA results for Kunduz province reveal that this province has a high capacity for producing solar energy. Although the spatial distribution of potential sites is comparable to the AHP results, the capacity amounts display a sharp contrast. Suitable pixels indicate a high dispersion in the southern parts of this province, while the distribution of these pixels shows a feasible uniform in the central and northern regions.
Kunduz province is one the most economically active provinces, and high-cost imparted energy from neighboring countries covers the required electricity for this province energy Reduces the profitability of factories and agricultural products. Utilization of this potential will greatly facilitate the growth of the economy and lifestyle of this province and the country. The total specified potential area for solar PV in this province, according to the GA optimization algorithm, is 3063 sq kilometers, of which 1332 sq kilometers of this area are classified as strongly and moderately suitable, and 1732 sq kilometers are ranked as suitable and less suitable. Northern parts of this province are mostly covered by plains unsuitable for agriculture due to a lack of water availability. Considering this condition, these are highly qualified for installing solar power plants. Selected potential location situated close to the transmission lines and transportation roads, which simplifies and facilitates the application and efficiencies. The total potential area for utilizing solar energy in this province specified by the genetic algorithm is 2269 sq kilometers. The area of each class respectively, from less suitable to strongly suitable in square kilometers, are 1077, 560, 398, and 234. This area will be capable of generating 357 GWh of electricity annually.
The results obtained from GA for Balkh province have divulged that the northern regions of this province manifest greater suitability for the generation of solar photovoltaic (PV) energy compared to the eastern and southern parts of the province. Further, the presence of expansive plains in the northern areas of the province has bolstered the efficiency and practicality of these locations for solar PV energy production. Balkh is one of the most productive and economic provinces characterized by factories and national and internal trades. Using Solar PV as clean, chef, and sustainable energy will greatly help the economy’s growth and trade in this part of the country. According to the genetic algorithm’s outcomes, the spatial disperse of the suitable pixels shows a good distribution and spatial aggregation, simplifying the application of the available potential in this region. The potential area for solar PV in this location was determined to be 7210 square kilometers, indicating a strong capability. Within this province, 2869 square kilometers were rated as less suitable, 1774 square kilometers as suitable, 1577 square kilometers as somewhat suitable, and 990 square kilometers as the most practicable place. The specified area in this region will generate 1374 GWh of energy per year.
Sari-pul province, in the southwestern part of the study area, exposed a high potentiality, especially in the middle and strong classes. In contrast, GA exposed that this region has a lower potential for solar PV. Southern parts are generally categorized as non-suitable for producing solar energy, and the capable locations are in the center and northern parts of the province. The most potential locations are connected with the potential regions of the neighboring provinces, which facilitates the application and utilization of this capacity. 992 sq kilometers out of 1958 is classified as less suitable, 487 sq kilometers as suitable, 340 sq kilometers as moderately suitable, and 139 sq kilometers ranked strongly feasible in this geographical location. All the suitable classes in Sari-pul will be capable of generating 290 GWh of electricity in a single year. The genetic optimization algorithm revealed the most feasible and suitable results for the provinces of Jawzjan and Faryab in the western part of the study area.
Suitable locations in Jawzjan province are predicted mostly in this province’s central and northern parts. The aggregation and neighboring of the suitable classes in these two provinces are followed by the suitable classes and show a uniform and well distribution. This region contains many plains left without application due to a lack of water for agriculture and irrigation. This issue will facilitate and simplify the application and utilization of solar PV in this region. The predicted potential area for these two provinces is 11,115 sq kilometers, and more than 4000 sq kilometers are classified as moderate and strong suitability in this region. Statistical information related to the amount and level of the potential area within each province is provided in , Figure presents the spatial distribution of the potential locations obtained by AHP, the potential locations aquired by GA presented in .
Figure 8. Potential map of the Solar energy obtained by the AHP method.
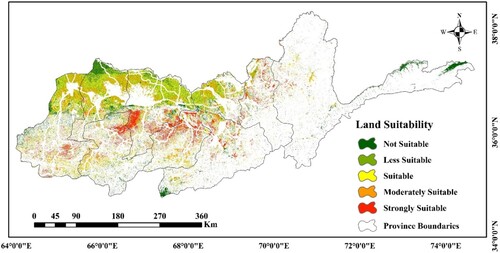
Figure 9. Indicates potential solar PV lands based on the class of potentiality and provinces.
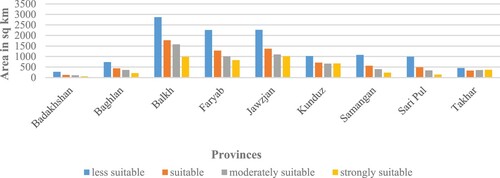
Figure 10. Potential map of the Solar energy obtained by the genetic optimization algorithm.
4. Discussion
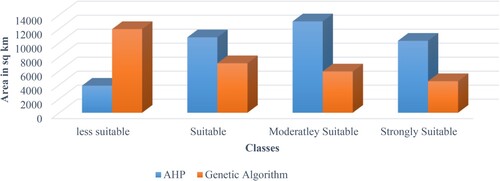
According to the outputs of this study, the GA provided more accurate results than AHP. The weights obtained from GA were used to identify potential areas for solar PV in the study region. It is essential to highlight that GAs outperform AHP due to their incorporation of a more comprehensive range of criteria for site evaluation. Upon comparing the findings of this study with prior research, it can be discerned that the outcomes are congruent with antecedent investigations. The findings of the present study bear a resemblance to those acquired by Malemnganbi and Shimray (Citation2022b), Uyan (Citation2013) and Stökler, Schillings, and Kraas (Citation2016), who evaluated different alternatives for a similar problem using a combination of GIS techniques, optimization algorithms, and multicriteria decision analysis. The analysis showed that morphological factors such as slope, elevation, and solar radiation significantly impacted the suitability of the sites. The study identified the most potential areas for solar PV in the northwest and western parts of the study area, which had lower topographic complexity. The study also found that mountainous provinces such as Badakhshan, Takhar, Baghlan, and Sari-pul had a lower solar PV potential than those with smoother topography. The impacts of the topographic factors on solar PV site suitability are evaluated by Noorollahi et al. (Citation2016), Van Hoesen and Letendre (Citation2010) and LEE (Citation2015), and their findings are similar to the results obtained for this research. The study’s findings are significant as they inform policymakers and investors about the most suitable areas for solar PV in Afghanistan. The study’s results can guide the development of large-scale solar PV projects in the country, thereby helping promote renewable energy and reduce dependence on fossil fuels. However, the study also identified some limitations that must be considered. For instance, the study did not consider the socio-economic factors that could affect the development of solar PV projects in the identified areas. Furthermore, the study should have considered the cost of building transmission lines to connect the identified sites to the national grid ().
Figure 11. Indicates a comparative presentation of the available area for each suitability class according to the outputs of GA and AHP.
5. Conclusion
The methodology utilized in this study involved the integration of genetic algorithms (GA) with the Analytic Hierarchy Process (AHP) to select solar power sites. Notably, the AHP results played a crucial role in this combined approach. Specifically, the outcomes obtained from the AHP were employed as inputs to effectively train the genetic algorithm throughout the optimization process. This integration enabled the utilization of valuable information derived from the AHP, ensuring its influence on the optimization capabilities of the genetic algorithm. This study employed a qualitative comparison between genetic algorithms (GA) and the Analytic Hierarchy Process (AHP) to select solar power sites. By evaluating each region individually, the accuracy of the GA solution was assessed without relying on specific metrics. According to the results obtained from this research, the AHP method determined that certain regions in Afghanistan are highly suitable for solar power plants, such as the western regions of Badakhshan province, the northern regions of Takhar province, and the northern regions of Baghlan and Samangan. Other regions were classified as having medium or low suitability potential. The AHP method identified Balkh province as having the highest potential area for solar energy, followed by Jawzjan and Faryab provinces, while Badakhshan had the lowest potential. The suitable location for solar energy across the selected study area was 29,421 sq km. The genetic optimization algorithm produced different results than the AHP method, with suitable areas for solar power plants in Faryab, Balkh, and Jawzjan provinces specified in their northern parts due to the smooth topography and available infrastructure. The genetic optimization algorithm results indicated that Sari-e-Pol and Samangan provinces have less potential for solar farms, with the inappropriate spatial distribution and higher feasibility in the latter. The GA and AHP showed similarities in the locations of suitable areas for solar energy in Takhar, Badakhshan, and Baghlan provinces, but with differences in intensity and aggregation of pixels. The GA identified the northern and western parts of Kunduz province as having high potential for constructing solar power plants.
In contrast, the AHP identified the northern parts as having low potential. Jawzjan had the highest suitability, and Badakhshan had the lowest based on the area available for highly suitable classes in each province. In total, 29,421 sq kilometers of the study area were determined as potential locations for solar PV with different degrees of suitability.
This study demonstrates that combining the Analytic Hierarchy Process (AHP) and evolutionary algorithms can improve the accuracy and efficiency of site suitability analysis for renewable energy projects. By integrating these methods, decision-makers can better identify suitable locations for solar power plants. This hybrid approach enables decision-makers to prioritize areas with the most significant potential for solar energy development. The study emphasizes the importance of a systematic methodology to identify optimal locations for renewable energy development.
This study offers important insights into the feasibility of developing renewable energy sources in Afghanistan and underscores the benefits of leveraging solar power to tackle the nation’s energy supply challenges. As there are notable variations in the suitability of various provinces for solar energy, decision-makers should focus on areas with tremendous potential and commit to constructing the required infrastructure to facilitate the establishment of solar farms in these regions.
Consent for publication
Not applicable.
Ethics approval
Not applicable.
Acknowledgments
We thank anonymous reviewers for their comments that improved this paper.
Disclosure statement
No potential conflict of interest was reported by the author(s).
Data availability
Data will be available upon request.
Additional information
Funding
References
- Al-Shahri, O. A., F. B. Ismail, M. A. Hannan, M. S. H. Lipu, A. Q. Al-Shetwi, R. A. Begum, N. F. O. Al-Muhsen, and E. Soujeri. 2021. “Solar Photovoltaic Energy Optimization Methods, Challenges and Issues: A Comprehensive Review.” Journal of Cleaner Production 284. Elsevier Ltd. https://doi.org/10.1016/j.jclepro.2020.125465.
- Al Garni, H. Z., and A. Awasthi. 2017. “Solar PV Power Plant Site Selection Using a GIS-AHP Based Approach with Application in Saudi Arabia.” Applied Energy 206 (September): 1225–1240. https://doi.org/10.1016/j.apenergy.2017.10.024.
- Anwarzai, M. A., and K. Nagasa. 2017. “Prospect Area Mapping for Geothermal Energy Exploration in Afghanistan.” Journal of Clean Energy Technologies 5 (6): 501–506. https://doi.org/10.18178/JOCET.
- Barbosa, J., L. P. Dias, S. G. Simoes, and J. Seixas. 2020. “When is the Sun Going to Shine for the Brazilian Energy Sector? A Story of how Modelling Affects Solar Electricity.” Renewable Energy 162: 1684–1702. https://doi.org/10.1016/j.renene.2020.09.091.
- Baser Qasimi, A., V. Isazade, G. Kaplan, and Z. Nadry. 2022. “Spatiotemporal and Multi-Sensor Analysis of Surface Temperature, NDVI, and Precipitation using Google Earth Engine Cloud Computing Platform.” Russian Journal of Earth Sciences 22: 1–12. https://doi.org/10.2205/2022ES000812.
- Belessiotis, V., and E. Delyannis. 2000. “The History of Renewable Energies for Water Desalination.” Desalination 128: 147–159.
- Buontempo, F. 2019. “Genetic Algorithms and Machine Learning for Programmers.” The Pragmatic Bookshelf 52 (Issue 1): 123–230.
- Catita, C., P. Redweik, J. Pereira, and M. C. Brito. 2014. “Extending Solar Potential Analysis in Buildings to Vertical Facades.” Computers & Geosciences 66: 1–12. https://doi.org/10.1016/j.cageo.2014.01.002.
- Datta, A., and I. Karakoti. 2010. “Solar Resource Assessment Using GIS & Remote Sensing Techniques.” ESRI India User Conference 2010 9560272741 (M): 1–20.
- Drücke, J., M. Borsche, P. James, F. Kaspar, U. Pfeifroth, B. Ahrens, and J. Trentmann. 2021. “Climatological Analysis of Solar and Wind Energy in Germany Using the Grosswetterlagen Classification.” Renewable Energy 164: 1254–1266. https://doi.org/10.1016/j.renene.2020.10.102.
- Dubayah, R., and P. M. Rich. 1995. “Topographic Solar Radiation Models for GIS.” International Journal of Geographical Information Systems 9 (4): 405–419. https://doi.org/10.1080/02693799508902046.
- Firozjaei, M. K., O. Nematollahi, N. Mijani, S. N. Shorabeh, H. K. Firozjaei, and A. Toomanian. 2019. “An Integrated GIS-based Ordered Weighted Averaging Analysis for Solar Energy Evaluation in Iran: Current Conditions and Future Planning.” Renewable Energy 136: 1130–1146. https://doi.org/10.1016/j.renene.2018.09.090.
- Gerbo, A., K. V. Suryabhagavan, and T. Kumar Raghuvanshi. 2020. “GIS-based Approach for Modeling Grid-Connected Solar Power Potential Sites: A Case Study of East Shewa Zone, Ethiopia.” Geology, Ecology, and Landscapes 159–173. https://doi.org/10.1080/24749508.2020.1809059.
- International Energy Agency. 2021. “Global Energy Review 2021.” Global Energy Review 2020: 1–36.
- Janke, J. R. 2010. “Multicriteria GIS Modeling of Wind and Solar Farms in Colorado.” Renewable Energy 35 (10): 2228–2234. https://doi.org/10.1016/j.renene.2010.03.014.
- Korkovelos, A., M. Bazilian, D. Mentis, and M. Howells. 2017. A GIS Approach to Planning Electrification in Afghanistan. Washington, DC: World Bank.
- Kumar, M., M. Husain, N. Upreti, and D. Gupta. 2020. “Genetic Algorithm: Review and Application.” SSRN Electronic Journal 2 (2): 451–454. https://doi.org/10.2139/ssrn.3529843.
- Kundakcı, N. 2019. An Integrated Multicriteria Decision Making Approach for Tablet Computer Selection.
- Larentis, D. G., W. Collischonn, F. Olivera, and C. E. M. Tucci. 2010. “Gis-Based Procedures for Hydropower Potential Spotting.” Energy 35 (10): 4237–4243. https://doi.org/10.1016/j.energy.2010.07.014.
- LEE, K.-R. 2015. “Solar Power Plant Location Analysis Using GIS and Analytic Hierarchy Process.” Journal of the Korean Association of Geographic Information Studies 18 (4): 1–13. https://doi.org/10.11108/kagis.2015.18.4.001.
- Liu, M., A. Bárdossy, J. Li, and Y. Jiang. 2012. “GIS-based Modelling of Topography-Induced Solar Radiation Variability in Complex Terrain for Data Sparse Region.” International Journal of Geographical Information Science 26 (7): 1281–1308. https://doi.org/10.1080/13658816.2011.641969.
- Malemnganbi, R., and B. A. Shimray. 2022a. “An Integrated Multiple Layer Perceptron-Genetic Algorithm Decision Support System for Photovoltaic Power Plant Site Selection.” International Journal of Electrical and Computer Engineering 12 (2): 1965–1972. https://doi.org/10.11591/ijece.v12i2.pp1965-1972.
- Malemnganbi, R., and B. A. Shimray. 2022b. “An Integrated Multiple Layer Perceptron-Genetic Algorithm Decision Support System for Photovoltaic Power Plant Site Selection.” International Journal of Electrical and Computer Engineering (IJECE) 12 (2): 1965. https://doi.org/10.11591/IJECE.V12I2.PP1965-1972.
- Mehdipour, F., M. S. Mesgari, B. Golchin, and M. R. Akbari. 2011. “Facility Sitting Using Gis and Genetic Algorithms.” 25th International Cartographic Conference 1: 1816–1823.
- Moonchai, S., and N. Chutsagulprom. 2020. “Short-term Forecasting of Renewable Energy Consumption: Augmentation of a Modified Grey Model with a Kalman Filter.” Applied Soft Computing 87: 105994. https://doi.org/10.1016/j.asoc.2019.105994.
- Mostafaeipour, A., S. J. H. Dehshiri, S. S. H. Dehshiri, and M. Jahangiri. 2020. “Prioritization of Potential Locations for Harnessing Wind Energy to Produce Hydrogen in Afghanistan.” International Journal of Hydrogen Energy 45 (58): 33169–33184. https://doi.org/10.1016/j.ijhydene.2020.09.135.
- Munkhbat, U., and Y. Choi. 2021. “Gis-based Site Suitability Analysis for Solar Power Systems in Mongolia.” Applied Sciences (Switzerland) 11 (9). https://doi.org/10.3390/app11093748.
- Nagkoulis, N., E. Loukogeorgaki, and M. Ghislanzoni. 2022. “Genetic Algorithms-Based Optimum PV Site Selection Minimizing Visual Disturbance.” Sustainability (Switzerland) 14 (19): 1–19. https://doi.org/10.3390/su141912602.
- Noorollahi, E., D. Fadai, M. A. Shirazi, and S. H. Ghodsipour. 2016. “Land Suitability Analysis for Solar Farms Exploitation Using GIS and Fuzzy Analytic Hierarchy Process (FAHP) - A Case Study of Iran.” Energies 9 (8): 1–24. https://doi.org/10.3390/en9080643.
- Patel, A. M., and S. K. Singal. 2019. “Optimal Component Selection of Integrated Renewable Energy System for Power Generation in Stand-Alone Applications.” Energy 175: 481–504. https://doi.org/10.1016/j.energy.2019.03.055.
- Patmal, M. H., and H. Shiran. 2021. “Public Awareness and their Attitudes toward Adopting Renewable Energy Technologies in Afghanistan.” International Journal of Innovative Research and Scientific Studies 4 (2): 82–91. https://doi.org/10.53894/ijirss.v4i2.61.
- Qasimi, A. B., V. Isazade, and A. Toomanian. 2022. “A Review of Sustainable and Renewable Sources of Energy for Afghanistan.” Journal of Renewable Energy 5 (02): 60–75.
- Rylatt, M., S. Gadsden, and K. Lomas. 2001. “GIS-Based Decision Support for Solar Energy Planning in Urban Environments.” Computers, Environment and Urban Systems 25 (6): 579–603. https://doi.org/10.1016/S0198-9715(00)00032-6.
- Sadat, S. M. W., and N. R. Sabory. 2020. “Afghanistan Renewable Energy Sector’s Human Resources Estimation Until 2032.” Repa Proceeding Series 1 (1): 96–101. https://doi.org/10.37357/1068/SODC2019.1.1.12.
- Shahabi, H., B. A. Ahmad, B. Bin Ahmad, M. J. Taheri Amiri, S. Keihanfard, and S. Ebrahimi. 2016. “Assessment of WLC and Fuzzy Logic Methodsfor Site Selection of Water Reservoirsin Malaysia.” Polish Journal of Environmental Studies 25 (3): 1223–1231. https://doi.org/10.15244/PJOES/61529.
- Shahabi, H., S. Keihanfard, B. Bin Ahmad, and M. J. T. Amiri. 2014. “Evaluating Boolean, AHP and WLC Methods for the Selection of Waste Landfill Sites Using GIS and Satellite Images.” Environmental Earth Sciences 71 (9): 4221–4233. https://doi.org/10.1007/S12665-013-2816-Y/METRICS.
- Shahabi, H., A. Shirzadi, S. Ronoud, S. Asadi, B. T. Pham, F. Mansouripour, M. Geertsema, J. J. Clague, and D. T. Bui. 2021. “Flash Flood Susceptibility Mapping Using a Novel Deep Learning Model Based on Deep Belief Network, Back Propagation and Genetic Algorithm.” Geoscience Frontiers 12 (3): 101100. https://doi.org/10.1016/J.GSF.2020.10.007.
- Silva-Gallegos, J. J., C. A. Aguirre-Salado, L. Miranda-Aragón, G. Sánchez-Díaz, J. R. Valdez-Lazalde, J. W. Pedroza-Carneiro, and J. A. Flores-Cano. 2017. “Locating Potential Zones for Cultivating Stevia Rebaudiana in Mexico: Weighted Linear Combination Approach.” Sugar Tech 19 (2): 206–218. https://doi.org/10.1007/s12355-016-0446-x.
- Soydan, O. 2021. “Solar Power Plants Site Selection for Sustainable Ecological Development in Nigde, Turkey.” SN Applied Sciences 3 (Issue 1): 41. https://doi.org/10.1007/s42452-020-04112-z.
- Stökler, S., C. Schillings, and B. Kraas. 2016. “Solar Resource Assessment Study for Pakistan.” Renewable and Sustainable Energy Reviews 58: 1184–1188. https://doi.org/10.1016/j.rser.2015.12.298.
- Subandi, E. L. W, and M. Ardiansyah. 2019. “Use of WLC (Weighted Linear Combination) to Determine Land Priorities for Development of Paddy Fields in Gorontalo Regency, Indonesia.” International Journal of Engineering and Management Research 9 (3): 58–63. https://doi.org/10.31033/ijemr.9.3.8.
- Szurek, M., J. Blachowski, and A. Nowacka. 2014. “GIS-Based Method for Wind Farm Location Multicriteria Analysis.” Mining Science 21: 65–81. https://doi.org/10.5277/ms142106.
- Tovar-Pescador, J., D. Pozo-Vázquez, J. A. Ruiz-Arias, J. Batlles, G. López, and J. L. Bosch. 2006. “On the use of the Digital Elevation Model to Estimate the Solar Radiation in Areas of Complex Topography.” Meteorological Applications 13 (03): 279–287. https://doi.org/10.1017/S1350482706002258.
- Türk, S., A. Koç, and G. Şahin. 2021. “Multicriteria of PV Solar Site Selection Problem Using GIS-Intuitionistic Fuzzy Based Approach in Erzurum Province/Turkey.” Scientific Reports 11 (Issue 1): 5034. https://doi.org/10.1038/s41598-021-84257-y.
- Uyan, M. 2013. “GIS-based Solar Farms Site Selection Using Analytic Hierarchy Process (AHP) in Karapinar Region Konya/Turkey.” Renewable and Sustainable Energy Reviews 28: 11–17. https://doi.org/10.1016/j.rser.2013.07.042.
- Van Dijk, S., D. Thierens, and M. De Berg. 2002. “Using Genetic Algorithms for Solving Hard Problems in GIS.” GeoInformatica 6 (4): 381–413. https://doi.org/10.1023/A:1020809627892.
- Van Hoesen, J., and S. Letendre. 2010. “Evaluating Potential Renewable Energy Resources in Poultney, Vermont: A GIS-Based Approach to Supporting Rural Community Energy Planning.” Renewable Energy 35 (9): 2114–2122. https://doi.org/10.1016/j.renene.2010.01.018.
- Voivontas, D., G. Tsiligiridis, and D. Assimacopoulos. 1998. “Solar Potential for Water Heating Explored by GIS.” Solar Energy 62 (6): 419–427. https://doi.org/10.1016/S0038-092X(98)00027-9.
- Wu, Q., and J. J. Shan. 2000. “The Application of Genetic Algorithm in GIS Network Analysis.” International Archives of Photogrammetry and Remote Sensing Vol. XXXIII, Part B4. Amsterdam 2000., XXXIII: 1184–1191.
- Yahyaoui, I. 2018. “Advances in Renewable Energies and Power Technologies.” Advances in Renewable Energies and Power Technologies Vol. 2: 1–519. https://doi.org/10.1016/c2016-0-04919-7.
- Yin, S., J. Li, J. Liang, K. Jia, Z. Yang, and Y. Wang. 2020a. “Optimization of the Weighted Linear Combination Method for Agricultural Land Suitability Evaluation Considering Current Land use and Regional Differences.” Sustainability (Switzerland) 12 (23): 1–26. https://doi.org/10.3390/su122310134.
- Yin, C. L., F. Meng, and Q. R. Yu. 2020b. “Calculation of Land Surface Emissivity and Retrieval of Land Surface Temperature Based on a Spectral Mixing Model.” Infrared Physics & Technology 108: 103333. https://doi.org/10.1016/J.INFRARED.2020.103333.
- Zeng, S., Y. Liu, C. Liu, and X. Nan. 2017. “A Review of Renewable Energy Investment in the BRICS Countries: History, Models, Problems and Solutions.” Renewable and Sustainable Energy Reviews 74: 860–872. https://doi.org/10.1016/j.rser.2017.03.016.
- Zereshkian, S., and D. Mansoury. 2021. “A Study on the Feasibility of using Solar Radiation Energy and Ocean Thermal Energy Conversion to Supply Electricity for Offshore Oil and Gas Fields in the Caspian Sea.” Renewable Energy 163: 66–77. https://doi.org/10.1016/j.renene.2020.08.111.
- Zhang, S., and X. Li. 2021. “Future Projections of Offshore Wind Energy Resources in China using CMIP6 Simulations and a Deep Learning-based Downscaling Method.” Energy 217: 119321. https://doi.org/10.1016/j.energy.2020.119321.
- Zhang, X., T. Tan, B. Zhou, T. Yu, B. Yang, and X. Huang. 2021. “Adaptive Distributed Auction-Based Algorithm for Optimal Mileage Based AGC Dispatch with High Participation of Renewable Energy.” International Journal of Electrical Power and Energy Systems 124: 106371. https://doi.org/10.1016/j.ijepes.2020.106371.
- Zhou, G., Z. Zhu, and S. Luo. 2022. “Location Optimization of Electric Vehicle Charging Stations: Based on Cost Model and Genetic Algorithm.” Energy 247: 123437. https://doi.org/10.1016/j.energy.2022.123437.
