
 ?Mathematical formulae have been encoded as MathML and are displayed in this HTML version using MathJax in order to improve their display. Uncheck the box to turn MathJax off. This feature requires Javascript. Click on a formula to zoom.
ABSTRACT
The scope of this study is the investigation of the thermal performance of building-integrated solar flat collectors with a uniform and multiple riser structure. The effect of dynamic operating parameters such as the environmental temperature, solar radiation, the inclination angle and further model modifications to the fluid inlet, outlet and riser are studied. Numerical calculations were carried out using Finite Element (FE) analysis. Three-dimensional transient models were developed to calculate the thermal performance of the investigated objects. The study revealed increased efficiency for the multiple-riser configuration. Under all boundary conditions, the highest fluid temperatures occur in the south orientation during autumn and winter and in the west during spring and summer. The thermal assessment comparison between the roof installed and vertical solar collectors were performed, and the differences throughout the slope angles were distinguished. The results showed that a building-integrated solar system acted as a shield barrier, and provided heat to the building structure.
Nomenclature
| e | = | Specific internal energy [J/kg] |
| H | = | Total energy of flowing fluid [J/kg] |
| h | = | Thermal enthalpy [J] |
| | = | Pressure [Pa] |
| QH | = | Specific heat release or absorption per unit volume [J/(kg·K)] |
| | = | Heat flux [w/m2] |
| R | = | Gas constant [8.3145 J/mol·K] |
| | = | Temperature [°C] |
| | = | Mass-distributed external force per unit mass [N/kg] |
| | = | Ith component of the carrier fluids velocity [-] |
| | = | Jth component of the carrier fluids velocity [-] |
| u | = | Fluid velocity [m/s] |
| | = | Ith component of the used coordinate system [-] |
| | = | Jth component of the carrier fluids velocity [-] |
| Greek Symbols | ||
| ϵ | = | Turbulent dissipation [J/(kg·s)] |
| | = | Eigenvalues of the thermal conductivity tensor |
| | = | Fluid density [ |
| | = | Viscous stress tensor [Pa] |
| | = | Reynolds stress tensor [Pa] |
1. Introduction
The use of solar thermal collectors dates back to the ‘60s. In states of southern Europe and the Middle East like Cyprus, Greece, Italy, Spain and Israel, solar thermal collectors’ use to produce domestic hot water is part of everyday life (Kalogirou Citation2009). The percentage of installed solar thermal collectors per inhabitant in some cases exceeds one m²/capita, such as in the case of Cyprus (Kalogirou Citation2005). The use of solar thermal collectors has proven to be economically viable, which is why today this technology is flourishing in other parts of central and northern Europe, such as Austria and Germany (Eicker et al. Citation2014). The use of these systems extends to other applications, such as industrial heat production, space heating, etc. (Kylili et al. Citation2018).
Although these systems are highly efficient, it is a fact that their design rationale was not developed significantly in recent decades. There are evident changes in the use of materials, emphasising properties that enhance durability and improve heat transfer (Jiandong, Hanzhong, and Susu Citation2015), however in terms of the geometry and connectivity of the solar collectors, research has not evolved. The use of finite elements and computational fluid dynamic (CFD) modelling could intensify the improvement of solar thermal collectors’ design, emphasising improving their thermal performance and allowing their integration into the building shell. This is a significant challenge for solar thermal collectors. Unlike Building Integrated Photovoltaics (BIPV), solar thermal systems have inherent difficulties in being integrated into the building shell (Lamnatou et al. Citation2017); hence to date, their integration applications are minimal.
Solar thermal collectors have gained significant attention and have been widely utilised in southern European and Mediterranean countries, leveraging the abundant solar resources and aiming to meet the increasing demand for renewable energy sources.
Several studies have demonstrated the successful implementation of solar thermal collector systems in the region, primarily for domestic hot water production, space heating, and industrial process heat (Papamanolis Citation2016). The Mediterranean climate, characterised by long periods of sunshine and high solar radiation, provides favourable conditions for the efficient operation of solar thermal collectors, resulting in substantial energy savings and reduced carbon emissions (Arabzadeh, Jokisalo, and Kosonen Citation2019). Researchers have explored various types of solar thermal collectors, including flat-plate collectors, evacuated tube collectors, and concentrating collectors, to optimise performance and maximise energy yield in these geographic areas (Papadopoulos et al. Citation2017). Policy frameworks and incentives, such as feed-in tariffs, tax incentives, and renewable energy targets, have played a crucial role in promoting the widespread adoption of solar thermal collectors in southern European and Mediterranean countries, further accelerating the transition towards clean and sustainable energy systems (Kashani, Izadkhast, and Asnaghi Citation2014; Mazloum and Ghanem Citation2022)
This study attempts to shed light on the object of the optimised design of solar thermal systems installed in the building shell, using finite elements and Computational Fluid Dynamic (CFD) modelling. In this work, three different solar thermal systems were numerically tested concerning their energy performance. The study was carried out on the rationale of integrating the collectors into the building in a vertical layout. The work's assumptions allowed the simulation of the building's real conditions, considering the simultaneous consumption of hot water and the possibility of integration into different orientations of the shell for different seasons of the year. The work resumes calculating temperature and energy profiles produced by various systems, resulting in the optimal conditions and data for the design of building-integrated solar thermal systems.
2. Overview of studies in the numerical analysis of solar thermal collectors
The scientific studies conducted in the numerical assessment of solar thermal plate collectors address different solar collectors under diverse boundary conditions. In recent years, the leading practice in this field is the application of computational fluid dynamics (CFD) models to define the thermal performance of the investigated models. A variety of multi-dimensional models have been developed using various tools and CFD models such as Ansys-Fluent, OpenFoam, COMSOL, Solidworks, Star-CCM, Matlab etc.
The CFD models’ physics is mainly based on transport continuity equations, namely the mass, momentum and energy conservation equations. (Ababsa and Bougoul Citation2017; Andrade Cando, Quitiaquez Sarzosa, and Toapanta Citation2020; Fertahi et al. Citation2018; Fowzi Citation2017; Garnier, Muneer, and Currie Citation2018; Gunjo, Mahanta, and Robi Citation2017; Jiandong, Hanzhong, and Susu Citation2015; Long et al. Citation2020; Mintsa Do Ango, Medale, and Abid Citation2013; Nayak et al. Citation2018; Quitiaquez et al. Citation2020; Vetter, Fischer, and Dr√(ck Citation2018; Wang et al. Citation2015). In some studies, the convective and radiative heat transfer and the working fluid's useful gain heat are also employed. (Leone and Beccali Citation2016; Rangababu, Kiran Kumar, and Srinivasa Rao Citation2015).
The geometry of the models is that of a flat plate solar thermal collector with an absorber plate. Some studies assume the use of an absorber made of copper. (Fertahi et al. Citation2018; Gunjo, Mahanta, and Robi Citation2017; Long et al. Citation2020). Concerning the size of the geometry, various solar collector sizes are observed regarding length and width. These range from 0.98–2.5 [m] and 0.13–0.98 [m], respectively. The absorber plate thickness ranges from 0.1–2.1 [mm] with two types of absorber configurations, with a squared and rounded circumference. (Jiandong, Hanzhong, and Susu Citation2015).
Concerning the boundary conditions of the CFD simulations, a range of values and approaches is observed.
Concerning weather conditions, CFD simulations are performed utilising environmental data such as ambient temperature and solar radiation. In some studies, weather data from specific locations are retrieved and employed (Wurzburg, Guangzhou, Fez, Edinburgh, Merida, Sultanate of Oman, Limassol, etc.). Concerning the solar radiation values used as boundary conditions in CFD studies, these range between 120 and 1200 [W/m²]. In most occasions, steady-state conditions are considered for solar thermal radiation, while transient solar heat flux, varying on an hourly time step, is considered. Although steady-state simulations are much easier to conduct compared to transient studies, the result of the latter presents a better agreement with measured values. The ambient temperature varies from constant to dynamic, ranging from 15 to 37 [°C]. The wind speed is also considered in studies with continuous values ranging from 2 to 14 [m/s].
The mass flow rate of the thermal medium considered to be in studies is constant and variable. The mass flow rate values range from 0.0125–0.26 [kg/s]. The fluid inlet temperature is not constant, whereas the fluid temperature has constant values ranging from 20 to 45 [°C]. The initial temperature of the thermal medium is also considered.
The investigated studies result in the extraction of the following information:
the effect of the system geometry (e.g. absorber thickness, the air gap between glass and absorber), the mass flow rate and the materials (e.g. of absorber or pipes) on the system efficiency (Mintsa Do Ango, Medale, and Abid Citation2013; Wang et al. Citation2015).
the useful energy gain and the entropy generation (Fowzi Citation2017; Rangababu, Kiran Kumar, and Srinivasa Rao Citation2015).
the velocity, pressure drop and Reynolds number (Ababsa and Bougoul Citation2017; Andrade Cando, Quitiaquez Sarzosa, and Toapanta Citation2020).
and summarise the boundary conditions, the physics and the geometry of the conducted numerical studies in the field of solar thermal collectors assessment.
Table 1. Boundary conditions that are considered for the numerical simulation.
Table 2. Numerical Simulation model characteristics.
3. Materials and methods
3.1. Boundary conditions
In this study, a numerical model for the simulation of building-integrated solar thermal collectors’ thermal performance was developed. The model was based on the finite element method, and the flow simulation engine of SolidWorks was employed (Dassault Systèmes SOLIDWORKS Corp., Citationn.d.). The analysis was performed for four calendar months (January, March, August and November) for Nicosia, Cyprus, delivering results for all seasons of the year in the four orientations (North, South, West and East) (EU SCIENCE HUB, Citationn.d.). The fluid circulation rate was set based on ISO 12975, and all systems were simulated with forced convection considering a 50-watt typical pump with 8 h of operation per day, with approximately electricity consumption of 1,6 kWh. In this numerical model, the water consumption profile was considered (Department for Environment Food & Rural Affairs Citation2008) as shown in . The specific fluid rate at a given time was subtracted from the system, thus accounting for heat removed from the system, therefore water consumption. In , the boundary conditions of the simulated models are provided.
Figure 1. Water Consumption [L/h] Versus Time [h].
![Figure 1. Water Consumption [L/h] Versus Time [h].](/cms/asset/3992f231-3abb-4b46-abce-fdbd308264ac/gsol_a_2250868_f0001_oc.jpg)
Table 3. Boundary Conditions.
3.2. Geometry and mesh
Two geometries of solar thermal collectors were investigated, a uniform riser in the size of commercial solar thermal collectors and a group of interconnected risers with an area of 0.4 × 0.4 m² each. Additionally, for the latter geometry, the risers’ connectivity was modified, delivering a third alternative geometry. As shown in , the investigated geometry's main elements were the absorber, the risers, the casing, the thermal insulation, the protective glass, the air between the glass and the absorber, and the tank reservoir. An overview of the investigated geometries and information and drawings of the investigated domain mesh are provided in .
Table 4. Investigated Configurations – Domains.
The curvature level regarding the domain mesh was set to be at 0.5548, and the tolerance criterion value was 0.0005 m. The mesh preset was set at level two, which corresponds to the cell density in regions. Based on a preliminary study with different presets, this refinement level was decided, according to which this mesh domain delivered reliable results in a shorter time .
Table 5. Investigated Configurations – Domains (cont’d).
The solar collector models were incorporated vertically into a building masonry structure. A thermal assessment was performed, and the heat transferred through the masonry structure was investigated. Information regarding the building-integrated solar collector system materials is provided in , and an overview of the model is shown in . Also, the velocity profile of each system is illustrated in .
Figure 2. Building-integrated Solar Collector Structure.
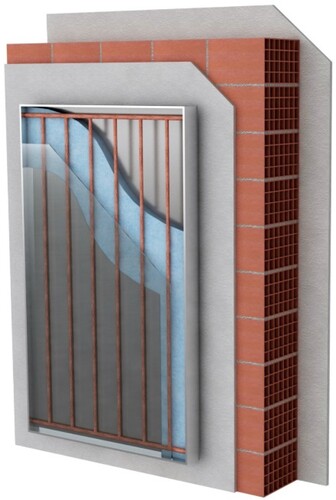
Figure 3. Riser Fluid Velocity – Uniform Riser.
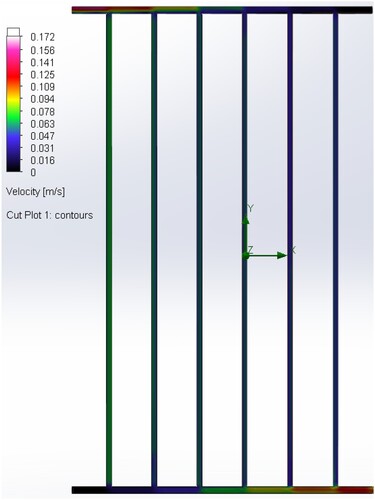
Figure 4. Riser Fluid Velocity – Multiple Riser Configuration One.
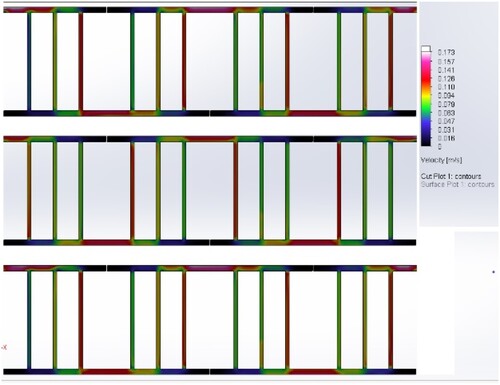
Figure 5. Riser Fluid Velocity – Multiple Riser Configuration Two.
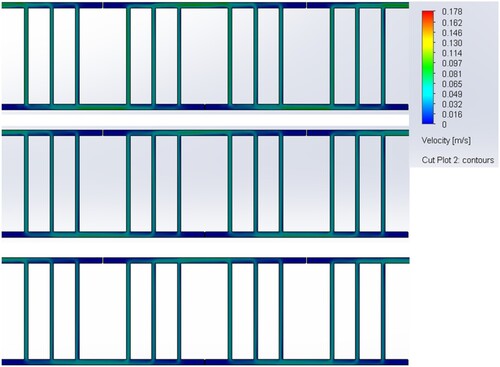
Table 6. Building-Integrated Solar Collector Materials.
3.3. Governing equations
The physics employed for the numerical analysis was based on transient heat transfer principles and fluid dynamics. The absorber was particularly subjected to non-steady solar radiation, and heat transfer due to conduction was assumed between the absorber and the riser. Thermal losses due to the convection of the fluid in the riser were also considered. The governing equations employed were the mass, momentum and energy conservation laws, based on the Navier-Strokes approach, for closed-loop forced circulation, expressed as follows:
(1)
(1)
(2)
(2)
(3)
(3)
(4)
(4)
Concerning the solid regions of the model, heat conduction was assumed:
(5)
(5)
3.4. Numerical model validation
The numerical model employed in this study was validated with the use of experimental data published by (Souliotis Citation2021). The geometry and boundary conditions described in (Souliotis Citation2021) were developed, as well as the physics of the numerical model implemented in this study was applied. The boundary conditions of the validation model were the specified riser input fluid temperature, the ambient temperature and the solar radiation. For the validation of the numerical (N) and experimental values (E), the root mean square deviation formula was incorporated.
(6)
(6)
4. Results
In this section, a brief overview of all investigated systems is presented. The roof-installed systems are exposed to significantly higher solar radiation due to their position. The fluid temperature difference gap between uniform and multiple riser configurations is narrowed presented slope 0° simulation results. The maximum average fluid temperature difference is marked under autumn conditions between the uniform riser and multi-riser configuration. Identical thermal behaviour between multi-riser setups is obtained, further designating that the fluid temperature gap is much lower than the slope of 90°. Even though slope 0° displayed inferior thermal performance compared to slope 45°, it achieved the maximum fluid temperature of 54 [°C], which was considered the highest of all. According to the slope 45° simulation results in , the optimal orientation for maximum thermal performance is south. Concerning all seasons presents the results obtained for slope 90°, and the south orientation provided the best performance under autumn, winter, and spring conditions and the east orientation for the summer season. Regarding the BIST results presented in , the maximum heat flux occurred in winter conditions and the lowest in spring with a value of 141.55 [W/m2] and −56.03 [W/m2] respectively. The full set of data for this numerical study considering all the hourly average fluid temperature, hourly heat flux, hourly solar radiation and ambient temperature for all investigated dynamic conditions is provided. (Georgiou et al. Citation2021).
Table 7. Minimum, average and maximum – System fluid temperatures [°C] at Slope 0°.
Table 8. Minimum, average and maximum – System fluid temperatures [°C] at Slope 45°.
Table 9. Minimum, average and maximum – System fluid temperatures [°C] at Slope 90°.
4.1. Numerical model validation
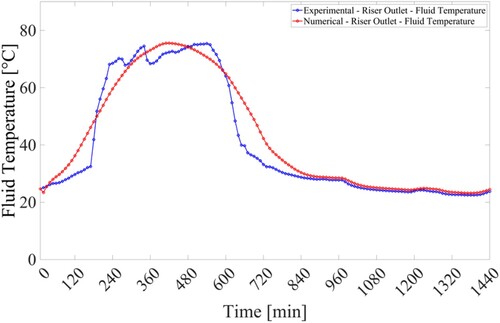
The numerical and experimental temperature profile comparison is presented in which indicated a good agreement between the two. The calculated value from the root mean square deviation formula (RMSD) for the experimental and numerical cases is 5.01% which is considered acceptable (Pawar and Sobhansarbandi Citation2020).
Figure 6. Experimental Vs Numerical – Riser Outlet – Fluid Temperature.
4.2. Assessment of system performance by considering water consumption
The simulated results of the fluid temperature profiles are presented in and under two scenarios, including and excluding water consumption. The first case involving water consumption resulted in lower fluid temperatures since the hot water was being removed from the tank reservoir; thus, the temperature decreased. A higher fluid temperature is achieved when water consumption is not considered. The consumption of hot water represents realistic conditions; to this end, this parameter's inclusion resulted in more reliable results.
Figure 7. System Average Fluid Temperature – Multiple Riser Configuration One – Water Consumption Comparison – August – South – Slope 90° – Last 24 h.
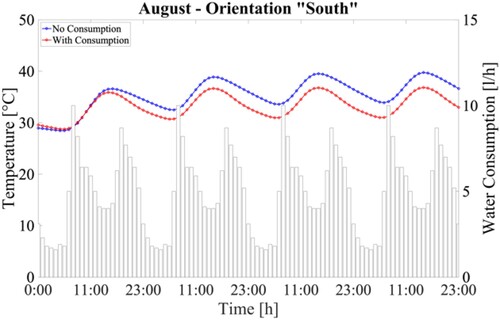
Figure 8. System Average Fluid Temperature – Multiple Riser Configuration One – Water Consumption Comparison – November – South – Slope 90° – Last 24 h.
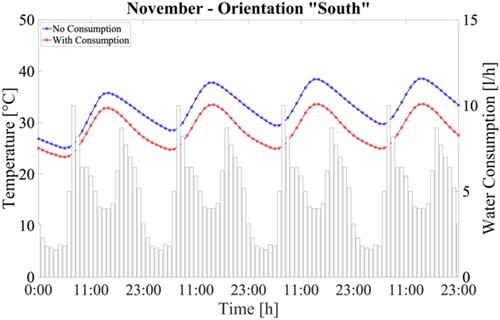
In winter conditions, the temperature difference between the two scenarios was higher due to the lower environmental temperatures and the reduced heat transfer due to solar radiation. In contrast, the temperature difference in summer conditions is lower since the solar collector is exposed to prolonged solar radiation times, and the ambient temperature is considerably higher.
4.3. Assessment of uniform and multiple risers
The thermal analysis of the fluid temperature regarded the three solar collector model configurations are shown in . The uniform riser system delivered the lowest fluid temperature; in contradiction, the multiple riser model configurations proved to be more efficient with multi-riser configuration one to have achieved the highest fluid temperature even higher when compared to multi-riser configuration two. The improvement of thermal performance in a multiple riser model was attainable because of the larger area of the riser, which resulted in higher efficiency of solar radiation absorption. It should be stated that the overall dimensions of both systems’ absorbers are the same. Thus, although it does not require more space, the multiple risers’ solution results in a more effective system. The fluid flow pattern is a critical factor for collector systems, affecting thermal performance and should be considered.
Figure 9. Average System Temperature [°C] – All Months, Slope 0°,45° and 90°.
![Figure 9. Average System Temperature [°C] – All Months, Slope 0°,45° and 90°.](/cms/asset/6e16e678-f57f-43d6-a35a-9a8902ad106c/gsol_a_2250868_f0009_oc.jpg)
4.4. The impact of the orientation on thermal performance
The thermal performance simulation results presented in and considered the orientation under diverse weather conditions. The best thermal performance regarded winter and summer conditions in the south and west orientation, respectively. The lowest fluid temperature is observed to occur in the north orientation in all cases; consequently, it can be extracted that the north orientation for the proposed system should be avoided. The west and east orientation thermal performances were identical. A slight time shift is observed in winter conditions. Still, a considerably bigger occurred in summer, which indicated that a solar collector with a tracking system could increase the overall efficiency. These results come as no surprise and occur due to the solar angle, which delivers better outcomes for these two orientations than the south orientation. However, in the south, the solar exposure time is higher.
Figure 10. Average System Temperature [°C] Vs Orientation – All Months, Slope 45°.
![Figure 10. Average System Temperature [°C] Vs Orientation – All Months, Slope 45°.](/cms/asset/f2d50c37-5942-441b-acf8-96a44fb97566/gsol_a_2250868_f0010_oc.jpg)
Figure 11. Average System Temperature [°C] Vs Orientation – All Months, Slope 90°.
![Figure 11. Average System Temperature [°C] Vs Orientation – All Months, Slope 90°.](/cms/asset/c6956268-79f0-43bf-88e9-250a522003b5/gsol_a_2250868_f0011_oc.jpg)
4.5. Assessment of roof installed system
In the study, solar thermal collectors’ performance on the buildings’ roofs for slope angles of 0° and 45° was investigated. The thermal performance simulation results for January and July are presented in . In summer conditions, the slope's fluid temperature is 0°, and 45° is considerably higher than 90° due to the significant increase in solar radiation. Contrary to the summer situation's performance difference, the results under winter conditions showed that vertical collectors have identical thermal performance with roof-installed solar collectors. Despite that, the roof-installed systems with slopes 0° and 45° outperform the integrated solar collectors, but there is great potential since the difference in fluid temperatures is not much apart.
4.6. The impact of the building-integrated solar collector on the building performance
The results considering the implications of BIST on the building wall thermal performance are presented in . It is possible to conclude that the BIST acts as a heat source on the building wall justified by the outwards heat flux. When comparing the case of no solar collector integration, the outwards heat flux values are presented, meaning that heat escapes the building. Due to the water's heat capacity and insulation, the BIST system acts as a thermal mass, releasing heat even when there is no solar radiation present. Depending on the environmental conditions, BIST's heat is considered an advantage because it contributes to the overall indoor temperature regulation. It minimises heat released into the environment by acting as a shield barrier and supplying heat. However, as shown in , there is also heat flux inwards the building in the summer season. Consequently, BIST system implementation has both advantages and disadvantages for the building. Positively, it adds to the building's existing heat supply, hence improving thermal comfort in general. Improved energy efficiency is a result of the BIST system's ability to keep heat from escaping the structure. The enhanced heat retention of the BIST system, on the other hand, negatively impacts the building's cooling loads. It hinders the heat's natural dissipation, making it harder to maintain cooler indoor temperatures in the summer. The building's cooling loads are adversely impacted as a result. Given a comparison of the heat flux values between the two situations, it is clear that the BIST system regularly produces heat flux values that are substantially greater.
Figure 12. Total daily Heat flux [W/m2] Inwards and Outwards of the building wall – Building Integrated Solar Collector Vs No Solar Collector.
![Figure 12. Total daily Heat flux [W/m2] Inwards and Outwards of the building wall – Building Integrated Solar Collector Vs No Solar Collector.](/cms/asset/440dc3ce-61bc-440d-996d-b710e93eca15/gsol_a_2250868_f0012_oc.jpg)
5. Discussion
This study examined a plate solar collector system's thermal performance integrated into a building shell under diverse weather conditions. Three transient models were developed based on (FEM) in the CFD tool (Dassault Systèmes SOLIDWORKS Corp., Citationn.d.), one model with a uniform riser, and two models with multiple risers assembled. The dynamic operating parameters considered during the simulation were the solar collector's inclination angle, environmental temperature and solar radiation intensity.
Numerical simulation results illustrated each model's fluid temperatures during north, south, west and east orientations. The multiple riser models demonstrated superior thermal performance over the uniform riser configuration, which proved to be a beneficial resolution for improving overall efficiency. The inlet and outlet modifications on the multiple riser model showed a non-significant decrease in fluid temperature, therefore displaying an inferior thermal performance. A critical component of the solar collector system is a riser, which was investigated and revealed to impact the efficiency directly. The water consumption factor was considered in all the simulations, and a preliminary numerical simulation presented the impact of water consumption on the accuracy of the results .
Figure 13. Temperature distribution [K] Outer surface of the collector end in the area in contact with the building envelope – System 2A – August – South Orientation.
![Figure 13. Temperature distribution [K] Outer surface of the collector end in the area in contact with the building envelope – System 2A – August – South Orientation.](/cms/asset/6fb9d8a7-ee84-4baa-9b09-778655d4e6a6/gsol_a_2250868_f0013_oc.jpg)
Figure 14. Temperature distribution [K] Outer surface of the collector end in the area in contact with the building envelope – System 2A – March – South Orientation.
![Figure 14. Temperature distribution [K] Outer surface of the collector end in the area in contact with the building envelope – System 2A – March – South Orientation.](/cms/asset/c9d0e49c-e672-4363-a086-e6bd4b4f6afe/gsol_a_2250868_f0014_oc.jpg)
Figure 15. Temperature distribution [K] Outer surface of the collector end in the area in contact with the building envelope – System 2A – November – South Orientation.
![Figure 15. Temperature distribution [K] Outer surface of the collector end in the area in contact with the building envelope – System 2A – November – South Orientation.](/cms/asset/4dbaede2-2365-4045-a011-024e928c8254/gsol_a_2250868_f0015_oc.jpg)
Figure 16. Temperature distribution [K] Outer surface of the collector end in the area in contact with the building envelope – System 2A – January – South Orientation.
![Figure 16. Temperature distribution [K] Outer surface of the collector end in the area in contact with the building envelope – System 2A – January – South Orientation.](/cms/asset/a5c73fd6-bb0a-46dd-ad59-0ded91654e14/gsol_a_2250868_f0016_oc.jpg)
A crucial outcome of building-integrated solar collectors’ feasibility and performance is delivered using numerical simulations of various slopes. The building-integrated solar collectors act as a thermal mass and potentially can contribute to the heating and cooling of a building during different seasons.
The novelty of this paper lies in the investigation of building-integrated solar flat collectors with both uniform and multiple riser structures, and their thermal performance under various operating parameters and weather conditions. The study utilises numerical simulations and finite element analysis to evaluate the efficiency and fluid temperatures of different collector configurations. The findings demonstrate the superiority of multiple riser models in terms of thermal performance and highlight the potential of building-integrated solar collectors to contribute to the heating and cooling of buildings throughout different seasons.
Further investigation can be conducted to optimise the design and arrangement of multiple risers in building-integrated solar collectors. This could involve exploring different geometries, sizes, and orientations of the risers to maximise thermal performance and overall efficiency. Also future research can focus on the integration of building-integrated solar collectors with heating, ventilation, and air conditioning (HVAC) systems. This would involve studying the feasibility and effectiveness of utilising the thermal mass of the collectors for heating and cooling purposes, and developing control strategies to optimise energy management within the building.
Data availability statement
The data that support the findings of this study are openly available in Mendeley Data and Zenodo at http://doi.org/10.17632/xcpyjj2gv7.2 and http://doi.org/10.5281/zenodo.5284639 respectively.
Disclosure statement
No potential conflict of interest was reported by the author(s).
References
- Ababsa, D., and S. Bougoul. 2017. “Numerical Analysis of Thermal and Dynamic Behavior of a Roof Solar Collector.” Heat Transfer-Asian Research 46. https://doi.org/10.1002/htj.21224.
- Agathokleous, R., G. Barone, A. Buonomano, C. Forzano, S. A. Kalogirou, and A. Pal-ombo. 2019. “Building Façade Integrated Solar Thermal Collectors for air Heating: Exper-Imentation, Modelling and Applications.” Applied Energy 239: 658–679. https://doi.org/10.1016/j.apenergy.2019.01.020.
- Andrade Cando, A. X., W. Quitiaquez Sarzosa, and L. F. Toapanta. 2020. “CFD Analysis of a Solar Flat Plate Collector with Different Cross Sections.” Enfoque UTE 11. doi:10.29019/enfoque.v11n2.601.
- Arabzadeh, V., J. Jokisalo, and R. Kosonen. 2019. “A Cost-optimal Solar Thermal System for Apartment Buildings with District Heating in a Cold Climate.” International Journal of Sustainable Energy 38 (2): 141–162.
- Dassault Systèmes SOLIDWORKS Corp. n.d. SOLIDWORKS® CAD software [WWW Document]. Accessed 10 December 2022. https://www.solidworks.com.
- Department for Environment Food & Rural Affairs. 2008. Measurement of Domestic Hot Water Consumption in Dwellings.
- Eicker, U., D. Pietruschka, M. Haag, and A. Schmitt. 2014. “Energy and Economic Performance of Solar Cooling Systems World Wide.” Energy Procedia 57. https://doi.org/10.1016/j.egypro.2014.10.269.
- EU SCIENCE HUB. n.d. Photovoltaic Geographical Information System (PVGIS) [WWW Document]. URL https://ec.europa.eu/jrc/en/pvgis (accessed 10.12.22).
- Fertahi, S. ed-D., T. Bouhal, T. Kousksou, A. Jamil, and A. Benbassou. 2018. “Experimental Study and CFD Thermal Assessment of Horizontal hot Water Storage Tank Integrating Evacuated Tube Collectors with Heat Pipes.” Solar Energy 170. https://doi.org/10.1016/j.solener.2018.05.062.
- Fowzi, M. 2017. CFD Simulation of Enhancement Techniques in Flat Plate Solar Water Collectors.
- Garnier, C., T. Muneer, and J. Currie. 2018. “Numerical and Empirical Evaluation of a Novel Building Integrated Collector Storage Solar Water Heater.” Renewable Energy 126. https://doi.org/10.1016/j.renene.2018.03.041.
- Georgiou, L., M. Souliotis, S. Papaefthimiou, and P. A. Fokaides. 2021. “Numerical Simulation Data of Building Integrated Solar Thermal Collectors Under Diverse Conditions.” Data in Brief 39. https://doi.org/10.1016/j.dib.2021.107470.
- Gunjo, D. G., P. Mahanta, and P. S. Robi. 2017. “CFD and Experimental Investigation of Flat Plate Solar Water Heating System Under Steady State Condition.” Renewable Energy 106. https://doi.org/10.1016/j.renene.2016.12.041.
- Jiandong, Z., T. Hanzhong, and C. Susu. 2015. “Numerical Simulation for Structural Parameters of Flat-Plate Solar Collector.” Solar Energy 117. https://doi.org/10.1016/j.solener.2015.04.027.
- Kalogirou, S. A. 2005. Solar Water Heaters in Cyprus: Manufacturing, Performance and Applications.
- Kalogirou, S. A. 2009. Solar Energy Engineering. Elsevier. https://doi.org/10.1016/B978-0-12-374501-9.X0001-5.
- Kashani, A. H., P. S. Izadkhast, and A. Asnaghi. 2014. “Mapping of Solar Energy Potential and Solar System Capacity in Iran.” International Journal of Sustainable Energy 33 (4): 883–903.
- Kylili, A., P. A. Fokaides, A. Ioannides, and S. Kalogirou. 2018. “Environmental Assessment of Solar Thermal Systems for the Industrial Sector.” Journal of Cleaner Production 176. https://doi.org/10.1016/j.jclepro.2017.12.150.
- Lamnatou, C., I. Farkas, Z. Aggelos, A. Buonomano, A. Palombo, and D. Chemisana. 2017. Modelling and performance analysis of building integrated solar thermal (BIST) system. pp. 103-132.
- Leone, G., and M. Beccali. 2016. “Use of Finite Element Models for Estimating Thermal Performance of Façade-Integrated Solar Thermal Collectors.” Applied Energy 171. https://doi.org/10.1016/j.apenergy.2016.03.039.
- Long, J., J. Lu, M. Jiang, A. Du, R. Zhang, and A. Yongga. 2020. “Study on Solar Energy Utilization Characteristics of a Solar Building Integrated Wall.” Applied Thermal Engineering 175. https://doi.org/10.1016/j.applthermaleng.2020.115289.
- Mazloum, Y., and A. Ghanem. 2022. “Dynamic modelling of a ground-coupled solar ejector cooling system.” International Journal of Sustainable Energy 41 (11): 1903–1937.
- Medina Carril, D. M., J. G. Carrillo, R. D. Maldonado, and F. Avilés. 2016. “Finite ele-ment Analysis of a Solar Collector Plate Using two Plate Geometries.” Ingeniería e Investi-Gación 36 (3): 95–101. https://doi.org/10.15446/ing.investig.v36n3.56071
- Mintsa Do Ango, A. C., M. Medale, and C. Abid. 2013. “Optimization of the Design of a Polymer Flat Plate Solar Collector.” Solar Energy 87. doi:10.1016/j.solener.2012.10.006.
- Nayak, Nagaraj, A. Anarghya, V. N. Abhishek, and Nasser Al Ghufaili. 2018. “Numerical and Experimental Investigation on Low Cost Solar Water Heater for Ruralareas of Oman.” MOJ Solar and Photoenergy Systems 2 (2): 43–48.
- Papadopoulos, A., T. Tsoutsos, M. Frangou, K. Kalaitzakis, N. Stefanakis, and A. G. Boudouvis. 2017. “Innovative Optics for Concentrating Photovoltaic/Thermal (CPVT) Systems–the Case of the PROTEAS Solar Polygeneration System.” International Journal of Sustainable Energy 36 (8): 775–786.
- Papamanolis, N. 2016. “An Overview of Solar Energy Applications in Buildings in Greece.” International Journal of Sustainable Energy 35 (8): 814–823.
- Pawar, V. R., and S. Sobhansarbandi. 2020. “CFD Modeling of a Thermal Energy Storage Based Heat Pipe Evacuated Tube Solar Collector.” Journal of Energy Storage 30. https://doi.org/10.1016/j.est.2020.101528.
- Quitiaquez, W., J. Estupiñan-Campos, C. A. Isaza Roldán, F. Toapanta-Ramos, and A. Lobato-Campoverde. 2020. Análisis numérico de un sistema de calentamiento de agua utilizando un colector solar de placa plana. Ingenius. https://doi.org/10.17163/ings.n24.2020.10.
- Rangababu, J. A., K. Kiran Kumar, and S. Srinivasa Rao. 2015. “Numerical Analysis and Validation of Heat Transfer Mechanism of Flat Plate Collectors.” Procedia Engineering 127. https://doi.org/10.1016/j.proeng.2015.11.331.
- Sami, S., E. Marin, and J. Rivera. 2016. “Numerical Analysis of Thermosyphon Solar Water Heaters.” International Journal of Energy and Power Engineering 5 (2): 83. https://doi.org/10.11648/j.ijepe.20160502.18
- Souliotis, M. 2021. Flat Plate Solar Thermal Collector. Mendeley Data.
- Vetter, B., S. Fischer, and H. Dr√(ck. 2018. CFD-Based Development, Testing and Optimization of Flat Plate Collectors. https://doi.org/10.18086/eurosun2018.12.03.
- Wang, N., S. Zeng, M. Zhou, and S. Wang. 2015. “Numerical Study of Flat Plate Solar Collector with Novel Heat Collecting Components.” International Communications in Heat and Mass Transfer 69. https://doi.org/10.1016/j.icheatmasstransfer.2015.10.012.
