
 ?Mathematical formulae have been encoded as MathML and are displayed in this HTML version using MathJax in order to improve their display. Uncheck the box to turn MathJax off. This feature requires Javascript. Click on a formula to zoom.
ABSTRACT
There are many factors to consider when deciding which technologies to use in forest operations and how to plan their use. One important factor is the overall cost when choosing between the established two-machine system (TMS) with a harvester and a forwarder, and a one-machine system with a harwarder in final fellings. Such considerations can be done with different model approaches, all of which have their strengths and weaknesses. The aim of this study was to analyze and compare the TMS and harwarder potential using a Detailed Optimization (DO) approach and an Aggregated Heuristic (AH) approach. The main differences are the aggregation of seasons, including machine system teams, and spatial considerations. The analyses were done for one full year of final fellings for a large forest company’s region in central Sweden, containing information necessary for calculating costs for logging, relocation between stands and traveling between the operator’s home bases and the stands. The approaches were tested for two scenarios; when only TMS were available, and when both TMS and harwarders were available. The main results were that the approaches coincided well in both potential to decrease total costs when harwarders where available, and distribution of TMS and harwarders. There were some differences in the results, which can be explained by differences in thecalculation approach. It was concluded that the DO approach is more suitable when detailed analyses are prioritized, and the AH approach is more suitable when a more approximate analysis will suffice or the available resources for making the analysis are more limited.
Introduction
Globally as well as locally, forest operations are conducted with different methods and by use of many different kind of machine systems (Lundbäck et al. Citation2018). When managing forest operations, many decisions must be made, including the choice of which machine system to use and how to plan its operation. There are many factors to be considered. The choice must take account of the key aspects of meeting the expectations for quality and production levels at the lowest possible cost. Such analyses can be carried out at various levels of applications. They include: 1) finding the ideal work conditions for a system by studying individual stands, 2) evaluation of a system’s performance in the existing work conditions by applying performance functions to several known or fictional stands and, finally 3) matching supply and industry demand and estimating relocation costs by finding ideal scheduling using geographical analysis of known or fictional stands and industry demand. The three levels contribute, respectively, to evaluate how machine systems perform in different stand conditions and in typical combinations of stand conditions, and in a situation when machine systems need to meet the requirement of a functional forest supply system.
Regardless of operation type, machine system comparisons need to take account of three distinct parts of the operations: the relocation of machines between the stands they operate in, the operators traveling back-and-forth between the stands and their home bases during operations, and the operation in the stands. Hence, such comparison demands input data about, for example, stand characteristics, stand locations, operators’ home bases and descriptions of machine performance in various conditions. The comparison can be carried out using different modeling approaches (Ringdahl et al. Citation2012). When there are physical machines available, time studies can be used to model the time consumption of the elements of the operation under various conditions (Eriksson and Lindroos Citation2014) and can, together with cost analysis, provide comparative analysis of machine systems (Di Fulvio and Bergström Citation2013). When there is a shortage of information on machine system performance, due to, for example, lack of data or that the analysis is done on machine systems that have not yet been built, theoretical machine system comparisons can be done based on available data (Ringdahl et al. Citation2012). Irrespective of whether the data used were derived from actual machines or from theoretical ones, modeling of the systems can be carried out using different approaches. For instance, constructing heuristics to find a near optimal solution is one approach; using optimization methods to find the best solution of all feasible ones is another. These can be combined as in Bredström et al. (Citation2010) where an annual harvesting problem is expressed in an optimization model and where an heuristic is used to solve the integrated problem in two phases, both using optimization models. Dems et al. (Citation2017) developed an optimization model for an annual harvesting problem and two customized heuristics for faster solution time. Frisk et al. (Citation2016) studied an operational harvesting problem where detailed sequences of harvest areas for each team are built gradually using a decomposition heuristic based on rolling horizon planning.
In ground-based, mechanized cut-to-length operations, the two-machine system (TMS), with a single-grip harvester and a forwarder, has been the most common method of logging in the Nordic countries since the 1990s (Eriksson Citation2016; Nordfjell et al. Citation2019). It is common for a TMS team to work on both final fellings and thinnings, although many teams are specialized in either operation. The machine operators usually live nearby and travel to the stand and back home every working day. However, there is a persistent desire to replace the TMS with a one-machine system (Andersson Citation1989; Silversides Citation1997). Several studies have been conducted on one-machine systems (a single harwarder), with a focus on evaluating its performance (productivity and/or cost) in different stand conditions. The analyses have been made on both thinning operations (Lilleberg Citation1997; Hallonborg Citation1998; Talbot et al. Citation2003; Väätäinen et al. Citation2006; Codd and Nieuwenhuis Citation2008; Kärhä et al. Citation2008) and final felling operations (Hallonborg and Nordén Citation2000; Wester and Eliasson Citation2003; Väätäinen et al. Citation2006; Bergkvist Citation2010; Manner et al. Citation2016; Jonsson Citation2020). Generally, the harwarder has shown greatest potential to compete with the TMS in final fellings with relatively small stand volumes and short extraction distances. The benefit when used for final felling rather than thinning operations is that it is easier to load logs directly onto the load bunk in final felling because there is more space. The benefit when logging small stand volumes is that only one machine needs to be relocated rather than two, and relocation costs get a larger proportion of the total costs compared with large stand volumes. Long extraction distances are beneficial for the TMS because it moves faster and has lower operational costs, and there is more forwarding work to do. Hence, short distances are beneficial for the harwarder. These benefits have been shown by many previous studies of harwarders, and also for the Komatsu X19, which is the latest harwarder machine developed for Nordic forest operations (Manner et al. Citation2016).
When deciding on whether to invest in a new machine system, it is beneficial to have information on how the system performs in the likely combinations of stand conditions that will be experienced, as well as how well it will manage to meet the requirement of a functional supply system. However, there is only a limited number of studies that have included these strategic considerations.
Both Lindroos (Citation2012) and Ringdahl et al. (Citation2012) made theoretical comparisons between use of harwarders and TMS:s in three different regions in Sweden with typical stand conditions. They found that the harwarder had the greatest potential for direct loading of logs for extraction of several different systems and was also comparable to the TMS over a large part of the harvested volume. However, due to the focus on comparing direct loading systems, the analysis did not consider the work of unloading logs at the landing. The potential in relation to the TMS was therefore assumed to be overestimated. Bredström et al. (Citation2010) optimized a machine fleet for using a TMS in a forest company’s region in central Sweden, and compared the results to when harwarders were also available. They used an optimization model to construct a machine fleet, assign stands to the machine system teams and schedule the stands for each team while solving an annual planning problem. It was found that there was potential to decrease the total costs by using some harwarders. This optimization approach is suitable for such large-scale analyses in which the requirements for supply and demand are addressed but requires special competence and detailed input data. This complexity also leads to relatively high analysis costs, and requires specialized software. Even though optimization approaches using specialized software commonly produce more reliable estimations, it is also possible to produce comparable results from analysis using standard software with well-constructed models (Asikainen Citation2010; Ringdahl et al. Citation2012). However, previous comparisons of modeling approaches have not addressed such a complex problem as finding a machine fleet in which the chosen machine systems together need to meet the requirement of a functional supply system.
Therefore, the aim of this study was to compare the outcome of two proposed modeling approaches for analyses of machine fleet composition. Both required extensive analysis of large input data, but requiring different types of competence and software: more specialized software with detailed input data was used for one, called Detailed Optimization (DO), whereas standard software and more aggregated data were used for the other, called Aggregated Heuristics (AH). Both approaches were applied to a specific case, and, since there is no correct answer as to how the machine fleet should be composed, the evaluation focused on how similar the output was from the two approaches.
Materials and methods
Description of the main areas and questions for a machine fleet analysis
A machine fleet analysis aims at finding the optimal machine fleet configuration which can carry out the desired operations within the required time with the expected quality and with the lowest possible costs. The costs are minimized by finding the most suitable configuration for the total machine fleet for a certain task (i.e. work in a specific geographical region). The analysis consists of assigning the available teams to the most suitable stands and determining the time of operations, including the movement of machines. The total costs include the activities associated with forest operations, relocation of the machine systems teams between the stands, and the operators’ travel back-and-forth between the home base while working in the stand. Configuration concerns determining the number of machines of a specific type (e.g. sizes) within a given machine system and/or between different machine systems. In such an analysis, there are constraints regarding quality and flow. Quality relates to factors, such as legislation, certification, and wood value. Flow relates to delivering the right product within the required time – commonly referred to as logistics or supply chain management. To do this, input data about the machines’ time consumption (in different operational environments), costs, the stands’ characteristics and supply and demand are needed. The desired outputs from a machine fleet analysis are the total costs, the number of teams within each machine system type, and an assignment and scheduling description of the machine fleet. Such outputs can then be used as a basis for deciding the machine fleet for a forestry organization.
In this study, we used two approaches to compare two scenarios. The first approach was a revised version of the annual optimization model used by Bredström et al. (Citation2010), here called Detailed Optimization (DO), and the second was a static spreadsheet analysis, here called Aggregated Heuristic (AH). The first scenario involved a forest company’s regions’ final fellings for one year, where only one type of machine system was available – a TMS consisting of extra-large harvesters and forwarders. In the second scenario, an additional machine system was available – an extra-large harwarder in competition with the TMS. The differences between the two scenarios were then the basis for estimating the potential for decreasing total costs using harwarders, and the fleet’s composition. A sensitivity analysis was performed to account for data uncertainty associated with time consumption equations and machine costs for the harwarder. The qualitative aspects of the machine systems’ performances were not addressed in the analyses, since it was assumed that the input data fully (or at least equally well) covered quality requirements for both TMS and harwarders.
The model approaches in brief
To estimate the total costs of a machine fleet, we made two types of estimations: those which were the same for both modeling approaches, and those which were unique to each approach. Those that were the same for both approaches were time consumption equations for the machines, as well as the equations for estimating costs for machine relocation and operator traveling. To carry out such estimations, interest rate, investment costs, stand conditions, distance between stands (see Equationeq. 1(1)
(1) –Equation7
(7)
(7) ) were used as input to the models. For those equations that were unique for each of the two approaches, different equations and/or parameter values were used. Also, the supply and demand relating to harvested roundwood were matched with higher precision in the DO than in the AH.
Detailed optimization
The Detailed Optimization was built using explicit equations for the spatial impact of relocation and traveling, and explicit equations regarding the matching between demand and supply per assortment and season. We used the Machine Resource Optimization approach, as described in Bredström et al. (Citation2010), and developed it further in this study. It is an optimization model, which constructs a machine fleet in the first phase, assign stands to the machine system teams (an assignment problem) in the second phase, and schedules the teams’ set of stands (a traveling salesperson problem for each team) in the third phase.
The model constructed a fleet of fictional machines connected to fictional home bases and did so for a specified geographical level, a region. The stand data relating to the assortment distribution of historical harvests were interpreted as the demand, such as the harvested volume of a certain assortment (e.g. pulpwood of spruce) during a specific season (e.g. spring, March to April). The whole input data material is used as supply. The available machines had a specified amount of work time that was possible to achieve over a particular season, and the use of a machine was connected to a cost. When estimating the logging costs within each stand, the machines were available with up to 100% utilization; if they were used less, the costs increased due to charges for downtime. Within the TMS, the use of the fastest machines was decreased to keep the balance with the slowest. The hourly costs increased as the machine ulitization decreased from 100%.
For each team, the model scheduled the order in which stands were harvested, so the actual distances between stands were used to calculate the relocation costs. The model used the actual driving distance between stands’ locations and the teams’ home bases to estimate traveling costs.
Aggregated heuristic
The Aggregated Heuristic was a static spreadsheet analysis, estimating how many machine teams of the TMS and/or the harwarder were needed to meet the demand. Instead of the specific relocation and travel input data as used in the DO, input data in the form of average values within a specific geographical district was used, which then were aggregated at a regional level together with the logging costs. The TMS and harwarder were first compared on each stand, and the system with the lowest total costs was assigned to the stand. The stands’ volumes allocated to each system were summarized for each district. If the volume was sufficient for a machine system team 100% of the time, it was used in the district, otherwise it was not available. It was then estimated how many teams would be needed to harvest the volumes.
The stand data were, just as for the DO, interpreted as supply but here they were also interpreted as demand, i.e., matching between supply and demand was realized for the whole analyzed time at once, without separating into different seasons. The estimations of machine utilization allowed the machines to be used 100% of the time, which is always the case for the harwarder and the least productive machine within the TMS. The fastest machine in the TMS was allocated a lower utilization to match the slowest, with increased costs to compensate for downtime-related costs – just as with the DO. There was no scheduling in the AH but to simplify, the model instead used a fixed assumed average distance between the stands to estimate the relocation costs, and also fixed the assumed average distance between stands and home bases to estimate traveling costs.
Model approach equations
Same equations in both model approaches
All time consumption equations are in productive minutes, with breaks up to 15 minutes included, per cubic meters solid under bark (PM15-min/m3). The equations for the harvester and forwarder were from Eriksson and Lindroos (Citation2014), which is the most current study. These do not include breaks, and so, here, the equations were divided by 0.917 for the harvester and 0.942 for the forwarder to give time with breaks up to 15 minutes (2019 conversation between the corresponding author and Magnus Bergman at the forest company SCA; unreferenced).
Harvester time consumption (, in PM15-min/m3) was estimated with an equation from Eriksson and Lindroos (Citation2014), where mean stem volume was used to predict time consumption (EquationEq. 1)
(1)
(1) .
= mean stem volume, m3 solid under bark (m3sub)/stem
Forwarder time consumption (, PM15-min/m3) was estimated with mean forwarding distance, mean stem volume and load size as predictors (EquationEq. 2)
(2)
(2) .
= mean forwarding distance, meters
In EquationEq. (2(2)
(2) ), the value 21.3 is the load capacity (in m3sub) assumed in this study, based on Manner et al. (Citation2016). EquationEq. (2)
(2)
(2) is not recommended to be used for very short mean forwarding distance values, since it then gives unrealistically low productivities according to the authors Eriksson and Lindroos (Citation2014). In the analysis, the distance was therefore kept at a distance before the estimated productivity radically dropped, if the stand’s distance was smaller than 78 meters.
Harwarder time consumption (, PM15-min/m3) was estimated as the total time consumption for the harvester and forwarder (
) multiplied by the difference between the two systems as defined by Manner et al. (Citation2016). The equations by Manner et al. (Citation2016) are particularly sensitive to changes in mean stem volume and mean forwarding distance (EquationEq. 3)
(3)
(3) .
= Time consumption for the harwarder, according to EquationEq. 13
(13)
(13) in Manner et al. (Citation2016).
= Time consumption for the harvester, according to EquationEq. 11
(11)
(11) in Manner et al. (Citation2016).
= Time consumption for the forwarder, according to EquationEq. 12
(12)
(12) , but without “q” and “+0.05-x,” in Manner et al. (Citation2016).
The machines time consumption estimations (EquationEq. 1(1)
(1) –Equation3
(3)
(3) ) (PM15-min/m3) were recalculated to productivity (m3/ PM15-h), by dividing 60 with the time consumption, before they are presented in the Results section.
All costs were calculated in Euros. At the time for the study, 1 Euro had the value of 1.1 US Dollars or 10 SEK (XE Citation2021). Machine costs were calculated using the model SkogforskFLIS (Hofsten et al. Citation2005) with inputs including fixed costs and variable costs. The model is similar to the model in Ackerman et al. (Citation2014). Fixed costs included repayment of loans based on interest rate, depreciation, insurance, costs for machine trolley (a wagon with, for example, space for lunch, basic service, and repairs), and operators’ salaries. Variable costs included fuel, maintenance, relocation between stands and the operators traveling between their home base and the stands.
Costs for relocating the machines and machine trolleys between the stands were calculated based on information from forest companies. A machine trolley usually has a fuel tank, a small room for meals and basic service and repair equipment. One relocation is needed per stand. On short distances, it is common to drive the machine between stands, whereas it is transported on a low-bed trailer when relocated across longer distances.
The costs for relocation across distances of more than 5 km (, in EURO/relocation) were calculated as (EquationEq. 4
(4)
(4) )
= Initial cost for the trailer, i.e., driving to the stand.
= Time for transport preparation, securing the machine on the trailer and unloading the machine when arriving at the next stand.
= Time for coupling the machine trolley and parking it by the next stand.
= Speed of the trailer, when driving loaded with a machine and trailer, km/h.
= Distance of relocation between stand i and j, km.
= Cost of the trailer, per scheduled machine hour (SM-h).
= Cost of the machine operator, per SM-h.
The speed when driving a trailer (, km/h), loaded with a machine and a trolley, can be compared to the speed of a timber truck. Our estimations were based on studies on timber trucks (Ranta and Rinne Citation2006), but the speed was multiplied by 0.8 to give a better comparison with a slower trailer. The factor 0.8 was chosen after discussion with an experienced trailer operator (EquationEq. 5)
(5)
(5) .
The costs for relocating on distances of 5 km or less (, in EURO/relocation), for machine m. 12 is the assumed average driving speed for a forest machine (km/h) while driving between stands (2019 conversation between the corresponding author and Robert Johansson at the forest company Holmen Forest; unreferenced) (EquationEq. 6)
(6)
(6) .
= Time taken to remove tracks and mount them at the next stand.
= Cost of machine m, EURO per hour.
The costs for operators’ travel between home base i and stand k one way (, EURO/one way travel) depend on the distance and the costs per km. Each work shift requires one journey there and back, and the number of shifts depends on how many shifts are needed to finish the logging operation (EquationEq. 7)
(7)
(7) .
= Distance between stand i and home base k, km.
= Cost of the operators driving between stand and home base, EURO per km.
The TMS has a balance challenge, typically, the harvester produces more per time unit. To manage this imbalance, the faster machine can be used less or the slower used more. In our calculations, all machines were limited to, at maximum, 100% utilization and, for the TMS, the fastest machine (most often the harvester) was used less.
Specific in detailed optimization
The optimization model used was defined using decision variables, parameters, objective function, and constraints. The objective function (8) gives the overall harvesting cost, forwarding cost, operator traveling cost, the machine relocation cost, and a penalty in case an aggregated demand is not met during the season. Constraint (9) states that each stand is assigned a machine system team. Constraint (10) states that an assignment can only be made if a team is selected to operate. Constraint (11) states the available time for each machine in each season. This includes any overtime used. Constraints (12) to (16) describe how overtime can be used with the TMS machines. More specifically, constraints (12) and (13) state that the overall capacity including overtime is limited to harvesting and forwarding time. Constraints (14) and (15) give the limit of overtime for each harvester and forwarder. Constraints (16) to (18) describe the relocation between stands for each machine. More specifically, constraints (16) and (17) give the relationship between relocation and specific stands that have been assigned to the machine. Constraint (18) and (19) gives the subtour elimination constraints generated using the Miller-Tucker-Zemlin formulation for VRP problems (Miller et al. Citation1960). Constraint (20) states the overall aggregated demand for all assortments over the seasons. Constraint (21) states that the selected machines’ operators must start and end at their home bases. Constraints (22) to (25) define the binary restrictions. Constraint (26) gives the nonnegativity constraints for the continuous variables.
This problem is a general large-scale mixed integer programming (MIP) problem. It consists of an allocation part, where machine systems are allocated to stands, and a traveling salesman problem (TSP) part, where the sequence for each machine system team is determined. The overall problem is very hard to solve directly. Hence, we applied a heuristic approach similar to that of Bredström et al. (Citation2010). It is different in that we incorporated seasonal demand, allowed overtime and set the capacity of all machines to be substantially higher. In Phase 1, we removed all variables and constraints relating to the TSP part (16) to (19), and relaxed all binary constraints except for whether a machine is used or not, zm, and the overtime variable, vmt . The solution to this phase produced the set of machines to use in Phase 2. In Phase 2, we used the set of machines generated in Phase 1 but with binary restrictions on the assignment, that is, ymit, and relaxed overtime variables. This phase gave the actual assignments for each machine. In Phase 3, we included the TSP constraints for each machine given the stands assigned for each season. This phase was solved by the MIP formulation given above for the TSP part and for each machine.
Sets and parameters used.
: set of stands
: set of home bases
: set of seasons
: set of machine systems (subsets
for TMS and harwarders respectively)
: set of assortments
= home base for machine system
= distance between stand
and stand
= fixed cost to use machine system
= cost to relocate machine in machine system
between stand
and stand
= harvesting time in machine system
in stand
= forwarding time in machine system
in stand
= harvest time available in machine system
in season
= forwarding time available in machine system
in season
= maximum harvesting overtime in machine system
in season
= maximum forwarding overtime in machine system
in season
= available time for machine system
= harvesting cost in machine system
in stand
= overtime cost in machine system
= forwarding cost in machine system
in stand
= operators’ traveling cost for machine system
in stand
= penalty cost for missing accumulated demand satisfaction until season
= volume of assortment
at stand
= volume of assortment
demanded in season
Decision variables are as follows.
The full DO model can now be stated as
Subject to.
Specific in aggregated heuristic
Based on the total costs for each system, the given stand is defined as either a TMS stand or a harwarder stand. If the accumulated volumes for a system type (TMS or harwarder) in a district is enough for one whole system or more (≥1 TMS or harwarder), it is available in the machine fleet for the district. The number of the machine system teams is, however, not an integer in the AH but aggregated which simplifies the problem to be solved.
All available stands are included in the cost calculation, which means that supply and demand is balanced – not for separate seasons – but for the whole planning period. However, if the volume is not enough for the other system, it is made unavailable. Last, if the volumes for each system are not enough for either of the systems, the system that has the lowest total costs in the whole district is made available.
The costs for relocating between stands and traveling between home base and the stands were estimated using EquationEq. (4-7(4)
(4) ) with the same assumed averages as input for distances regardless of machine system. The distance between the stands (
) and the distance between home base and the stands (
) were determined after discussions with forest company representatives who had a good knowledge of machine fleet management.
Case study
The source of the interest rate was Stibor 90, plus 3% (Sveriges Riksbank Citation2019). Costs for insurance, machine trolley, operator salary, available days per year were obtained from a group of Swedish forest companies. All machines were assumed to operate with two shifts, with extra payment for overtime (extra time beyond agreed normal time per shift) and uncomfortable hours (working time early mornings, late evenings, or weekends) according to collective agreement (SLA-GS Citation2013). Machine investment costs, diesel consumption, and oil consumption were obtained from a machine manufacturer (Manner et al. Citation2016) ().
Table 1. Input data for machine costs calculations.
Technical utility (TU) is connected to a machine’s technical complexity and the maturity of its technology, and a high TU indicates a well functioning machine, which is connected with a lower cost impact. Both the harvester and the forwarder are technologically mature, and hence have high TU. The harvester is more complex than the forwarder. The harwarder is assumed to have a similar maturity of technology as the harvester and the forwarder, but also has a tilt and rotatable load carrier and quick hitch and so might be expected to have a higher TU than both because of its complexity. On the other hand, the technology for harvesting is only used until the load carrier is filled. Then, the harwarder transports its load to the roadside and unloads using a forwarder grapple. Therefore, the harvester and the harwarder were assigned the same TU ().
The distance between the stands () and the distance between home base and the stands (
) were determined in discussions with forest company representatives who had a good knowledge of machine fleet management.
The analysis was carried out using final felling input data from a forest company’s region in central Sweden, harvested during 2017. To ensure realistic information, stands were only included if they had a net felling area >0.5 hectare, a total volume >99.9 m3sub per stand, and extracted volume <803 m3sub per hectare. These levels were chosen in discussions with the forest company. Six assortments were, on average, harvested per stand. No information about the company’s operators’ home bases was available. The AH used the input data divided into four districts ().
Table 2. Input data for the region’s four districts, as used in the AH. In the DO, all stands were used irrespective of district borders. All mean values are volume weighted.
In the DO, the relocating distance was estimated from the stand’s coordinates. In the AH, the distance was fixed and, in discussions with the company, assumed to be 25 km. In the DO, a network of available positions for home bases was constructed, with the distance between each position 37 km north-south and 63 km east-west. In the AH, the distance for traveling between home base and stands was fixed and, after discussions with the company, assumed to be 35 km. The forest company mostly use contractors but also manage their own logging machines. All results were validated by the company.
Analysis
The main results from the analysis are total costs and the fleet composition with scenario 1 (only TMS) and scenario 2 (TMS and harwarder).
The DO was carried out using a standard laptop with the AMPL modeling language and the CPLEX 12.6 solver. We used the default MIP gap in CPLEX for all problems, that is, 0.00001.
The DO model used three seasons, nine assortments, 72 potential TMSs, 72 potential harwarders, and 1044 stands. The maximum allowed solution time was 24 hours for Phase 1 and Phase 2. For Phase 3, we used a maximum time of 20 seconds for each machine. After preprocessing, the Phase 1 problem had 154269constraints and 452233variables (1008 binary). The solution was found after about an hour (3747 seconds). After preprocessing, the Phase 2 problem had 36072constraints and 104029variables (103 044 binary). The solution terminated after the maximum solution time of 23 hours with a gap of 0.05%. The solution after one hour had a gap of 0.09%. The Phase 3 problem to find the TSP solution for each machine was solved within 20 seconds for most of the problems. The size of Phase 3 depended on how many stands were assigned to each machine; we note that the average size for the TSP (one for each selected team) was about 30 stands.
The AH was carried out using a standard laptop running Microsoft Excel. The model consisted of eight columns of input data and 191 columns of calculations in one worksheet, and eight columns in another worksheet where the results were gathered.
Since the time consumption functions and cost levels for the TMS originated from large input data sources, and the harwarders originated from much smaller data sources, we were not as confident of the time consumption function and cost levels for the harwarder. To cover, we performed a sensitivity analysis of how the results changed for each approach and between them, while we adjusted harwarder time and costs within a reasonable interval.
Results
Machine fleet composition when only using the two-machine system
When analyzing the first scenario, the two modeling approaches gave a very similar number of machines required, with slightly more with the DO. Moreover, both approaches found that, of the two machine types, the forwarders were closest to full utilization which shows that the harvesters produced more volume per time unit. However, the level of utilization was higher with the AH than with the DO. The mean relocation distance was 37 km with the DO ().
Table 3. Analysus results from the two approaches when only one machine type (the two-machine system (TMS)) was available.
Both modeling approaches also gave very similar distributions between cost components ().
Table 4. Relative distribution (%) of costs for the two approaches.
Two-machine system and harwarders in competition
When analyzing the second scenario, the results from the two approaches were also very similar. When rounding the number of machine system teams with the AH, the results were in fact identical with the DO. The AH gave slightly lower total costs and utilization than the DO, the difference being only 0.45 million EURO. The estimated savings were 1.5% between the approaches ().
Table 5. Results from the analysis of the two approaches when two machine systems (TMS and harwarders) were competing.
The costs for relocations and traveling in relation to total costs were generally a little lower with the AH than with the DO, and the logging costs were higher. The total costs were still very similar (). The relocation distance was 13 km for the TMS and 11 km for the harwarder with the DO, compared with the assumed 25 km with the AH. The traveling distance was 26 km for the TMS and 27 km for the harwarder ().
Table 6. Cost distribution in percentage (%) for the two approaches.
Sensitivity analysis
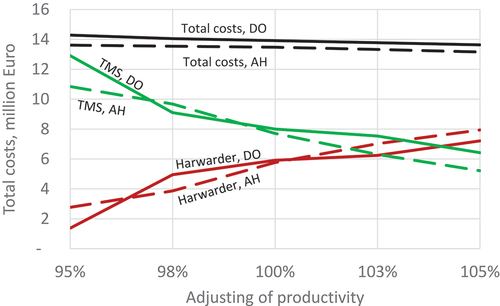
Productivity
When adjusting the harwarders’ productivity from 95% to 105%, the total costs with the AH were consistently lower than with the DO (3.2–4.7%). At low productivity levels, the total costs were mainly attributable to the TMS, which corresponds to more TMS teams; with high productivity levels, the total costs were attributable more to the harwarder and hence to a greater number of harwarders ().
Figure 1. Total costs when the harwarder productivity was adjusted from 95% to 105%.
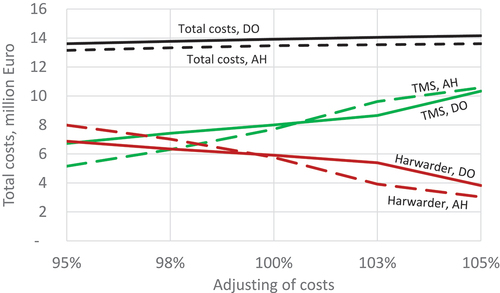
Costs
When adjusting the harwarders costs from 95% to 105%, the total costs with the AH were consistently lower than with the DO (3.2–3.9%). At low harwarder cost levels, the total costs were attributable more to the harwarder, which corresponds to a greater number of harwarders; with high harwarder cost levels, the total costs were mainly attributable to the TMS, corresponding with a greater number of TMS teams. The impact on total costs when adjusting the harwarder costs were slightly greater than when adjusting the productivity ().
Figure 2. Total costs while the harwarder costs are adjusted from 95% to 105%.
Discussion
This study aimed to propose and compare the results from a Detailed Optimization model approach and an Aggregated Heuristics model approach, by analyzing similarities and differences in a case study.
The estimated total costs were consistently lower with the AH compared with the DO. In the sensitivity analysis, the difference was at most 4.7%, when the harwarders’ productivity was decreased by 5%. More commonly, it was around 3.6% for the two sensitivity analyses. Asikainen (Citation2010) compared a static model approach to a dynamic one and found a 10% cost difference, on average. Our results are hence clearly closer. Even though the approaches give concurrent results, there are some differences with logical reasons.
The machine utilization was generally higher with the AH than with the DO, because of the different model assumptions, such as regarding relocations and traveling. The AH, therefore, shows potential for lower total costs because the number of teams are aggregated per district, but the DO better reflects what to expect operationally, since it estimates fictional teams. The difference is, however, relatively small, with at most 4.7% between the approaches in the sensitivity analysis, which is clearly lower than shown in similar comparisons (Asikainen Citation2010). The balance calculations with the DO generally led to higher logging costs because all machines were used less than 100%. On the other hand, the relocation costs and the traveling costs were lower, because the DO found better solutions than the assumed average values used in the AH. This indicates a potential to use the DO strategically to choose the borders between districts better. The AH shows the potential for machine systems within existing district borders. The logging costs are, however, the dominating cost component. The dynamics of the stand characteristics contributes to the non-linear cost change when the harwarder productivity or costs are changed.
In the DO, the supply and demand were matched per season during the analyzed year, which gives a good reflection of operational reality. The AH only matched for the whole case and not on individual machine systems, which is a large simplification. Both approaches can be used for suggesting how many machine system teams are needed within a region, that is, support decisions on a tactical level. However, the DO can also provide information on where the teams should be located and how they should work operationally.
In the AH, the relocation and traveling costs are estimated based on assumptions, which were chosen in discussions with the forest company. The AH results can, therefore, represent what to expect operationally. In the DO, the relocation and traveling costs were calculated based on known locations of the stands and suggested home bases. Since the DO returned lower costs for relocation and traveling, it shows a potential to decrease the costs by improved planning with such an approach. However, there might naturally be challenges to persuade machine operators to decide where to live, since the short travel distance value will be considered in competition with other values relevant for the operators and their families.
o carry out machine fleet analyses using either of the approaches compared, sufficient competence is required. The DO requires suitable software and personnel with advanced modeling and optimization expertise. The AH requires personnel with modeling expertise. We used Microsoft Excel™ but other software might be used, such as Matlab or R. The DO requires more precise input data. When choosing which stand to harvest, different assortments’ volumes per stand and harvesting dates are necessary. In the AH, the total volume is enough, because the matching between supply and demand is only carried out for the whole case without accounting for the assortment’s delivery in shorter time periods. The DO problem is very large. However, by splitting the solution into three phases, where each is considerably easier to solve, it is possible to find high-quality solutions. The splitting of the solution can be viewed as making strategic decisions in Phase 1, that is, selecting the machine system teams, tactical in Phase 2, that is, assigning stands to teams, and finally operational in Phase 3, that is, determining the schedule for each team. The splitting of the solution can also be viewed as an approach to avoid symmetry. There is a huge number of solutions and, as teams are similar, there are many similar solutions. By selecting the machine systems in Phase 1, we remove a large degree of the symmetry in the model. Large symmetry is known to make the branch and bound technique very slow. In Phase 2, the problem has a fixed set of machine system teams to choose from and, here, the number of binary variables is at its largest. However, as there is some structure to the assignments, it is relatively efficient to solve the problem although we use the maximum time. The solution quality of 0.09% is very close to the optimal solution. An alternative would be to solve only the DO model’s linear programming relaxation. This solution only takes a few seconds, and the aggregated solution could be used, like the AH, to obtain an approximate required size of a machine fleet.
Both approaches handled spatial variation within a geographical region, but in different ways. In the DO, the geographical sublevel of districts was not included, resulting in an optimization of the machine fleet and its work for the region. This is valuable from a top-level strategic point of view, but might be challenging to implement if district borders are strongly adhered to in daily operational work. In the AH, on the other hand, the district borders were the key element for handling the spatial aspect, since there had to be enough work for at least one team of a machine system in a district. So even if it was not addressed in this study, it can be expected that the DO approach would handle regions better in which the stand condition variations are not well matched with the district borders. These expectations would be interesting to evaluate further with larger input data.
In this comparison, both the number of systems was very limited and all teams within each system were considered identical. If desiring to increase the number of systems, or to differentiate teams within systems in a machine fleet analysis, it is possible with both approaches but they offer different possibilities and limitations. The difference between teams would consist in differentiating input related to the team’s time consumption and costs. Reasons for doing so in an analysis could be to, for instance, represent different sizes of the machines within the system (e.g. to have “sub-systems” with teams consisting of small-, medium-, and large-sized harvesters and forwarders). It could also be to represent the known unique performance of actual teams of a machine system that is under consideration for being replaced with another system. With the AH, both increased number of systems and differentiated teams can be added, and is then handled in the same way – like the machine systems in this analysis. So in the AH it does not matter if it truly is new machine systems or just differentiations with a machine system. Hence, to add “subsystems” like machine sizes is quite easy irrespective of the total number of teams in the analysis, whereas the problem design grows rapidly if each team within a system should be considered unique. Also with the DO, it would be possible to both increase the number of systems and to differentiate teams within systems. However, in contrast to the AH, it would be easier to differentiate teams than to add systems. With the DO, there was more than one team of each machine system available from each home base with equal time equations and cost estimations for each machine, adding a symmetry challenge, and it is therefore faster to optimize with differentiated time equations and cost estimations for each team’s machine(s). This is an advantage for the DO when preparing a tactical plan with variations due to differences between individual machine system teams. Adding new systems to the DO would be possible, but each system would considerably increase the problem to solve.
Neither one of the model approaches’ results could be validated as correct. However, we involved the forest company in the project and they viewed the results from the scenario with only TMS, which is comparable with their operations, as realistic.
This study focused on comparing the results from two model approaches, when two machine systems compete within a forest company region. With reliable time equations and cost estimations for new or even as yet non-existent machine systems, our approaches can provide a basis for comparison with the established machine system. The approaches can also be used for comparisons in other geographical regions, and specifically with other stand characteristics.
Conclusions
Among the advantages with the DO, we can conclude that it is a detailed model approach, which gives a good view of the operational reality. It also takes reasonable machine utilization into account. On the other hand, it is resource demanding and needs more input data.
Among the advantages for the AH, we can see that it is resource efficient, requires less input data and can be constructed using standard software. As it requires less input data, it reflects the operational reality less well compared with the DO, for instance, regarding machine utilization, supply, and demand.
Both approaches are dependent on the quality of the input data, since high input data quality gives high output quality, whereas low input data quality produces no useful results. Both approaches have the potential to develop and provide a better decision basis, and give coherent results in terms of the machine fleet’s number of machines and costs. However, the DO also provide additional results in terms of where machine teams should be stationed as well as the scheduling of teams’ work.
Both approaches are well suited for analysis of large input data, and we recommend using the DO when the need for precision is high and suitable input data are available, but to choose the AH when those are not required or available. However, the results of this study relate to one case region in central Sweden and it would be interesting to see how the two approaches work with other case conditions.
Acknowledgements
We want to thank the Foundation of Karl Erik Önnesjö (Karl Erik Önnesjös stiftelse) for financial support. We also thank the anonymous forest company who gave us access to all input data and for whom we carried out the analysis. Finally, thanks to Rolf Björheden, Lars Eliasson, Jussi Manner, and Anders Mörk for valuable discussions on how to improve the paper.
Disclosure statement
No potential conflict of interest was reported by the author(s).
Additional information
Funding
References
- Ackerman P, Belbo H, Eliasson L, de Jong A, Lazdins A, Lyons J. 2014. The COST model for calculation of forest operations costs. Int J For Eng. 25(1):75–81. doi:10.1080/14942119.2014.903711.
- Andersson G 1989. Kombinationsmaskin skördare-skotare - en ny maskingeneration? [Combination machine harvester-forwarder – a new machine generation?]. Kista: Forskningsstiftelsen Skogsarbeten. Resultat Nr. 17. Swedish.
- Asikainen A. 2010. Simulation of stump crushing and truck transport of chips. Scand J For Res. 25(3):245–250. doi:10.1080/02827581.2010.488656.
- Bergkvist I 2010. Drivare i svenskt skogsbruk – erfarenheter och möjligheter till utveckling [The harwarder in Swedish forestry – experiences and potential for further development]. Uppsala: Skogforsk. Redogörelse Nr. 1. Swedish.
- Bredström D, Jönsson P, Rönnqvist M. 2010. Annual planning of harvesting resources in the forest industry. Int trans Oper Res. 17(2):155–177. doi:10.1111/j.1475-3995.2009.00749.x.
- Codd J, and Nieuwenhuis M. 2008. A feasibility study on the performance of a harwarder in the thinning of small scale forests in Ireland . Irish Forestry Journal. 65(1&2): 37-46.
- Dems LM, Rousseau JM, Frayret. 2017. Annual timber procurement planning with bucking decisions. Eur J Oper Res. 259(2):713–720. doi:10.1016/j.ejor.2016.10.039.
- Di Fulvio F, Bergström D. 2013. Analyses of a single-machine system for harvesting pulpwood and/or energy-wood in early thinnings. Int J For Eng. 24(1):2–15. doi:10.1080/14942119.2013.798935.
- Eriksson M. 2016. Developing client-supplier alignment in Swedish wood supply. Acta Universitatis Agriculturae Sueciae. 2016:32.
- Eriksson M, Lindroos O. 2014. Productivity of harvesters and forwarders in CTL operations in northern Sweden based on large follow-up datasets. Int J For Eng. 25(3):179–200. doi:10.1080/14942119.2014.974309.
- Frisk M, Flisberg P, Rönnqvist M, Andersson G. 2016. Detailed scheduling of harvest teams and robust use of harvest and transport resources. Scand J For Res. 31(7):681–690. doi:10.1080/02827581.2016.1206144.
- Hallonborg U 1998. Drivare: en analys av maskiner för avverkning och transport [Harwarder: an analysis of machines for harvesting and extraction]. Uppsala: SkogForsk. Arbetsrapport Nr. 392. Swedish.
- Hallonborg U, Nordén B 2000. Räkna med drivare i slutavverkning [Count on harwarders in final felling]. Uppsala: SkogForsk. Resultat Nr. 21. Swedish.
- Hofsten V, Lundström H, Nordén B, Thor M 2005. System för uttag av skogsbränsle - Analyser av sju slutavverkningssystem och fyra gallringssystem [System for extraction of forest fuel – analyses of seven final felling systems and four thinnings systems]. Uppsala: Skogforsk. Arbetsrapport Nr. 597. Swedish.
- Jonsson R, Mörk A, Manner J, Englund M 2020. Drivarens utvecklingspotential - Resultat från workshop med drivarförare [Development potential for harwarders – results from a workshop with harwarder operators]. Uppsala: Skogforsk. Arbetsrapport Nr. 1058. Swedish.
- Kärhä K, Rieppo K, Poikela A. 2008. Why harwarders for wood harvesting? Scandinavian Forest Economics: Proceedings of the Biennial Meeting of the Scandinavian Society of Forest Economics, Nr. 42; Apr 6-9; Lom, Norway.
- Lilleberg R 1997. Harvester-forwarder for logging in first-thinning stands. Helsinki: Metsäteho. Report Nr. 28.
- Lindroos O. 2012. Evaluation of technical and organizational approaches for directly loading logs in mechanized cut-to-length harvesting. Forest Science. 58(4):326–341. doi:10.5849/forsci.11-001.
- Lundbäck M, Häggström C, Nordfjell T 2018. Worldwide trends in the methods and systems for harvesting, extraction and transportation of roundwood. Proceedings of the 6th International Forest Engineering Conference “Quenching our thirst for new Knowledge”; Apr 16-19; Rotorua, New Zealand.
- Manner J, Jonsson R, Jönsson P, Björheden R, Lundström H 2016. Prestation och drivningskostnad för drivarprototypen Komatsu X19 jämfört med ett konventionellt tvåmaskinsystem [Productivity and logging costs of the harwarder prototype Komatsu X19 and a conventional CTL system]. Uppsala: Skogforsk. Arbetsrapport nr. 916. Swedish.
- Miller CE, Tucker AW, Zemlin RA. 1960. Integer programming formulation of traveling salesman problems. Journal of ACM. 7(4):326–329. doi:10.1145/321043.321046.
- Nordfjell T, Öhman E, Lindroos O, Ager B. 2019. The technical development of forwarders in Sweden between 1962 and 2012 and of sales between 1975 and 2017. Int J For Eng. 30(1):1–13. doi:10.1080/14942119.2019.1591074.
- Ranta T, Rinne S. 2006. The profitability of transporting uncomminuted raw materials in Finland. Biomass Bioenergy. 30(3):231–237. doi:10.1016/j.biombioe.2005.11.012.
- Sveriges Riksbank. 2019. Sök räntor & valutakurser [Search interest rates and exchange rates]. Swedish; [Accessed 2019 Feb 26]. https://www.riksbank.se/sv/statistik/sok-rantor–valutakurser/?g5-SEDP3MSTIBORDELAYC=on&from=2011-08-23&to=2021-09-23&f=Month&c=cAverage&s=Comma
- Ringdahl O, Hellström T, Lindroos O. 2012. Potentials of possible machine systems for directly loading logs in cut-to-length harvesting. Can J For Res. 42(5):970–985. doi:10.1139/x2012-036.
- Silversides CR. 1997. Broadaxe to flying shear: the mechanization of forest harvesting east of the rockies. Ottawa (ON, Canada): National Museum of Science and Technology.
- SLA-GS 2013. Kollektivavtal om löner och allmänna anställningsvillkor mellan Skogs- och Lantarbetsgivareförbundet och GS för tiden 2013-04-01 - 2016-03-31 [Collective aggreements on wages and general terms of employment between Skogs- och Lantarbetsgivareförbundet and GS for the time 2013-01-01 – 2016-03-31]. Swedish: SLA-GS.
- Talbot B, Nordfjell T, Suadicani K. 2003. Assessing the utility of two integrated harvester-forwarder machine concepts through stand-level simulation. Int J For Eng. 14(2):31–43. doi:10.1080/14942119.2003.10702476.
- Väätäinen K, Liiri H, Röser D 2006. Cost-competitiveness of harwarders in CTL-logging conditions in Finland-A discrete-event simulation study at the contractor level. Proceedings of the International Precision Forestry Symposium “Precision Forestry in plantations, semi-natural and natural forests”; Stellenbosch, South Africa; Stellenbosch University.
- Wester F, Eliasson L. 2003. Productivity in final felling and thinning for a combined harvester-forwarder (harwarder). Int J For Eng. 14(2):45–51. doi:10.1080/14942119.2003.10702477.
- XE. 2021. XE Valutaomvandlare [XE currency converter]. Swedish; [Accessed 2021 Dec 13] https://www.xe.com/sv/currencyconverter/