
Abstract
Objective: To develop and evaluate a test of the ability to process binaural temporal-fine-structure (TFS) information. The test was intended to provide a graded measure of TFS sensitivity for all listeners. Design: Sensitivity to TFS was assessed at a sensation level of 30 dB using the established TFS-LF test at centre frequencies of 250, 500 and 750 Hz, and using the new TFS-AF test, in which the interaural phase difference (IPD) was fixed and the frequency was adaptively varied. IPDs varied from 30 to 180°. Study Sample: Nine young (19–25 years) and 23 older (47–84 years) listeners with normal hearing over the tested frequency range. Results: For the young listeners, thresholds on the TFS-AF test did not improve significantly with repeated testing. The rank-ordering of performance across listeners was independent of the size of the IPD, and moderate-to-strong correlations were observed between scores for the TFS-LF and TFS-AF tests. Older listeners who were unable to complete the TFS-LF test were all able to complete the TFS-AF test. Conclusions: No practice effects and strong correlations with an established test of binaural TFS sensitivity make the TFS-AF test a good candidate for the assessment of supra-threshold binaural processing.
Introduction
Broadband signals like speech are decomposed in the peripheral auditory system into a number of bandpass-filtered signals corresponding to the outputs of different auditory filters. Each of these signals can be considered as a slowly-varying temporal envelope (TE) superimposed on a more rapidly varying carrier, the temporal-fine-structure (TFS). In the human auditory system, TE information seems to be coded for envelope rates up to about 1000 Hz. Amplitude modulation cannot be detected for higher rates, except when spectral cues are available (Kohlrausch, Fassel, and Dau Citation2000). TFS information is conveyed by neural synchrony (phase locking) to individual cycles of the TFS, and phase locking becomes very weak for frequencies above 4000–5000 Hz, although the exact upper limit in humans is not known (Verschooten and Joris Citation2014).
It has been known for many years that TE information is important for speech intelligibility (Dudley Citation1939), and more recent evidence suggests that medium-rate modulations (from 4 up to about 16 Hz) are especially important for the intelligibility of speech in quiet (Drullman, Festen, and Plomp Citation1994; Shannon et al. Citation1995), while a somewhat wider range of modulation rates may be important for speech in background sounds (Füllgrabe, Stone, and Moore Citation2009; Stone, Füllgrabe, and Moore Citation2009, Citation2010).
The contribution of TFS information to speech intelligibility is less well understood. However, there is evidence that TFS cues are used for sound localisation (Rayleigh Citation1907), pitch perception (Plack and Oxenham Citation2005), perception of tones in tone languages (Xu and Pfingst Citation2003), and stream segregation for tones (Füllgrabe and Moore Citation2012, Citation2014). It has been proposed that TFS cues may be important for the perceptual separation of target speech from interfering sounds (Hopkins and Moore Citation2011; Moore Citation2014) and may underlie the ability to take advantage of the energetic minima in fluctuating background sounds, so-called dip listening (Lorenzi and Moore Citation2008). The latter proposal is however contradicted by studies showing that dip-listening performance for speech in noise is similar for speech containing strong or intact TFS cues and speech containing weak or altered TFS cues (Oxenham and Simonson Citation2009; Freyman, Griffin, and Oxenham Citation2012). In addition, Füllgrabe, Moore, and Stone (Citation2015) found no significant association between TFS sensitivity and a measure of dip listening for young and older normal-hearing (NH) listeners. Finally, the binaural processing of TFS information may be important in allowing listeners to take advantage of spatial separation between the target speech and interfering sounds (Neher et al. Citation2012).
There is increasing evidence that both hearing loss and age can adversely affect the processing of TFS information (Hopkins and Moore Citation2007, Citation2011; Grose and Mamo Citation2010; Moore et al. Citation2012, Moore, Vickers, and Mehta Citation2012; Füllgrabe Citation2013; Füllgrabe and Moore Citation2014; Füllgrabe, Moore, and Stone Citation2015). This has led to interest in the development of tests that could be used in the clinic or in large-scale research studies to assess monaural and binaural sensitivity to TFS. A test of binaural sensitivity to TFS might be useful in the clinic for choosing the most appropriate type of signal processing in hearing aids. For example, for people with very poor sensitivity to binaural TFS, bilaterally fitted hearing aids incorporating binaural beamforming might be appropriate. Such aids have a highly directional characteristic, increasing the speech-to-background ratio for speech coming from the front, but this comes at the cost of loss of interaural time difference (ITD) cues (Launer, Zakis and Moore Citation2016). The cost would be small for people whose sensitivity to binaural TFS was already very poor. On the other hand, for people with good binaural TFS sensitivity, hearing aids should preserve ITD cues, since such cues are likely to be important for the spatial release from masking (Neher et al. Citation2012).
Tests intended for use in the clinic or in large-scale research studies should be feasible for most listeners, reasonably quick to administer, and give reliable results without the need for protracted training. It should be possible to perform the tests reliably at a relatively low sensation level (SL), as hearing-impaired (HI) people often have loudness recruitment (Steinberg and Gardner Citation1937), and so find sounds presented at a high SL to be uncomfortably loud.
Moore and Sek (Citation2009) developed a test, called the TFS1 test, for assessing monaural sensitivity to TFS. This test requires listeners to discriminate harmonic tones (H) with fundamental frequency F0 from the same tones with all components shifted upwards by the same amount in Hertz, Δf, leading to an inharmonic tone (I). The H and I tones have the same envelope repetition rate (corresponding to F0) but different TFS. For listeners who are sensitive to TFS, the H and I tones are perceived to have a different pitch if Δf is sufficiently large. All tones are passed through a fixed bandpass filter whose centre frequency is chosen such that only relatively high, unresolved components are audible. A background noise is used to mask combination tones and to prevent components falling on the skirts of the bandpass filter from being audible. A two-interval, two-alternative forced-choice (2I, 2AFC) procedure is used. In each interval four successive tones are presented. One interval contains the sequence HHHH and the other contains the sequence HIHI. The listener is asked to identify the interval in which the pitch was heard to change across tones, and the value of Δf is adapted to determine a threshold. This task is easy to explain to listeners, and practice effects are small (Moore and Sek Citation2009).
There are, however, some problems associated with the TFS1 test. Firstly, the H and I tones do have slightly different excitation patterns, and in principle these differences could be used to perform the task (Micheyl, Schrater, and Oxenham Citation2013), especially when combination tones are taken into account (Oxenham, Micheyl, and Keebler Citation2009), although there are several lines of evidence suggesting that the task is not performed using excitation-pattern cues (Moore and Sek Citation2009, Citation2011; Jackson and Moore Citation2014; Marmel et al. Citation2015). Secondly, some older people with hearing loss (Hopkins and Moore Citation2007) and with normal audiograms (Moore, Vickers, and Mehta Citation2012; Füllgrabe, Moore, and Stone Citation2015) cannot perform the TFS1 test at all, so the test cannot be used to obtain a graded measure of sensitivity to TFS in those listeners. Thirdly, the test requires the bandpass filter to be centred on relatively high-frequency components, so the test cannot be used to measure sensitivity to TFS for centre frequencies below about 850 Hz.
A test of binaural sensitivity to TFS was developed by Hopkins and Moore (Citation2010). The test, called the TFS-LF test, is based on measuring thresholds for detecting changes in interaural phase difference (IPD) in bursts of pure tones, presented via headphones. The envelopes of the tones are synchronous across the two ears, so there is an interaural disparity in the TFS only. Listeners must be sensitive to TFS to detect such a disparity, which is usually heard as a shift in the position of the tone inside the head. The TFS-LF test has a similar structure to the TFS1 test. In each of two intervals, four successive tone bursts are presented. In one interval, the IPD is 0° for all four tones. In the other interval, the IPD alternates between 0 and φ across tones. The listener is asked to identify the interval in which the tones appear to move within the head. The value of φ is adapted to determine a threshold. As for the TFS1 test, the task is easy to explain to listeners, and practice effects are small (Hopkins and Moore Citation2010).
Although it is widely accepted that the TFS-LF test provides a good measure of sensitivity to binaural TFS, the test does have a limitation. Usually, in a given research study, the frequency of the tones is fixed, for example at 500 or 750 Hz. However, with the chosen frequency, some, especially older, listeners prove unable to perform the task (Hopkins and Moore Citation2011; Moore, et al. Citation2012; Füllgrabe Citation2013; Füllgrabe, Moore, and Stone Citation2015). The proportion reported to be unable to perform the task ranges from 9% (i.e. 3 out of 35 listeners; Moore, Vickers, and Mehta Citation2012) to 40% (i.e. 14 out of 35 listeners; Whitmer, Seeber, and Akeroyd Citation2014). Thus, as for the TFS1 test, a graded measure of sensitivity to TFS is not obtained for a considerable number of listeners. That limitation motivated the development and validation of the test described in the present paper. It was reasoned that the ability to detect a given IPD should worsen rapidly above a certain frequency, but that the limiting frequency varies across listeners (Ross et al. Citation2007; Grose and Mamo Citation2010; Brughera, Dunai, and Hartmann Citation2013). Therefore, it should be possible to use a task similar to that used for the TFS-LF test, but with the IPD fixed at a given value (e.g. 180°) and with the frequency adaptively varied to determine a threshold. This test is called the TFS-AF test, where AF stands for adaptive frequency. It was expected that, even for listeners who could not perform the TFS-LF test, the TFS-AF test would be possible if the frequency were made low enough. The test is conceptually similar to those used in previous investigations (Ross et al. Citation2007; Grose and Mamo Citation2010; Neher et al. Citation2011; Santurette and Dau Citation2012) but differs in its implementation.
Here, we first present normative data for the TFS-AF test, obtained using young adults with normal hearing. It was reasoned that if the new test could not be performed reliably by those listeners, or if it required extensive practice to achieve reliable performance, it would probably not be suitable for more heterogeneous groups of listeners (e.g. children, older people or HI listeners). We show that, in fact, all listeners could perform the task reliably, practice effects were small, and the results of the TFS-AF test were highly correlated with results of the TFS-LF test, confirming the validity of the new test. We then present evidence that the TFS-AF test is also suitable for older listeners with normal audiometric thresholds at low frequencies; all such listeners who were tested could perform the TFS-AF test, even when they were unable to complete the TFS-LF test.
General method
This study was approved by the Cambridge Research Ethics Committee and the University of Nottingham’s School of Psychology Ethics Committee.
Stimuli and procedure
The ability to detect changes in IPD of low-frequency sinusoidal tones was assessed using the older TFS-LF test (Hopkins and Moore Citation2010) and the new TFS-AF test. For both tests, a 2I, 2AFC procedure with feedback was used. On each trial, two consecutive intervals were presented, separated by 500 ms. Each interval contained four consecutive 400-ms tones (including 20-ms raised-cosine rise/fall ramps), separated by 100 ms. Note that the tone duration and silent intervals are longer than those used in the original TFS-LF test (Hopkins and Moore Citation2010) but are the same as used in a recent study of young and older NH listeners (Füllgrabe, Moore, and Stone Citation2015). The reason for using longer durations in that study was that some older listeners complained that the stimuli were “too fast” when the original durations were used. In one interval, selected at random, the IPD of all tones was 0° (the standard). In the other interval (the target), the first and third tones were the same as in the standard interval while the second and fourth tones differed in their IPD by φ. Listeners who are sensitive to binaural TFS perceive pure tones with IPD = 0° as emanating from close to the centre of the head, while tones with a sufficiently large IPD are perceived as being lateralised towards one ear. Note that the greatest difference between the first and third tones and the second and fourth tones occurs when the IPD is 180°. The largest difference does not correspond to a fixed ITD. Hence, in the TFS-AF test, the IPD was held constant rather than the interaural time difference (ITD). Also, for a given value of φ, the ITD increases with decreasing frequency.
Listeners were asked to indicate which of the two intervals contained a sequence of tones that appeared to move within the head. Initially, the IPD was set to a value that led to a clearly lateralised percept. The manipulated variable (IPD for the TFS-LF test and frequency for the TFS-AF test) was adaptively adjusted, using a 2-down, 1-up stepping rule for the TFS-LF test and a 2-up, 1-down rule for the TFS-AF test to estimate the 71%-correct point on the psychometric function (Levitt Citation1971). For the TFS-LF test, the value of the IPD was changed by a factor of 1.95 until the first reversal, then by a factor of 1.56 until the next reversal, and by a factor of 1.25 thereafter. For the TFS-AF test, the corresponding factors were 1.4, 1.2 and 1.1. After eight reversals, the run was terminated and the geometric mean of the values at the last six reversals was taken as the threshold estimate. The software for the TFS-LF test, as developed by Hopkins and Moore (Citation2010), terminates the adaptive procedure when an IPD exceeding the maximum IPD of 180° is called for more than twice during a run. When this happens 40 trials are presented with the IPD fixed at 180° and per cent of correct responses was recorded.
For the TFS-LF test, the test frequencies were 250, 500, and 750 Hz for the young listeners and 750 Hz for the older listeners. The starting value of φ was 180°. The level of presentation in each ear for each test frequency was individually adjusted to 30 dB SL based on the measured audiometric thresholds. For the TFS-AF test, the starting frequency was 200 Hz. This value was chosen based on the observation that all NH listeners tested by Hopkins and Moore (Citation2010, Citation2011) were able to complete the TFS-LF test when a frequency of 250 Hz was used. The fixed values of φ are specified below. The programme implementing the TFS-AF test used the audiometric thresholds at each measured frequency up to 2000 Hz to set the stimulus levels at those frequencies to 30 dB SL. Levels at intermediate frequencies were estimated by linear interpolation (in dB on a logarithmic frequency scale). The level of 30 dB SL was chosen as the lowest SL that would lead to asymptotic performance; Hopkins and Moore (Citation2010) showed that performance on the TFS-LF test improved with increasing level up to 30 dB SL, but then remained approximately constant for higher levels. We have found that the level of 30 dB SL does not lead to uncomfortable loudness for most people with mild-to-moderate hearing loss at low frequencies.
Stimuli were digitally synthesised using a PC and were converted to analogue form using an external RME babyface soundcard with 24-bit resolution and a sampling rate of 48,000 Hz. Stimuli were presented via Sennheiser HD580 headphones. Listeners were seated in a double-walled sound-attenuating booth and entered their responses via mouse clicks on virtual buttons displayed on a monitor.
Experiment 1: Assessment of practice effects for the TFS-AF test in young normal-hearing listeners
Rationale and method
This experiment was conducted to assess the effects of practice for the TFS-AF test. The value of φ was set to 180°. Listeners completed 21 threshold runs distributed over three test sessions, each scheduled on a different day but not more than two days apart from the previous session. On average, testing was completed within 3.7 days. During the first session, the test was administered three times without any prior practice. This was meant to replicate roughly the test conditions and time constraints found during an audiological assessment. During each of the two following sessions, nine threshold runs were obtained with short breaks between test blocks of three threshold runs.
Listeners
Nine young normal-hearing (YNH) listeners (three females) were recruited from students attending the local universities. Their ages ranged from 19 to 25 years, with a mean of 22 years. All listeners had audiometric thresholds ≤20 dB HL for octave audiometric frequencies between 125 and 8000 Hz, as well as at 750 and 1500 Hz, as measured using a Grason–Stadler GSI 61 audiometer and Telephonics TDH50 headphones and following the procedure recommended by the British Society of Audiology [BSA] (Citation2004). Interaural differences were ≤10 dB at all frequencies, with a mean difference of 3.5 dB for frequencies ≤2000 Hz. Prior to participation, listeners provided informed written consent. They were paid an hourly wage for their services.
Results
All listeners were able to complete the test. Since the adaptive procedures used steps that were based on fixed factors rather than fixed arithmetic steps, all means were calculated as geometric means, and statistical analyses were based on the log-transformed data. The upper panel of shows the individual thresholds (thin lines) and the mean across listeners (thick grey line) for each run number. The lower panel shows the mean across blocks of three runs for each listener and the mean across listeners.
Figure 1. Individual (thin lines) and mean (thick grey line) thresholds for the TFS-AF test, using a fixed interaural phase difference (φ) of 180°. The frequency at threshold is plotted for nine YNH listeners for 21 consecutive threshold runs (top panel) distributed over three test sessions. Threshold runs were conducted in blocks of three, separated by breaks. Individual (thin lines) and mean (thick grey line) thresholds for each of the seven test blocks are shown in the bottom panel.
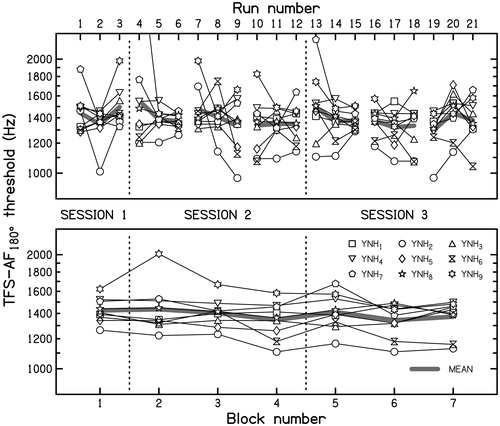
Although there were clear individual differences, with YNH9 performing relatively well and YNH2 performing relatively poorly, all listeners achieved thresholds (averaged across the three runs within a block) that ranged between about 1100 and 1700 Hz. One exception was the mean threshold for the second block for YNH9, which was over 2000 Hz. This was due to one run by this listener that yielded a threshold exceeding 4000 Hz. Since this value probably reflects several lucky guesses rather than a “true” threshold, it was omitted from all inferential analyses. Across all runs, the geometric mean for all listeners was 1382 Hz. This observed upper limit of binaural processing is in very good agreement with previous findings (Hughes Citation1940; Santurette and Dau Citation2012; Brughera, Dunai and Hartmann Citation2013) for trained NH listeners.
Effects of practice were small or absent. A Shapiro-Wilk test showed that the log-transformed data for the last block were not normally distributed. Thus, the log-transformed data were analysed using a non-parametric Friedman test of differences among means for block numbers 1–7. This yielded a Chi-square value of 12.39, which just failed to reach significance (p = 0.054). A linear regression analysis for each listener and the entire group showed that only the slope for YNH2 was significantly different from zero (p ≤ 0.017 without correction for multiple comparisons; two-tailed). However, the slope of the regression line was negative, indicating that thresholds actually decreased (worsened) with practice for this listener, perhaps reflecting fatigue or boredom. Consistent with observations of no practice effects for NH listeners with the TFS1 test (Moore and Sek Citation2009) and the TFS-LF test (Hopkins and Moore Citation2010), our results indicate that binaural TFS sensitivity measured using the TFS-AF test does not improve with practice. Consequently, the TFS-AF test can, in principle, be administered to untrained listeners (such as audiology patients).
Experiment 2: Comparison of results for the TFS-LF and TFS-AF tests in YNH listeners
Rationale
The TFS-LF test provides a measure of sensitivity to binaural TFS at the specific frequencies tested. Where the test has been conducted at two or more frequencies using groups of NH (Moore, Vickers, and Mehta Citation2012; Füllgrabe, Moore, and Stone Citation2015) or HI listeners (Neher et al. Citation2012), the thresholds have shown strong positive correlations across test frequencies, ranging from 0.72 to 0.81. The positive correlations indicate that some listeners perform consistently better or worse than others, across a range of frequencies. This could reflect inter-listener variations in “processing efficiency” (some people are especially good or bad listeners, regardless of the task) or it could reflect a global property of the precision of phase locking and/or binaural processing. The fact that the correlations were not perfect could indicate that there are also idiosyncratic variations in monaural and/or binaural TFS sensitivity across frequency, comparable to the notion of microstructure for audiometric sensitivity (Elliott Citation1958), as already speculated by Füllgrabe et al. (Citation2015) to explain results for the TFS1 test. Alternatively, non-perfect correlations might have occurred because of errors of measurement. The second experiment compared thresholds for the TFS-LF and TFS-AF tests for YNH listeners, to assess the extent to which binaural TFS sensitivity is a global (largely frequency-independent) property of the auditory system for this population of listeners.
A second purpose of experiment 2 was to assess the role of the value of φ in performance on the TFS-AF test. The value of φ used in experiment 1 was 180°. This generally leads to a clear off-centre percept, but the side of the percept is ambiguous because the sound could, in principle, be leading in time at either the right or the left ear. The sound may be heard either to the left or the right, and this can vary idiosyncratically across frequencies and listeners. It is possible that a smaller value of φ, such as 135°, might still lead to a clearly lateralised percept while avoiding ambiguities about the side of lateralisation. This might lead to better and more stable performance of the TFS-AF test. Also, when the frequency is below about 770 Hz, a value of φ of 180° leads to an ITD that is larger than would occur naturally. While humans can use such large ITDs for lateralisation (Mossop and Culling Citation1998), performance does worsen when the ITD is very large. In this experiment, several values of φ close to 180° were used in the TFS-AF test. Even smaller values of φ were also included to explore binaural TFS discrimination over a range of frequencies using the TFS-AF test. If the value of φ is made considerably smaller than the maximum IPD possible, for example 30°, this might make the task harder, decreasing the frequency at threshold. If binaural TFS sensitivity is a global property of the auditory system, then individual variations in performance on the TFS-AF test should be consistent across different values of φ.
Method
Listeners were the same as for experiment 1. Threshold estimates were collected first for the TFS-AF test and then for the TFS-LF test. For the TFS-AF test, values of φ were 30, 45, 60, 90, 135, 165 and 180°. Since listeners were considered as sufficiently trained on the TFS-AF test, only one practice run was provided for each of the six values of φ that had not been used previously. Following practice, and on different days, listeners completed six test blocks, each composed of one threshold run for each of the seven values of φ, presented in random order. Thresholds for the TFS-LF test were obtained in a separate session, following three practice runs using 500-Hz tones. In these practice runs, interaural level differences (ILDs) rather than IPDs were used to manipulate the perceived lateralisation of the sounds. The starting ILD was set to 20 dB and the ILD was adaptively varied using an initial step size of 6 dB. The step size was reduced to 4 dB after one reversal and to 2 dB after two more reversals. ILD-based training was recommended by Hopkins and Moore (Citation2011) since large changes in ILD generally lead to large changes in lateralisation even for older HI listeners. All listeners completed six test blocks, the test frequency (250, 500 or 750 Hz) being fixed within a block. The order of the frequencies was counter-balanced across blocks. Consistent with previous studies using the TFS-LF test (Füllgrabe, Moore, and Stone Citation2015), when the SD of the log values at the last six reversals exceeded 0.2, the estimate was discarded and a new run was conducted. Final estimates of threshold were based on the geometric mean across all valid runs.
Results
The results for the TFS-AF test are plotted in . The TFS-AF threshold is plotted as a function of φ for each YNH listener (thin lines). The thick grey line shows the mean across YNH listeners. Clear individual differences were apparent. The two most extreme cases were YNH4 who performed consistently well, achieving thresholds close to 1500 Hz across all values of φ, and YNH2 who performed consistently more poorly, with thresholds decreasing from about 1000 Hz for φ = 180° to below 300 Hz for φ = 30°. Based on the results for all YNH listeners, thresholds did not vary clearly for values of φ from 135 to 180°. Consistent with this, paired-samples t tests comparing the log-transformed data for φ = 180° with those for φ = 135 and 165° revealed no significant differences (both p ≥ 0.337 without correction for multiple comparisons; two-tailed). For lower values of φ, the frequencies at threshold decreased markedly for YNH2 and YNH6 (the ratio of thresholds for φ = 180 and 30° was 3.8 and 2.3, respectively) but decreased only moderately for the other listeners (the ratios of thresholds for φ = 180 and 30° ranged from 1.1 to 1.5).
Figure 2. Mean individual thresholds (thin lines) and overall mean thresholds for YNH listeners (thick grey line) for the TFS-AF test as a function of the value of φ. The diagonal dashed lines show equal-ITD contours, with the value of the ITD in μs indicated at the top.
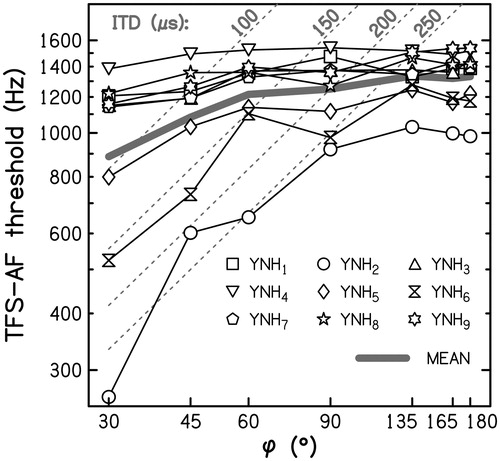
The dashed diagonal lines in show contours of equal ITD in μs. For the two listeners who performed most poorly (YNH2 and YNH6), the thresholds for values of φ below 90° roughly correspond to a constant ITD. However, for the other listeners this is clearly not the case. For these, the ITD at threshold increased markedly with increasing φ. It appears that, for the better-performing listeners, the threshold was almost independent of ITD provided that the value of φ was sufficiently large to be highly detectable for frequencies below the threshold measured in the TFS-AF test.
All listeners were able to complete the adaptive procedure for the TFS-LF test. The results are shown in . The thresholds for each YNH listener (thin lines) are plotted against the test frequency. The thick grey line shows geometric-mean results. As for the TFS-AF test, there were clear individual differences, YNH4 performing well and nearly identically for all three frequencies, and YNH2 performing relatively poorly for all three frequencies, with thresholds increasing markedly for the highest frequency (as was also the case for YNH6). Consistent with previous results for YNH listeners over the same frequency range (Hopkins and Moore Citation2010; Füllgrabe, Moore, and Stone Citation2015), average thresholds worsened with increasing frequency (from 14.8° at 250 Hz to 25.4° at 750 Hz).
Figure 3. Mean individual thresholds (thin lines) and overall mean thresholds for YNH listeners (thick grey line) for the TFS-LF test as a function of the frequency of the pure tones. To facilitate comparison with previous studies, TFS thresholds are expressed in terms of the sensitivity index d′ on the right axis.
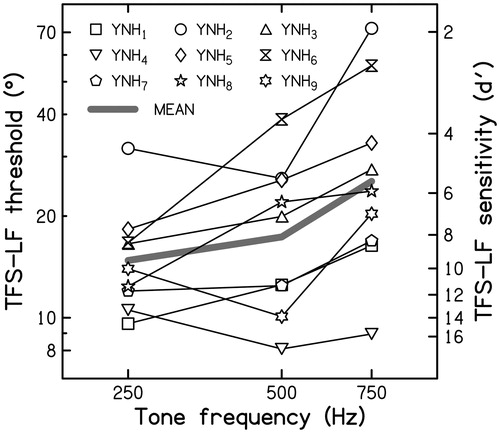
A Shapiro–Wilk test showed that when the data were log-transformed, the distribution of the data did not differ significantly from a normal distribution. Hence, as in previous related studies (Hopkins and Moore Citation2011; Moore, Vickers, and Mehta Citation2012), the threshold estimates were log-transformed prior to statistical analyses. A within-subjects analysis of variance gave a significant main effect of frequency [F(2,16) = 10.803, p = 0.001]. Subsequent paired-samples t tests, uncorrected for multiple comparisons, revealed that thresholds for the two lower frequencies were significantly lower (better) than that at 750 Hz (p = 0.002 and 0.006; two-tailed) but did not differ significantly from each other (p = 0.26; two-tailed). Correlational analyses using Pearson product-moment correlation coefficients indicated that thresholds for the three frequencies were significantly and moderately-to-highly correlated with each other (r250Hz/500Hz = 0.65, p = 0.030; r250Hz/750Hz = 0.87, p = 0.001; r500Hz/750Hz = 0.89, p = 0.001; all one-tailed and uncorrected for multiple comparisons).
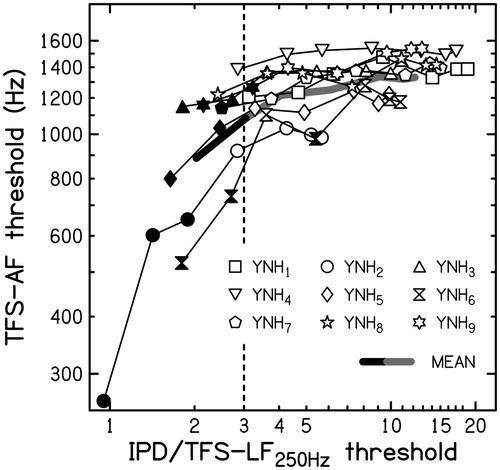
To investigate whether the larger inter-listener variability at low values of φ found for TFS-AF test might be explained by the smallest IPD that a listener could detect for frequencies well below the measured threshold, IPDs for the seven phase conditions used with the TFS-AF test were expressed relative to the TFS-LF thresholds obtained for a frequency of 250 Hz. The thresholds obtained in the TFS-AF task are plotted against these ratios in . Most TFS-AF thresholds were fairly constant for IPDs that were at least three times larger than the listener’s IPD threshold (indicated by the vertical dashed line) but declined (worsened) for ratios of about three and smaller. The filled symbols indicate thresholds that were more than 15% below the threshold for that listener for φ = 180°. These results indicate that, for all YNH listeners, the thresholds measured in the TFS-AF task are almost independent of the IPD used provided that the IPD is more than three times the smallest detectable IPD at low frequencies (250 Hz in this case). Thus, to ensure that the highest possible threshold is measured in the TFS-AF task for all listeners, the value of φ should be reasonably large: 90° or more for the YNH listeners tested here, but possibly larger for older and/or HI listeners.
Figure 4. Mean individual thresholds (thin lines) and overall mean thresholds for YNH listeners (thick black and grey line) for the TFS-AF test as a function of the IPD expressed relative to individual and mean TFS-LF thresholds for 250-Hz tones, respectively (logarithmic scale). Filled symbols indicate TFS-AF thresholds that were more than 15% below that for φ = 180°. The dashed line indicates that the “critical ratio” below which thresholds started to worsen is close to three.
shows correlations across listeners between log-transformed thresholds for the TFS-AF test and log-transformed thresholds for the TFS-LF test. The correlations were all negative, as expected, since good performance is indicated by high thresholds in Hz for the TFS-AF test and low thresholds in degrees for the TFS-LF test. The correlations are mostly rather high, only four out of 21 having an absolute value below 0.7. This indicates a good correspondence between the results for the two tests. For the TFS-AF test with φ = 90-180°, the thresholds were generally between 1000 and 1500 Hz. Remarkably, the thresholds for the TFS-AF test for these values of φ were highly correlated (–0.82 < r < –0.87) with thresholds for the TFS-LF test obtained for the test frequency of 250 Hz; correlations with thresholds for the TFS-LF test were not stronger for the lower than for the higher values of φ in the TFS-AF test. This supports the idea that, among YNH listeners, there are clear individual variations in binaural TFS sensitivity, and these variations are consistent over the frequency range where IPD can be discriminated. It remains unclear whether the variations reflect individual differences in “processing efficiency” or a specific property of phase locking and/or of the binaural system.
Table 1. Pearson product-moment correlation coefficients across the YNH listeners and associated uncorrected significance levels (one-tailed) between the mean thresholds for each of the seven values of φ for the TFS-AF test (rows) and the mean thresholds for each of the three frequencies used for the TFS-LF test (columns).
Experiment 3: TFS-AF thresholds for older normal-hearing listeners who had previously been unable to complete the TFS-LF test
Rationale and method
As described earlier, some older people have difficulty performing the TFS-LF test. To investigate if the TFS-AF test can provide graded measures for such people, listeners from our previous studies (Füllgrabe Citation2013; Füllgrabe, Moore, and Stone Citation2015) who were unable to complete the adaptive procedure on at least one of their TFS-LF runs, using a frequency of 750 or 850 Hz, were contacted and asked to take part in additional tests. Those who agreed first performed two TFS-AF test runs with the IPD set to 180°, and then performed two TFS-LF test runs, with the tone frequency fixed at 750 Hz. The listeners had not had any experience with tests of binaural processing since they had originally been tested using the TFS-LF test.
Listeners
Twenty-three older listeners (20 females) were tested. All had audiometric thresholds in each ear ≤20 dB HL for audiometric frequencies ≤1500 Hz, the range covered by the TFS-AF test. Interaural differences in audiometric threshold were ≤15 dB at all frequencies. These listeners are designated older normal hearing (ONH): twenty-one had ages in the range 65 to 84 years (mean = 74 years; SD = 5) and the other two were aged 47 and 51 years.
Results
All OHN listeners were able to complete the TFS-AF test. Four listeners were able to complete the TFS-LF adaptive procedure for both runs, and six were able to complete it for one run, perhaps as a result of their experience with the TFS-AF test, which helped them to know what to “listen for”. The remainder of the listeners continued to be unable to complete the adaptive TFS-LF test and the procedure automatically switched to a constant-stimulus procedure with the IPD fixed at 180°. shows the average TFS-AF threshold (in Hz) for each listener plotted against his/her average TFS-LF threshold, expressed as the sensitivity index d′ on the bottom axis and equivalent IPDs (in degrees) on the top axis (Hopkins and Moore Citation2010; Füllgrabe, Moore, and Stone Citation2015). Open circles indicate cases where the listeners did not complete the adaptive procedure with the TFS-LF test on either run. These listeners achieved thresholds between 427 and 854 Hz on the TFS-AF test. These findings are consistent with and extend the observation of Moore and Sek (Citation2016) that six of their older HI listeners could not complete the TFS-LF test but were able to complete the TFS-AF test.
Figure 5. Results for ONH listeners, comparing TFS-AF thresholds (ordinate) with scores from the TFS-LF test, shown as IPD thresholds on the top axis and d′ values estimated to occur for an φ = 180° on the bottom axis. Squares and circles show results for middle-aged and older listeners, respectively. Results for listeners who completed the TFS-LF adaptive procedure twice are shown by filled circles. Grey and open symbols show results when the adaptive procedure was not completed and a constant-stimulus procedure was used once or twice, respectively. When a constant-stimulus procedure was used and the scores were not significantly different from chance based on a binomial distribution, the symbols are plotted arbitrarily at d′ = 0.5 or φ = 280°.
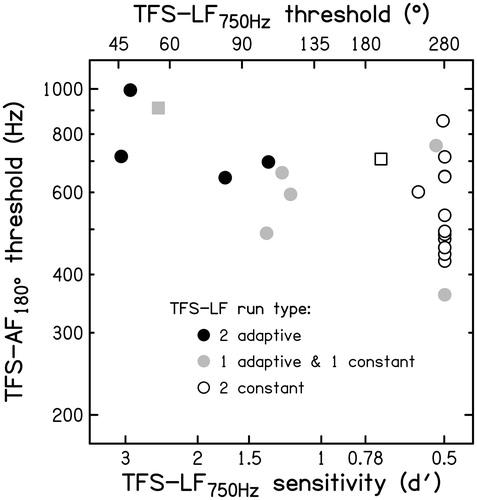
Overall, our results indicate that a graded threshold could be obtained with all of the OHN listeners, even though those listeners were selected because they had difficulty in completing the TFS-LF test.
General discussion
Even though population data are currently lacking, most medium-sized psychophysical studies (Ross et al. Citation2007; Grose and Mamo Citation2010; Moore, et al. Citation2012; Füllgrabe Citation2013; King, Hopkins, and Plack Citation2014; Whitmer, Seeber, and Akeroyd Citation2014; Whiteford and Oxenham Citation2015; Oberfeld and Klöckner-Nowotny Citation2016) indicate that the ability to process monaural and binaural TFS information varies widely across listeners. Several factors, such as age (Pichora-Fuller and Schneider Citation1992; Grose and Mamo Citation2010; Füllgrabe Citation2013; Füllgrabe, Moore, and Stone Citation2015), hearing loss (Hawkins and Wightman Citation1980; King, Hopkins, and Plack Citation2014), and cognitive abilities (Füllgrabe, Moore, and Stone Citation2015) have been identified as independently affecting performance on tasks assessing sensitivity to TFS.
It has been suggested that difficulties in understanding speech in background sounds might be explained at least partially by a reduced ability to process TFS information (Moore Citation2014). Indeed, associations between speech-in-noise identification and TFS sensitivity have been reported (Hopkins and Moore Citation2011; Neher et al. Citation2012), and these occur even when confounding effects of age, hearing loss, and cognition are controlled for (Füllgrabe, Moore, and Stone Citation2015; Oberfeld and Klöckner-Nowotny Citation2016). In addition, it has been argued that sensitivity to TFS information might determine which signal-processing features in hearing aids (such as slow versus fast dynamic range compression) would be more beneficial for a HI listener (Moore Citation2008; Moore and Sek Citation2016).
Taken together, these observations regarding the role and importance of the ability to process TFS information highlight the need for fast and reliable tests of TFS sensitivity that could be used for audiological assessments or the screening of large groups of research participants. The TFS-AF test evaluated here seems to be suitable for this purpose.
When designing the TFS-AF test, the aim was that all listeners should be able to perform the test at a low SL (so that listeners with elevated audiometric thresholds would not experience uncomfortable loudness), the test should take little time to complete, and reliable results should be obtained without protracted training. The TFS-AF test seems to fulfil all of these requirements and thus seems suitable for the rapid screening of sensitivity to binaural TFS information: (1) All of the naïve young, middle-aged and older listeners tested in this study were able to complete the test at an SL of 30 dB without prior practice; (2) On average, the time to complete one run of the TFS-AF test, as measured with a starting frequency of 200 Hz for four young NH listeners with a mean threshold of 1360 Hz, was five minutes. Assuming that two or three threshold estimates are necessary for each listener, the assessment of binaural TFS sensitivity using the TFS-AF test requires 10–15 min; (3) There was no significant effect of practice for the YNH listeners beyond the first three threshold estimates; (4) ONH listeners selected because they were unable to complete the TFS-LF test in previous studies were all able to complete the TFS-AF test.
Despite these promising properties of the TFS-AF test, several questions regarding the TFS-AF test are still unanswered. First, the design of the TFS-AF test is based on the assumption that, for each listener, IPD discrimination is possible at low frequencies, but there is a frequency above which IPD discrimination worsens and eventually becomes impossible. It is conceivable that, for a person with a low-frequency hearing loss, there might be a frequency range over which IPD discrimination worsened with decreasing frequency. In such a case, the adaptive procedure would not “track” properly; an incorrect response would lead to the frequency being decreased, moving the frequency further into the region of poor discrimination. Hence, caution may be needed when using the TFS-AF test for listeners with low-frequency hearing loss. Second, it is not completely clear what is the “best” fixed value of φ to use. It is possible that a value below those yielding the highest (best) thresholds (e.g. 45°) might be more effective in predicting speech-in-noise identification in the presence of spatially distributed interfering sounds than a large value (e.g. 90 or 180°), in which case the smaller value might be preferable for routine use. However, such a small value might prevent some listeners from performing the task reliably. At present, a large value of φ, such as 180°, appears to be preferable. Third, it is not clear whether the reliable threshold estimates and the lack of practice effects found here would also be found for listeners more representative of the average audiology patient in terms of age, hearing status and cognitive abilities. Further work is warranted to establish whether the TFS-AF is also suitable for HI listeners and to assess practice effects on this test for other groups of listeners than YNH adults with high cognitive function.
Finally, some general limitations associated with binaural tests of TFS sensitivity remain. By design, measures of the ability to compare TFS information across the two ears do not provide a direct estimate of monaural TFS sensitivity for each ear. While monaural TFS sensitivity may limit performance in binaural tasks, additional central factors probably influence binaural TFS sensitivity. Consistent with this, monaural and binaural TFS sensitivity are correlated, but not highly (Hopkins and Moore Citation2011; Moore, Vickers, and Mehta Citation2012; Füllgrabe, Moore, and Stone Citation2015). Consequently, tests of binaural TFS sensitivity should probably be used in combination with tests of monaural TFS sensitivity which, however, are not without their own shortcomings.
Conclusions
The TFS-AF test could be performed at the low SL of 30 dB by all YNH listeners and by ONH listeners selected for having difficulty performing the TFS-LF test. A short administration time and the absence of practice effects (demonstrated so far only for the YNH listeners) make the TFS-AF test a suitable candidate for the rapid assessment of binaural TFS sensitivity. Based on the currently available evidence, a fixed IPD of 180° is recommended because (i) slightly smaller values of φ did not yield better thresholds, and (ii) in most cases, performance will not be limited by the listener’s smallest detectable IPD. The TFS-AF test can be run on any PC with a good-quality sound card and no specialist equipment is required. The test can be downloaded free from the following webpage: http://hearing.psychol.cam.ac.uk/.
| Abbreviations | ||
| 2I, 2AFC | = | Two-interval, two-alternative forced-choice |
| HI | = | Hearing-impaired |
| HL | = | Hearing level |
| IPD | = | Interaural phase difference |
| ITD | = | Interaural time difference |
| ONH | = | Older normal hearing |
| NH | = | Normal hearing |
| SD | = | Standard deviation |
| SL | = | Sensation level |
| TE | = | Temporal envelope |
| TFS | = | Temporal fine structure |
| TFS1 | = | Test of monaural TFS sensitivity |
| TFS-AF | = | Test of binaural TFS sensitivity using changing frequency |
| TFS-LF | = | Test of binaural TFS sensitivity using changing IPD |
| YNH | = | Young normal hearing |
Declaration of interest: No potential conflict of interest was reported by the authors.
Acknowledgements
We thank Dr. Oliver Zobay for statistical advice and Dr. Daniel Oberfeld-Twistel for helpful discussions. We also thank four reviewers for helpful comments.
Funding
This work was supported by the Medical Research Council [grant number U135097130] and the Rosetrees Trust.
Additional information
Funding
References
- Brughera, A., L. Dunai, and W. M. Hartmann. 2013. “Human Interaural Time Difference Thresholds for Sine Tones: The High-frequency Limit.” Journal of the Acoustical Society of America 133: 2839–2855.
- BSA. 2004. Pure Tone Air and Bone Conduction Threshold Audiometry with and without Masking and Determination of Uncomfortable Loudness Levels. Reading: British Society of Audiology.
- Drullman, R., J. M. Festen, and R. Plomp. 1994. “Effect of Temporal Envelope Smearing on Speech Reception.” Journal of the Acoustical Society of America 95: 1053–1064.
- Dudley, H. 1939. “Remaking speech.” Journal of the Acoustical Society of America 11: 169–177.
- Elliott, E. 1958. “A ripple effect in the audiogram.” Nature 181: 1076.
- Freyman, R. L., A. M. Griffin, and A. J. Oxenham. 2012. “Intelligibility of Whispered Speech in Stationary and Modulated Noise Maskers.” Journal of the Acoustical Society of America 132: 2514–2523.
- Füllgrabe, C. 2013. “Age-dependent Changes in Temporal-fine-structure Processing in the Absence of Peripheral Hearing Loss.” American Journal of Audiology 22: 313–315.
- Füllgrabe, C., and B. C. J. Moore. 2012. “Objective and Subjective Measures of Pure-tone Stream Segregation Based on Interaural Time Differences.” Hearing Research 291: 24–33.
- Füllgrabe, C., and B. C. J. Moore. 2014. “Effects of Age and Hearing Loss on Stream Segregation Based on Interaural Time Differences.” Journal of the Acoustical Society of America 136: EL185–1EL191.
- Füllgrabe, C., B. C. J. Moore, and M. A. Stone. 2015. “Age-group Differences in Speech Identification Despite Matched Audiometrically Normal Hearing: Contributions from Auditory Temporal Processing and Cognition.” Frontiers in Aging Neuroscience 6: 347.
- Füllgrabe, C., M. A. Stone, and B. C. J. Moore. 2009. “Contribution of Very Low Amplitude-modulation Rates to Intelligibility in a Competing-speech Task.” Journal of the Acoustical Society of America 125: 1277–1280.
- Grose, J. H., and S. K. Mamo. 2010. “Processing of Temporal Fine Structure as a Function of Age.” Ear and Hearing 31: 755–760.
- Hawkins, D. B., and F. L. Wightman.1980. “Interaural Time Discrimination ability of Listeners with Sensorineural Hearing Loss .”Audiology 19: 495–507.
- Hopkins, K., and B. C. J. Moore. 2007. “Moderate Cochlear Hearing Loss Leads to a Reduced Ability to Use Temporal Fine Structure Information.” Journal of the Acoustical Society of America 122: 1055–1068.
- Hopkins, K., and B. C. J. Moore. 2010. “Development of a Fast Method for Measuring Sensitivity to Temporal Fine Structure Information at Low Frequencies.”International Journal of Audiology 49: 940–946.
- Hopkins, K., and B. C. J. Moore. 2011. “The Effects of Age and Cochlear Hearing Loss on Temporal Fine Structure Sensitivity, Frequency Selectivity, and Speech Reception in Noise.” Journal of the Acoustical Society of America 130: 334–349.
- Hughes, J. 1940. “The upper frequency limit for the binaural localization of a pure tone by phase difference.” Proceedings of Royal Society of London B: Biological Science 128: 293–305.
- Jackson, H. M., and B. C. J. Moore. 2014. “The Role of Excitation-pattern and Temporal-fine-structure Cues in the Discrimination of Harmonic and Frequency-shifted Complex Tones.” Journal of the Acoustical Society of America 135: 1356–1570.
- King, A., K. Hopkins, and C. J. Plack. 2014. “The Effects of Age and Hearing Loss on Interaural Phase Difference Discrimination.” Journal of the Acoustical Society of America 135: 342–351.
- Kohlrausch, A., R. Fassel, and T. Dau. 2000. “The Influence of Carrier Level and Frequency on Modulation and Beat-detection Thresholds for Sinusoidal Carriers.” Journal of the Acoustical Society of America 108: 723–734.
- Launer, S., J. A. Zakis, and B. C. J. Moore. 2016. “Hearing Aid Signal Processing.” In Hearing Aids, edited by G.R. Popelka, B.C.J. Moore, A.N. Popper, and R.R. Fay, 93–130. New York: Springer.
- Levitt, H. 1971. “Transformed Up-down Methods in Psychoacoustics.” Journal of the Acoustical Society of America 49: 467–477.
- Lorenzi, C., and B. C. J. Moore. 2008. “Role of Temporal Envelope and Fine Structure Cues in Speech Perception: A Review.” In: Auditory Signal Processing in Hearing-Impaired Listeners 1st International Symposium on Auditory and Audiological Research (ISAAR 2007), edited by T. Dau, J.M. Buchholz, J.M. Harte and T.U. Christiansen, 263–272. Denmark: Centertryk A/S.
- Marmel, F., C. J. Plack, K. Hopkins, R. P. Carlyon, H. E. Gockel, and B. C. J. Moore. 2015. “The Role of Excitation-pattern Cues in the Detection of Frequency Shifts in Bandpass-filtered Complex Tones.” Journal of the Acoustical Society of America 137: 2687–2697.
- Micheyl, C., P. R. Schrater, and A. J. Oxenham. 2013. “Auditory Frequency and Intensity Discrimination Explained Using a Cortical Population Rate Code.” PLoS Computational Biology 9: e1003336.
- Moore, B. C. J. 2008. “The Choice of Compression Speed in Hearing Aids: Theoretical and Practical Considerations, and the Role of Individual Differences.” Trends in Amplification 12: 103–112.
- Moore, B. C. J. 2014. Auditory Processing of Temporal Fine Structure: Effects of Age and Hearing Loss. Singapore: World Scientific.
- Moore, B. C. J., B. R. Glasberg, M. Stoev, C. Füllgrabe, and K. Hopkins. 2012. “The Influence of age and High-frequency Hearing Loss on Sensitivity to Temporal Fine Structure at Low Frequencies (L).” Journal of the Acoustical Society of America 131: 1003–1006.
- Moore, B. C. J., and A. Sek. 2009. “Development of a Fast Method for Determining Sensitivity to Temporal Fine Structure.” International Journal of Audiology 48: 161–171.
- Moore, B. C. J., and A. Sek. 2011. “Effect of Level on the Discrimination of Harmonic and Frequency-shifted Complex Tones At High Frequencies.” Journal of the Acoustical Society of America 129: 3206–3212.
- Moore, B. C. J., and A. P. Sek. 2016. “Preferred Compression Speed for Speech and Music and its Relationship to Sensitivity to Temporal Fine Structure.” Trends in Hearing 20: 1–15.
- Moore, B. C. J., D. A. Vickers, and A. Mehta. 2012. “The Effects of Age on Temporal Fine Structure Sensitivity in Monaural and Binaural Conditions.” International Journal of Audiology 51: 715–721.
- Mossop, J. E., and J. F. Culling. 1998. “Lateralization of Large Interaural Delays.” Journal of the Acoustical Society of America 104: 1574–1579.
- Neher, T., S. Laugesen, N. S. Jensen, and L. Kragelund. 2011. “Can Basic Auditory and Cognitive Measures Predict Hearing-impaired Listeners’ Localization and Spatial Speech Recognition Abilities?” Journal of the Acoustical Society of America 130: 1542–1558.
- Neher, T., T. Lunner, K. Hopkins, and B. C. J. Moore. 2012. “Binaural Temporal Fine Structure Sensitivity, Cognitive Function, and Spatial Speech Recognition of Hearing-impaired Listeners (L).” Journal of the Acoustical Society of America 131: 2561–2564.
- Oberfeld, D., and F. Klöckner-Nowotny. 2016. “Individual differences in selective attention predict speech identification at a cocktail party.”Elife 5, e16747.
- Oxenham, A. J., C. Micheyl, and M. V. Keebler. 2009. “Can Temporal Fine structure Represent the Fundamental Frequency of Unresolved Harmonics?” Journal of the Acoustical Society of America 125: 2189–2199.
- Oxenham, A. J., and A. M. Simonson. 2009. “Masking Release for Low- and High-pass-filtered Speech in the Presence of Noise and Single-talker Interference.” Journal of the Acoustical Society of America 125: 457–468.
- Pichora-Fuller, M. K., and B. A. Schneider. 1992. “The effect of Interaural Delay of the Masker on Masking-level Differences In Young and Old Adults.” Journal of the Acoustical Society of America 91: 2129–2135.
- Plack, C. J., and A. J. Oxenham. 2005. The Psychophysics of Pitch. In: Pitch Perception, edited by C.J. Plack, A.J. Oxenham, R.R. Fay & A.N. Popper, 7–55. New York: Springer.
- Rayleigh, L. 1907. “On Our Perception of Sound Direction.” Philosophical Magazine 13: 214–232.
- Ross, B., T. Fujioka, K. L. Tremblay, and T. W. Picton. 2007. “Aging in Binaural Hearing Begins in Mid-life: Evidence from Cortical Auditory-evoked Responses to Changes in Interaural Phase.” Journal of Neuroscience 27: 11172–11178.
- Santurette, S., and T. Dau. 2012. “Relating binaural pitch perception to the individual listener's auditory profile.” Journal of the Acoustical Society of America 131: 2968–2986.
- Shannon, R. V., F.-G. Zeng, V. Kamath, J. Wygonski, and M. Ekelid. 1995. “Speech Recognition with Primarily Temporal Cues.”Science (New York, N.Y.) 270: 303–304.
- Steinberg, J. C., and M. B. Gardner. 1937. “The Dependence of Hearing Impairment on Sound Intensity.” Journal of the Acoustical Society of America 9: 11–23.
- Stone, M. A., C. Füllgrabe, and B. C. J. Moore. 2009. “High-rate Envelope Information in Many Channels Provides Resistance to Reduction of Speech Intelligibility Produced by Multi-channel Fast-acting Compression.” Journal of the Acoustical Society of America 126: 2155–2158.
- Stone, M. A., C. Füllgrabe, and B. C. J. Moore. 2010. “Relative Contribution to Speech Intelligibility of Different Envelope Modulation Rates Within the Speech Dynamic Range.” Journal of the Acoustical Society of America 128: 2127–2137.
- Verschooten, E., and P. X. Joris. 2014. “Estimation of Neural Phase Locking from Stimulus-evoked Potentials.” Journal of the Association for Research in Otolaryngology 15: 767–787.
- Whiteford, K. L., and A. J. Oxenham. 2015. “Using Individual Differences to test the Role of Temporal and Place Cues in Coding Frequency Modulation.” Journal of the Acoustical Society of America 138: 3093–3104.
- Whitmer, W. M., B. U. Seeber, and M. A. Akeroyd. 2014. “The Perception of Apparent Auditory Source Width in Hearing-impaired Adults.” Journal of the Acoustical Society of America 135: 3548–3559.
- Xu, L., and B. E. Pfingst. 2003. “Relative Importance of Temporal Envelope and Fine Structure in Lexical-tone Perception.” Journal of the Acoustical Society of America 114: 3024–3027.