
Abstract
Objective: To test the channel discrimination of cochlear implant (CI) users along all contacts of the electrode array and assess whether this is related to speech perception.
Design: CI recipients were tested with a custom-made channel discrimination test. They were asked to distinguish a target stimulus from two reference stimuli in a three-alternative forced choice (3AFC) task. The target stimulus was evoked using current steering, with current steering coefficients (α) of 1, 0.5 and 0.25. The test provided a discrimination score (Dα) for each electrode contact along the array.
Study sample: Thirty adults implanted with a CI from Advanced Bionics.
Results: Large variations in Dα scores were observed, both across the electrode array and between subjects. Statistical analysis revealed a significant channel-to-channel variability in Dα score (p < 0.01). Further, there was a significant relationship between subjects’ Dα scores and their speech perception in quiet (p < 0.001).
Conclusions: The large variations in Dα score emphasise the importance of testing pitch discrimination across the complete electrode array. The relationship between Dα score and speech perception indicates that pitch discrimination might be a contributing factor to the performance of individual implant users.
Introduction
The electrode array of cochlear implants (CIs) is located along the basilar membrane and takes advantage of the tonotopic organisation of the cochlea to evoke different pitches. Contemporary electrode arrays contain 12–22 contacts, which ideally activate restricted and distinct areas of the auditory nerve. In practice, however, the excitation area of adjacent electrode contacts do overlap, leading to a reduced number of discriminable pitches and limited efficacy of the CI (Shannon, Fu, and Galvin Citation2004; Zeng Citation2004; Snel-Bongers et al. Citation2012; Jones et al. Citation2013). Previous research showed that there was no improvement in speech recognition as the number of active electrodes increased beyond eight (Friesen et al. Citation2001; Frijns et al. Citation2003; Shannon, Fu, and Galvin Citation2004). This suggests that CI listeners are not able to take full advantage of the spectral information provided.
Several studies investigated whether the speech perception of CI users depends on their ability to distinguish pitches evoked by the different channels. Note that pitch perception is influenced by place of excitation as well as by stimulus rate. This article focuses on place-pitch only, and the term pitch will refer to place-pitch throughout this article. Subject’s ability to perceive pitch is commonly assessed by using pitch ranking. In a pitch ranking task, the subject is typically asked to judge which of the stimulating electrode contacts has a higher pitch. Several studies based on pitch ranking tasks showed a positive relationship between the ability to distinguish pitches and speech perception (Nelson et al. Citation1995; Collins, Zwolan, and Wakefield Citation1997). Furthermore, Kenway et al. (Citation2015) found that pitch ranking ability is an independent predictor of overall CI outcome. However, pitch ranking is difficult to accomplish for some CI users. Judging pitch as higher or lower is a challenge for individuals who have a hard time recalling what higher or lower pitch means.
Alternatively, channel discrimination can be tested using three-alternative forced choice (3AFC) tasks. In a 3AFC task, subjects indicate which of three stimuli sound different from the rest, which is easier to perform than pitch ranking. Recent 3AFC discrimination tasks use virtual channels next to the physical channels to estimate the discrimination ability more precisely. These virtual channels are created by simultaneously stimulating two adjacent physical contacts with different relative weighting of current, creating an intermediate pitch (Firszt et al. Citation2007; Frijns et al. Citation2009). While conducting the 3AFC discrimination task with virtual channels, Snel-Bongers et al. (Citation2012) found that the mean pitch discrimination correlates negatively with speech perception scores; smaller just noticeable differences (JND) in pitch correspond with higher monosyllabic phoneme scores.
A disadvantage of the pitch discrimination tests encountered in the current literature, however, is that they are time-consuming. Consequently, the discrimination tasks were performed on only a limited number of electrode contacts; for example, those in three cochlear regions. The estimated JNDs on these few electrode contacts were then used to estimate the total amount of discriminable pitches along the whole electrode array. Doing this, some studies reported that CI users on average could hear 93 (Koch et al. Citation2007), 64 (Firszt et al. Citation2007) or 20 (Snel-Bongers et al. Citation2012) spectral channels. The interpretation of these results, however, is complicated by the fact that channel interaction varies across the electrode array (Jones et al. Citation2013). It is known that across-electrode differences in other psychophysical measures, e.g. detection thresholds, have a negative effect on speech understanding (Pfingst, Xu, and Thompson Citation2004; Pfingst and Xu Citation2004; Bierer Citation2007; Long et al. Citation2014). Therefore, we propose that it is valuable to examine pitch discrimination across the entire electrode array rather than at only a few electrode contacts.
From a clinical perspective, there might also be interest in testing channel discrimination at individual electrode contacts. Potentially, it can help clinicians to optimise the CI fitting, e.g. to deactivate ineffective electrode contacts. Furthermore, it has been shown that subjects’ speech perception is related to their pitch discrimination ability (Snel-Bongers et al. Citation2012; Goehring et al. Citation2014). In these studies, however, the discrimination scores (Dαs) were obtained at a few electrode contacts only. To further evaluate pitch discrimination of CI users, we developed a tool to test channel discrimination along the whole electrode array, rather than at a few contacts. Doing this with an adaptive procedure is time-consuming. Therefore, we tested pitch discrimination at predefined inter-channel distances (ICDs) of 1.0, 0.5 and 0.25 electrode contacts in order to save time. To distinguish our metric of channel discrimination from the JND of α (JNDα), as is commonly used in literature (Snel-Bongers et al. Citation2012; Shannon Citation1983), we called our metric Dα. This article shows the first results of conducting our channel discrimination test in 30 CI users. Additionally, we examined whether the found Dαs are related to subjects’ speech perception.
Materials and methods
Subjects
Channel discrimination was tested in 30 adults implanted with a CI from Advanced Bionics (Sylmar, CA). All electrode arrays contained 16 electrode contacts, which are numbered from 1 to 16 (apex to base). shows the subject demographics. The reported strategy is each subject’s everyday life speech processing programme and the next column shows which contacts are not active in their programme. The centre frequencies allocated to the active electrode contacts were approximately evenly spaced on a logarithmic frequency scale from 333 to 6665 Hz. All subjects were unilateral CI users, except S0408 who was implanted bilaterally. Subjects were randomly recruited from adult CI users who had at least 6 months of experience with their implant and an annual appointment at the audiology department of the Leiden University Medical Centre, the Netherlands, in the period from October 2015 to June 2016. One subject (S0419) was excluded from further analysis due to high impedance variations across the electrode contacts. Consequently, the loudness could not be optimally balanced across the electrode array, as explained in the next section. Two additional subjects (S0426 and S0429) were excluded because they were previously diagnosed with cognitive impairment and did not understand the test procedure.
Table 1. Subject demographics.
Channel-discrimination test
The channel-discrimination experiment was custom-made using MATLAB (Mathworks, Inc., Natick, MA) and the Advanced Bionics’ research tool, Bionic Ear Data Collection System (BEDCS). The test was based on current steering, which involves simultaneous delivery of current to adjacent electrode contacts (Townshend et al. Citation1987; Donaldson, Kreft, and Litvak Citation2005; Firszt et al. Citation2007). The locus of stimulation can be steered to sites between two physical contacts by varying the proportion of current delivered to each contact. The proportion of the total current directed to the basal contact of the contact pair was denoted as α, and the proportion to the apical contact as (1 − α). Consequently, α represents the distance between the spectral channels expressed in electrode contacts. Two stimuli were used; a probe stimulus based on current steering and a reference stimulus using a physical contact. These stimuli consisted of pulse trains of monopolar, symmetric biphasic pulses with phase durations of 32 µs. We used a pulse-rate of 1400 pulses per second, which is sufficiently high to avoid place-pitch and rate-pitch confusions (Shannon Citation1983; Townshend et al. Citation1987; McKay, McDermott, and Carlyon Citation2000; Zeng Citation2002). The total duration of both stimuli was 300 ms and the pause between stimuli was 500 ms.
First, electrode impedances were obtained to assess the devices’ compliance limits. Next, for all electrode contacts, the most comfortable level (MCL) was determined in linear clinical units (CU) with the use of an eight-point loudness scale (Potts et al. Citation2007). In this ascending loudness experiment, level 1 corresponds to the hearing threshold, level 5 with MCL and level 8 with the highest acceptable loudness. To determine MCL, we started at a low level and increased the stimulus level with a step size of 5 CU until MCL was reached. If the stimulus level tended to exceed the compliance level, the phase duration was automatically increased by 10.8 µs to increase the charge according to the following formula: CU = pulse width (µs) x amplitude (µA)/78.7. The number 78.7 is a correction factor without units, which is provided by the manufacturer. Afterwards, the MCL of each contact was subjectively balanced with the apically adjacent electrode contact.
The discrimination test itself was performed using the 3AFC paradigm, whereby the stimuli were presented in random order. The stimuli were accompanied by three different buttons displayed on a computer screen, which flashed simultaneously with the presented stimulus. The subjects were asked to indicate which stimulus was different in pitch, without receiving feedback about the correct answer. To avoid confounding effects from potential loudness cues, a level roving of ±10% relative to MCL level was applied to each stimulus. When applying level roving, one should be aware that even small level differences in the stimulus level could have a substantial effect on pitch judgments (Shannon Citation1983). The level roving of 10% applied in this study was considered to be moderate.
Prior to the actual discrimination test, a familiarisation task was conducted with an ICD of two physical electrode contacts. The example was performed on five different electrode pairs across the electrode array. After verifying that the experiment was clear to the subject, the real experiment was started with α = 1. The test started at electrode 1 (apex) and all electrode pairs along the electrode array were tested consecutively. In this way, all electrode contacts were tested five times. Because 3-AFC tests have a chance probability of 33.3, 66.6% of the answers must be correct to statistically prove a true detection rate of more than 50% (Lawless Citation2010). Thus, based on five repetitions, we assumed that the electrode pair could be discriminated when four or five correct answers were given. In that case, we continued to a more difficult level by halving the tested α. If the number of correct answers was three or less, the electrode pair was not examined further. Following this approach, ICDs of 1, 0.5 and 0.25 were tested. The smallest α at which the probe and reference stimuli were discriminated correctly was set as the Dα for the reference contact. If the subject could not discriminate α = 1, the Dα score was set to “>1”.
Speech perception
The speech perception scores used in this study originated from the standard Dutch monosyllabic word test routinely measured at our centre. The test consisted of consonant-vowel-consonant (CVC) words (Bosman and Smoorenburg Citation1995) and was conducted in the free field using 48 items. For the bilaterally implanted subject (S0408), only speech scores obtained with both CIs were available. Consequently, subject S0408 was excluded from the analyses that involved CVC scores. All other subjects had no contralateral hearing that could have contributed to the speech score. Percent-correct phoneme score was used as a measure of speech perception. We used CVC scores obtained at the 1-year follow-up, because after that period the CVC scores are stabilised (Snel-Bongers et al. Citation2018). If these scores were not available, the scores at 2-year follow-up (S0423 and S0425) or at 6-months follow-up (S0426) were included. The scores were obtained with speech in quiet at 65 and 75 dB SPL and with speech (65 dB SPL) in speech-shaped noises at signal-to-noise ratios (SNR) of +10, +5 dB. The speech in noise tests was performed by only those patients that had a score above 50% for the speech in quiet test at 65 dB SPL. The condition speech-in-noise +5 dB SNR was not tested when the phoneme score in the +10 dB SNR condition decreased below 50%.
Data analysis
Heterogeneity of the Dα score across the electrode array was analysed using a mixed-effects ordinal regression model (Agresti Citation2002). The model contains a random intercept per subject and the position within the electrode array, either as “electrode contact number” or “electrode region”, both being treated as categorical variables. Electrode region was defined as apex, contact 1–5; middle, contact 6–10 and base, contact 11–16. p values were computed using a likelihood ratio test comparing the full model (including position within the array) to a model without position (containing both a fixed and random intercept). The variations in Dα across the electrode array were illustrated using a segmented bar graph ().
The effect of speech perception on channel discrimination in CI users was also tested using an ordinal mixed model. The model included the variables electrode region and speech perception. To account for clustering due to multiple measurements per individual, the model had a random intercept per subject. p values were calculated using a likelihood ratio test for comparing a model with, and without the speech perception score. All statistical analyses were conducted using R version 3.5.0 with the ordinal package for regression analyses. The relationship between Dα score and speech perception is visualised in . In this figure, subjects’ Dα scores are plotted as function of their CVC scores using boxplots. Additionally, the strength and direction of the relationship were assessed using Spearman’s rank correlation coefficient (rs), which is applicable for ordinal data.
Results
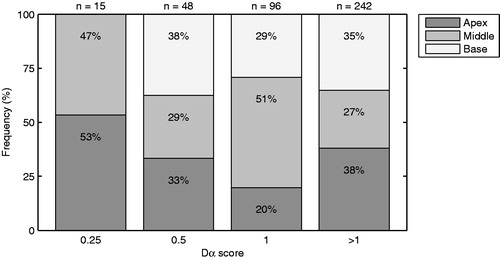
shows an overview of the Dα scores determined in the 27 subjects that completed the channel discrimination task. Large differences in Dα score were found between subjects (e.g. S0402 versus S0403) as well as within subjects (e.g. S0413 and S0427). Noteworthy is that, except for subject S0403, none of the patients could distinguish all the physical electrode pairs. The channel-to-channel variations in Dα score were further analysed using a heterogeneity test. The variations in Dα score were significant, both across electrode contacts (p < 0.01) and across electrode region (p < 0.01). In addition, illustrates how often each Dα score occurs in the apical, middle and basal region of the electrode array. The Dα scores were distributed non-uniformly over the three regions, and the Dα score 0.25 even does not occur in the basal region of the electrode array.
Figure 1. Overview showing the Dα scores (y-axis) across the electrode contacts (x-axis) for all subjects. On top of each plot subject’s name and CVC score at 65 dB speech in quiet are shown. The CVC scores for subject S0408 and S0416 were unknown.
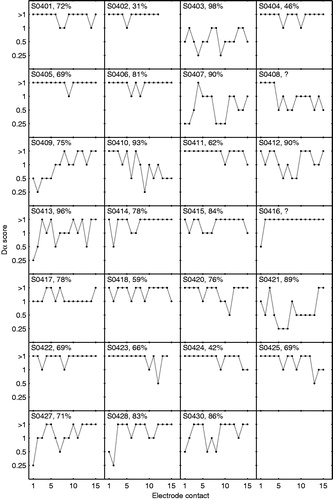
Figure 2. Figure showing the distribution of Dα scores across three regions of the electrode array. The apical region (dark grey) corresponds with electrode contact 1–5, the middle region (grey) with contact 6–10 and the basal region (light grey) with contact 11–15. On top of each column, the total number of Dα scores is shown.
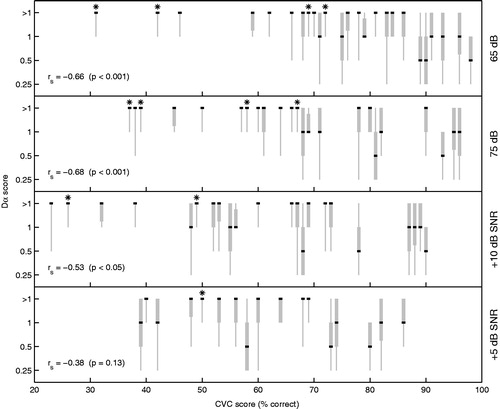
We also examined whether the Dα score is related to the speech perception of the CI user. The ordinal regression model revealed a significant effect of CVC score on Dα score for speech perception in quiet at 65 dB (p < 0.001) and 75 dB (p < 0.001). Concerning speech perception in noise, the effect was also significant for the +10 dB SNR condition (p < 0.01), but not for the +5 dB SNR condition (p = 0.10). In , subjects’ Dα scores are plotted as function of their CVC scores using boxplots. Note that, if multiple subjects have equal CVC scores, these CVC scores have been varied by ±1% to increase visibility. The boxplots display the range of Dα scores (grey vertical line), the median (black horizontal line) as well as the spread around the median based on the 25 and 75% quartiles (grey box). The different panels represent the four listening conditions, as depicted on the right side of each plot. Spearman’s correlation coefficients (rs), as calculated using the median values, indicate that the relationship between Dα scores and CVC scores is negative; higher CVC scores are correlated with lower Dα scores. The correlation is significant for the conditions 65 dB (p < 0.001), 75 dB (p < 0.001) and +10 dB SNR (p < 0.05), which is in line with the results of the ordinal regression model. The results of the four prelingually deafened CI users are marked with the asterisk. These subjects generally have lower CVC scores and worse Dα scores than post-lingually deafened subjects.
Figure 3. Boxplots showing the Dα scores across the electrode array (y-axis) as function of subject’s CVC score (x-axis). The grey vertical line shows the range from the Dα scores and the box represents the interquartile range (25–75%). The black line indicates the median. Spearman’s rank correlation (rs) was based on the median values. CVC scores were obtained in four different test conditions, resulting in one plot per condition (65 dB, 75 dB, +10 dB SNR and +5 dB SNR). Results from prelingually deafened CI users were marked with an asterisk to distinguish them from the postlinguals.
Discussion
This article shows the first results of testing channel discrimination along all contacts of the electrode array. We developed a tool that assessed subject’s ability to discriminate spectral channels using predefined ICDs of 1.0, 0.5 and 0.25 electrode contacts. In the literature, channel discrimination has been tested only at a limited number of sites along the electrode array using an adaptive procedure (Koch et al. Citation2007; Firszt et al. Citation2007; Goehring et al. Citation2014). In these studies, different measures for discrimination ability were used. Converted to JND of α, JNDαs of 0.14 (Koch et al. Citation2007), 0.21 (Firszt et al. Citation2007) and 0.71 (Goehring et al. Citation2014) were found on average across the electrode array. Compared to these JNDαs, our median Dα scores were higher (see ). Considering the experimental designs, it is difficult to quantify differences in pitch discrimination scores across studies. For example, Koch et al. (Citation2007) and Firszt et al. (Citation2007) did not use loudness roving in their pitch ranking experiments. This could have led to a loudness cue and, therefore, an overestimation of the real ability to distinguish pitches. Furthermore, Goehring et al. (Citation2014) found a mean JNDα of 0.69, 0.68 and 0.75 for the basal, middle and apical regions, respectively. However, subjects who were unable to distinguish two adjacent physical electrodes (i.e. ICD was >1.0) were excluded from this analysis, leading to an overestimation of overall performance. In contrast, we included the “Dα > 1” scores in the results as well, consequently leading to higher Dαs.
A benefit of our test procedure is that it provides insight in channel discrimination ability along the whole electrode array. The results show that the Dα scores vary largely from channel-to-channel as well as between subjects (). The variations in Dα score were significant, both across electrode contact and electrode region. These results indicate the importance of testing all electrode contacts when studying electrode discrimination in CI users. Regarding clinical applicability, a detailed picture of subject’s discrimination ability could potentially help clinicians to optimise the fitting procedures, e.g. to deactivate ineffective electrode contacts.
The frequently observed “Dα > 1” indicates that testing ICDs above 1 should be included in future discrimination experiments. Testing ICDs above 1 will result in better estimates of the actual channel discrimination, especially for CI users who are poor performers (e.g. S0402; S0405 and S0416). Further, it will gain more insight in the channel-to-channel variability in Dα scores. Latter aspect would also be worthwhile for studying the effect of intra-cochlear position of the electrode array on the Dα scores. DeBruyne et al. (Citation2017) found that basally located contacts have worse discrimination than more apically located contacts, and de Miguel et al. (Citation2018) found that the Nucleus CI532 has a more perimodiolar placement, and that this placement is related to a better electrode discrimination. Unfortunately, due to the large number of “Dα > 1” scores, we think that current data do not allow further analyses on factors causing the across-site variations in Dα. However, in a follow-up study, the effect of intra-cochlear position of the electrode array on the Dα scores will be considered.
We also assessed whether the Dα scores were related to subjects’ speech perception. We found a significant relationship between subjects’ median Dα scores and their CVC scores. The reported correlation coefficients can be interpreted as being strong for the 65 and 75 dB speech in quiet conditions, and as being moderate and weak for the +10 and +5 dB speech in noise conditions, respectively. Goehring et al. (Citation2014) also investigated the relationship between mean electrode discrimination and speech scores (sentences in quiet) and found comparable results as we found. Note that, to achieve this result, they had to include “α > 1” (meaning that no exact score was obtained) in the analysis as well. Due to the random subject selection, we also included four patients who were prelingually deaf. As expected, these subjects generally had worse CVC and Dα scores than post-lingually deafened patients. These findings suggest that channel discrimination ability is a relevant factor in the performance of a CI user. Therefore, in the early phases of the rehabilitation programme, the Dα score might be a useful predictor for subject’s speech perception later on.
The discrimination test generally required less than 30 min; determining the MCLs lasted approximately 15 min and conducting the 3AFC task lasted another 10 min. This means that our test can be conducted within the time available for a regular appointment in our outpatient centre. To save time, we decided to test predefined values of α only, rather than using an adaptive procedure. From a statistical point of view, the reduced number of tested α values can be seen as a measurement error with respect to the true JND of α. As the α values are pre-specified, the error is non-differential with respect to an outcome, such as speech recognition. Any association found between Dα scores and speech recognition would, therefore, be weakened. On the other hand, current method does not provide precise Dα scores. In a next version, we will make the discrimination test semi-adaptive in order to estimate the Dα more precisely. In this test, the ICD was halved if the subject could discriminate the stimuli, while the test was aborted if an α was not discriminable. Alternatively, the ICD can be doubled if the subject cannot discriminate the stimuli, or one can test an α value in between a discriminable and non-discriminable α. To illustrate, while still limiting the number of test values to 3, the following sequences would be possible: ICD = 1 (fail), ICD = 2 (pass), ICD = 1.5 (pass); or ICD = 1 (pass), ICD = 0.5 (fail), ICD = 0.75 (pass). Lastly, the number of repetitions has to be weighed against the testing time. In this study, five repetitions were used. More repetitions will increase the precision and reliability of the Dα score and it will decrease the effect of chance guesses. It is our intention to evaluate these and other improvements in future versions of the discrimination test, whereby a test time below 30 min remains important for the clinical applicability of the test.
Conclusions
To conclude, this article describes a novel custom-made pitch discrimination experiment that enables testing along the whole electrode array within 30 min. The large variations in Dα emphasise the importance of testing the complete electrode array, rather than at only a few contacts. The correlation between channel discrimination and speech perception indicates that testing channel discrimination along the whole electrode array might be a useful tool for getting insight into the performance of CI recipients. Moreover, testing this could potentially help clinicians optimise the fitting procedures; e.g. to deactivate ineffective electrode contacts.
Disclosure statement
Authors Johan H.M. Frijns and Jeroen J. Briaire have a non-restrictive research grant from Advanced Bionics. Johan H.M. Frijns is also a member of the European medical advisory board of Advanced Bionics.
Additional information
Funding
References
- Agresti, A. 2002. “Categorical Data Analysis.” In Wiley Series in Probability and Statistics. Hoboken, NJ: John Wiley & Sons, Inc. http://doi.wiley.com/10.1002/0471249688.
- Bierer, J. A. 2007. “Threshold and Channel Interaction in Cochlear Implant Users: Evaluation of the Tripolar Electrode Configuration.” The Journal of the Acoustical Society of America 121 (3): 1642–1653. doi:https://doi.org/10.1121/1.2436712.
- Bosman, A. J., and G. F. Smoorenburg. 1995. “Intelligibility of Dutch CVC Syllables and Sentences for Listeners with Normal Hearing and with Three Types of Hearing Impairment.” International Journal of Audiology 34 (5): 260–284. doi:https://doi.org/10.3109/00206099509071918.
- Collins, L. M., T. A Zwolan, and G. H. Wakefield. 1997. “Comparison of Electrode Discrimination, Pitch Ranking, and Pitch Scaling Data in Postlingually Deafened Adult Cochlear Implant Subjects.” The Journal of the Acoustical Society of America 101 (1): 440–455. doi:https://doi.org/10.1121/1.417989.
- de Miguel, Á. R., A. A. Argudo, S. A. Borkoski Barreiro, J. C. Falcón González, and A. R. Macías. 2018. “Imaging Evaluation of Electrode Placement and Effect on Electrode Discrimination on Different Cochlear Implant Electrode Arrays.” European Archives of Oto-Rhino-Laryngology 275: 1385–1394. doi:10.1007/s00405-018-4943-2.
- Debruyne, J. A., T. Francart, A. M. L. Janssen, K. Douma, and J. P. L. Brokx. 2017. “Fitting Prelingually Deafened Adult Cochlear Implant Users Based on Electrode Discrimination Performance.” International Journal of Audiology 56 (3): 174–185. doi:https://doi.org/10.1080/14992027.2016.1243262.
- Donaldson, G. S., H. A Kreft, and L. Litvak. 2005. “Place-Pitch Discrimination of Single- Versus Dual-Electrode Stimuli by Cochlear Implant Users (L).” The Journal of the Acoustical Society of America 118 (2): 623–626. doi:https://doi.org/10.1121/1.1937362.
- Firszt, J. B., D. B. Koch, M. Downing, and L. Litvak. 2007. “Current Steering Creates Additional Pitch Percepts in Adult Cochlear Implant Recipients”. Otology & Neurotology 28 (5): 629–636. doi:10.1097/01.mao.0000281803.36574.bc.
- Friesen, L. M., R. V. Shannon, D. Baskent, and X. Wang. 2001. “Speech Recognition in Noise as a Function of the Number of Spectral Channels: Comparison of Acoustic Hearing and Cochlear Implants.” The Journal of the Acoustical Society of America 110 (2): 1150–1163. doi:https://doi.org/10.1121/1.1381538.
- Frijns, J. H. M., R. K. Kalkman, F. J. Vanpoucke, J. S. Bongers, and J. J. Briaire. 2009. “Simultaneous and Non-Simultaneous Dual Electrode Stimulation in Cochlear Implants: Evidence for Two Neural Response Modalities.” Acta Oto-Laryngologica 129 (4): 433–439. doi:https://doi.org/10.1080/00016480802610218.
- Frijns, J. H. M., W. M. C. Klop, R. M. Bonnet, and J. J. Briaire. 2003. “Optimizing the Number of Electrodes with High-Rate Stimulation of the Clarion CII Cochlear Implant.” Acta Oto-Laryngologica 123 (2): 138–142. doi:10.1080/0036554021000028126
- Goehring, J. L., D. L. Neff, J. L. Baudhuin, and M. L. Hughes. 2014. “Pitch Ranking, Electrode Discrimination, and Physiological Spread of Excitation Using Current Steering in Cochlear Implants.” The Journal of the Acoustical Society of America 136 (6): 3159. doi:https://doi.org/10.1121/1.4900634.
- Jones, G. L., J. H. Won, W. R. Drennan, and J. T. Rubinstein. 2013. “Relationship between Channel Interaction and Spectral-Ripple Discrimination in Cochlear Implant Users.” The Journal of the Acoustical Society of America 133 (1): 425–433. doi:https://doi.org/10.1121/1.4768881.
- Kenway, B., Y. C. Tam, Z. Vanat, F. Harris, R. Gray, J. Birchall, R. Carlyon, and P. Axon. 2015. “Pitch Discrimination: An Independent Factor in Cochlear Implant Performance Outcomes.” Otology & Neurotology 36 (9): 1472–1479. doi:10.1097/MAO.0000000000000845.
- Koch, D. B., M. Downing, M. J. Osberger, and L. Litvak. 2007. “Using Current Steering to Increase Spectral Resolution in CII and HiRes 90K Users.” Ear and Hearing 28: 38S–41S. doi:https://doi.org/10.1097/AUD.0b013e31803150de.
- Lawless, H. T. 2010. “A Simple Alternative Analysis for Threshold Data Determined by Ascending Forced-Choice Methods of Limits.” Journal of Sensory Studies 25 (3): 332–346. doi:https://doi.org/10.1111/j.1745-459X.2009.00262.x.
- Long, C. J., T. A Holden, G. H. McClelland, W. S. Parkinson, C. Shelton, D. C. Kelsall, and Z. M. Smith. 2014. “Examining the Electro-Neural Interface of Cochlear Implant Users Using Psychophysics, CT Scans, and Speech Understanding.” Journal of the Association for Research in Otolaryngology 15 (2): 293–304. doi:https://doi.org/10.1007/s10162-013-0437-5.
- McKay, C. M., H. J. McDermott, and R. P. Carlyon. 2000. “Place and Temporal Cues in Pitch Perception: Are They Truly Independent?” Acoustics Research Letters Online 1 (1): 25–30. doi:https://doi.org/10.1121/1.1318742.
- Nelson, D. A., D. J. Van Tasell, A. C. Schroder, S. Soli, and S. Levine. 1995. “Electrode Ranking of “Place Pitch” and Speech Recognition in Electrical Hearing.” The Journal of the Acoustical Society of America 98 (4): 1987–1999. doi:https://doi.org/10.1121/1.413317.
- Pfingst, B. E., and L. Xu. 2004. “Across-Site Variation in Detection Thresholds and Maximum Comfortable Loudness Levels for Cochlear Implants.” Journal of the Association for Research in Otolaryngology 5 (1): 11–24. doi:https://doi.org/10.1007/s10162-003-3051-0.
- Pfingst, B. E., L. Xu, and C. S. Thompson. 2004. “Across-Site Threshold Variation in Cochlear Implants: Relation to Speech Recognition.” Audiology and Neuro-Otology 9 (6): 341–352. doi:https://doi.org/10.1159/000081283.
- Potts, L. G., M. W. Skinner, B. D. Gotter, M. J. Strube, and C. A Brenner. 2007. “Relation between Neural Response Telemetry Thresholds, T- and C-Levels, and Loudness Judgments in 12 Adult Nucleus 24 Cochlear Implant Recipients.” Ear and Hearing 28 (4): 495–511. doi:https://doi.org/10.1097/AUD.0b013e31806dc16e.
- Shannon, R. V. 1983. “Multichannel Electrical Stimulation of the Auditory Nerve in Man. I. Basic Psychophysics.” Hearing Research 11 (2): 157–189. doi:https://doi.org/10.1016/0378-5955(83)90077-1.
- Shannon, R. V., Q. J. Fu, and J. Galvin. 2004. “The Number of Spectral Channels Required for Speech Recognition Depends on the Difficulty of the Listening Situation.” Acta Oto-Laryngologica Supplementum 124 (0): 50–54. doi:https://doi.org/10.1080/03655230410017562.
- Snel-Bongers, J., J. J. Briaire, F. J. Vanpoucke, and J. H. M. Frijns. 2012. “Spread of Excitation and Channel Interaction in Single- and Dual-Electrode Cochlear Implant Stimulation.” Ear and Hearing 33 (3): 367–376. doi:https://doi.org/10.1097/AUD.0b013e318234efd5.
- Snel-Bongers, J., A. P. Netten, P.-P. B. M. Boermans, L. J. C. Rotteveel, J. J. Briaire, and J. H. M. Frijns. 2018. “Evidence-Based Inclusion Criteria for Cochlear Implantation in Patients with Postlingual Deafness.” Ear and Hearing 39 (5): 1008–1014. doi:https://doi.org/10.1097/AUD.0000000000000568.
- Townshend, B., N. Cotter, D. Van Compernolle, and R. L. White. 1987. “Pitch Perception by Cochlear Implant Subjects.” The Journal of the Acoustical Society of America 82 (1): 106–115. doi:https://doi.org/10.1121/1.395554.
- Zeng, F. G. 2002. “Temporal Pitch in Electric Hearing.” Hearing Research 174 (1–2): 101–106. doi:10.1016/S0378-5955(02)00644-5
- Zeng, F. G. 2004. “Trends in Cochlear Implants.” Trends in Amplification 8 (1): 1–34. doi:https://doi.org/10.1177/108471380400800102.