
Abstract
Objective: Pure tone audiometry may seem to be a relatively easy task for the participant but it may involve cognitive as well as sensory abilities. The aim of this study is to examine the relationship between hearing thresholds in the frequency range 0.125–8 kHz and the core executive function cognitive flexibility in healthy individuals with normal hearing.
Design: Experimental study measuring correlations between different pure-tone hearing threshold measures and cognitive flexibility. Pure tone air conduction audiometry (frequencies 0.125–8.0 kHz) and two tests of cognitive flexibility (information updating and shifting ability) were conducted.
Study sample: Seventy-two subjects (aged between 21 and 36) with normal hearing (<20 dB HL) for the tested frequencies.
Results: Four measures of average pure tone hearing thresholds were negatively correlated with cognitive flexibility.
Conclusions: Pure-tone air conduction hearing thresholds seem to be related to cognitive flexibility in healthy individuals with normal hearing.
Introduction
Previous research suggests that poorer hearing thresholds are related to poorer executive function (Harrison Bush et al. Citation2015; Humes et al. Citation2010; Lin Citation2011; Lin et al. Citation2011; Lin et al. Citation2013; Lindenberger, Scherer, and Baltes Citation2001; Sheft et al. Citation2015). After accounting for demographic variables such as age and medical history, Lin (Citation2011) showed that better ear pure tone average (PTA; frequencies 0.5, 1, 2 and 4 kHz) was independently related to executive function in people aged 55 years or older. The same relationship was also found in adults aged 70–79 years (Lin et al. Citation2013). Hearing loss is often the result of the peripheral decline, damage or disease in the auditory pathways. Mechanisms behind cognitive decline such as neuropathological conditions do not seem to influence hearing loss (Lin et al. Citation2013). Furthermore, poorer hearing thresholds are related to reduced grey matter volume (Eckert et al. Citation2012; Peelle and Wingfield Citation2016; Rudner et al. Citation2019). Hence, it seems reasonable to assume that the effects of peripheral hearing loss are the most likely cause for the association between hearing loss and executive function. One hypothesis is that functional changes later become manifest as structural changes (Eckert et al. Citation2012; Peelle and Wingfield Citation2016). Also, the two possible causes for the relationship between hearing loss and executive function found in previous studies (e.g. Lin Citation2011 and Lin et al. Citation2013) – age changes and changes caused by hearing loss – can be removed by testing the relationship using younger adults with normal hearing. This article examines this latter assumption.
Higher-order executive functions related to attention require the use of core executive functions (Diamond Citation2013). The ability to process, organise, plan and reason require higher-order executive functions. Core executive functions are considered to be cognitive flexibility, working memory and inhibitory control (Diamond Citation2013; Miyake et al. Citation2000). Cognitive flexibility is required to be able to update information, change perspective and switch between tasks. Proficiency in cognitive flexibility requires support from both working memory and inhibitory control. Working memory is also necessary for simultaneous processing and storing of information and to maintain short-term goals. Inhibitory control allows a person to inhibit behaviour and to minimise memory intrusions and task-irrelevant external interference (Diamond Citation2013). The relationship between working memory and inhibitory control is reciprocal (Diamond Citation2013): Goal maintenance in task pursuit requires working memory but to be able to successfully do this inhibitory control supports goal maintenance by reducing the influence of task-irrelevant input. However, to be able to inhibit task-irrelevant information working memory provides information on what the task goal is. Thus, information from working memory makes it easier to decide what input is task relevant and what input is not. This is also important for cognitive flexibility: if a person needs to switch between two tasks, the memory intrusions from the previous task need to be suppressed and a new goal needs to be activated and maintained by working memory. The unity/diversity framework states that these three core executive functions (cognitive flexibility, working memory and inhibitory control) can be considered as separate entities although they are partially interdependent (Miyake et al. Citation2000). Since these three core executive functions are interrelated and since they are required for higher-order executive functions, it can be assumed that performance in one core executive function is related to performance in another core executive function.
There seems to be a relationship between hearing loss and executive functions. Reduced sensory input leading to reduced cognitive stimulation seems to be the cause of poor cognitive performance in individuals with hearing loss. It can, therefore, be assumed that when removing the effect of hearing loss, there should be no relationship between hearing thresholds and executive function. In turn, it could be assumed that hearing thresholds should not be related to executive functions in young healthy individuals with normal hearing in the frequency range 0.125–8 kHz. However, there seems to be some association between hearing thresholds and core executive functions in young healthy individuals with normal hearing. Even in a group of younger individuals with normal hearing in the frequency range of 0.125–8 kHz, Brännström et al. (Citation2018b) found that large differences between the better and worse ear in the very high frequencies (greater than 10kHz) were significantly related to executive function. This was true despite the fact that there no direct association was found between high-frequency hearing thresholds and executive function.
Pure tone audiometry is associated with bias and many sources of error even when performed according to applicable standards (e.g. ISO Citation1998b). There are within-subject factors that influence pure-tone hearing thresholds assessed using the modified Hughson–Westlake method in people with normal hearing (Arlinger Citation1993): physiological noise (i.e. spontaneous resting activity in the afferent cochlear neurons), adaptation, habituation, temporal integration, lack of ability to participate (e.g. tiredness, fear or distractions), willingness to participate (e.g. accepting measurement of hearing thresholds), instructions (e.g. when to respond) and learning effects. Therefore, it can be assumed that the measurement of hearing thresholds should be influenced by behavioural processes related to attention. Attention relies on executive function (Diamond Citation2013). It can be argued that in the case of testing pure-tone hearing thresholds attention involves the use of all core executive functions. Since cognitive flexibility relies on the reciprocal relationship between working memory and inhibitory control, we chose it as a starting point to assess the relationship between hearing thresholds and cognitive flexibility. However, the core executive functions should not be related to hearing thresholds per se but rather to e.g. accuracy and response times. The aim of this study is to examine the relationship between hearing thresholds in the frequency range of 0.125–8 kHz and cognitive flexibility in healthy individuals with normal hearing.
Method
Subjects
Eighty-seven adults (students, colleagues and friends of the authors) were initially recruited through advertisements and personal contacts. To be included in the analysis, the subjects had to have pure tone air conduction hearing thresholds equal to or better than 20 dB HL at frequencies 0.125, 0.250, 0.5, 1.0, 1.5, 2.0, 3.0, 4.0, 6.0 and 8.0 kHz and be between 18 and 40 years old. Seventy-two subjects met these criteria and were included in the analysis. The final sample consisted of 55 females and 17 males. They had an average age of 26.3 years (median 26 years; range 21–36 years). All subjects reported normal or corrected-to-normal vision. The Regional Ethics Board in Lund, Sweden, approved the project (approval numbers 2014/95 and 2018/359).
The data presented in this article were collected in two different experiments (n = 46 and n = 26, respectively). Data from these two experiments were pooled together for the purposes of this study.
Pure tone audiometry
Pure tone air conduction hearing thresholds were assessed for frequencies 0.125, 0.250, 0.5, 1.0, 1.5, 2.0, 3.0, 4.0, 6.0 and 8.0 kHz in one ear at the time. The assessments were made in accordance with ISO 8253-1 (ISO Citation1998b) in a sound-treated booth with maximum permissible ambient background noise levels not exceeding those stated in ISO 8253-1 (Citation1998b). Hearing thresholds were measured with a GN Otometrics Astera2 and TDH-39P earphones calibrated according to ISO 389-1 (ISO Citation1998a).
Cognitive flexibility
Cognitive flexibility was estimated through two tasks that assess its two components: shifting ability and information updating ability. The Number–Letter task was used to assess shifting ability and the Keep Track task was used to assess information updating ability (Hua et al. Citation2014a, Citation2014b; Miyake et al. Citation2000).
In the Number–Letter task, trials consisted of the combination of one number (between 1 and 9) and one letter. Numbers were either odd or even and letters were in upper or lower case. Trials were presented on a computer screen in a clockwise manner: trial 1was presented in the upper left corner, trial 2 in the upper right corner, trial 3 in the lower right corner, trial 4 in the lower-left corner, trial 5 in the upper left corner and so on. The task was to judge if the number in the trials presented in the upper part of the screen was odd or even and if the letters in the trials presented in the lower part of the screen were upper or lower case. Four designated keyboard keys (“odd”, “even”, “upper” and “lower”) were used to record subject responses. The trial duration was 10 s or until a response was recorded. To familiarise the subjects with the task, 12 practice trials were initially completed. These were followed by 38 actual test trials. The task was programmed in E-Studio version 2.0 (E-Prime Professional). E-Run version 2.0 (E-Prime Professional, San Jose, CA, U.S.A.) was used to present trials and to collect responses. A shift trial is preceded by a no-shift trial. In the no-shift trial, the task is the same as in the previous trial (e.g. to judge if numbers are odd or even). Thus, in the shift trial, the task is not the same as in the previous trial. Shifting ability scores were calculated by first separating the trials into shift trials (change of task) and no-shift trials (no change of task) and then calculating the difference between these two conditions. More specifically, first, the shift trial accuracy was divided by the average response times for shift trials. In a similar manner, the no-shift trial accuracy was divided by the average response times for no-shift trials. The resulting two sets of scores were combined into a single score by subtracting the shift-trial scores from the no-shift trial scores. In this format, a higher score indicated a poorer shifting ability. To be able to combine the scores from this task with the scores from the Number–Letter task (where a higher score indicated better information updating ability, see below) they were inverted (1/x). After this inversion, a lower score indicated poorer shifting ability.
In the Keep Track task (Hua et al. Citation2014a, Citation2014b; Miyake et al. Citation2000), four of six possible word categories (“Countries”, “Animals”, “Colors”, “Metals” “Fruits” and “Relatives”) were presented at the top of a computer screen and 12 content words were drawn from all six categories and presented one at the time in random order on the same screen. Examples of content words were “Finland”, “Dog”, “Blue”, “Silver”, “Banana” and “Cousin”. Each content word was presented for 3 s followed by white screen 0.5 s where only the four categories were shown on screen. In each trial, the content words were selected from the four categories in the following manner: the first category was represented by one content word, the second category by two content words, the third category by three content words and the fourth category by four content words. Two additional content words were selected from the other two categories not shown on screen. The task was to report the last content word for each category at the end of the trial using pen and paper. A demonstration and two practice trials were completed before beginning the six experimental trials to familiarise the subject with the task. The task was made and presented in Microsoft PowerPoint 2010 version 14.0 (Redmond, Wa, U.S.A.). Scores were calculated as the proportion correctly recalled content words in all six trials. A lower score indicated lower information updating ability.
The subjects were tested as a part of a larger project comparing subjects with hearing impairment with subjects with normal hearing. To avoid audibility issues in subjects with hearing impairment, visual cognitive tasks were selected for the larger project.
Procedures
Subjects were tested individually. Forty-six subjects were first subjected to otoscopy and then performed pure tone audiometry followed by the Number–Letter task and the Keep Track task. Twenty-six subjects performed pure tone audiometry last. Hearing thresholds were measured in a sound-treated booth as specified above. Cognitive tasks were conducted in a quiet room and any unwanted noise was blocked out using sound attenuating Sennheiser HDA200 earphones. The individual test session lasted for about 75 min and additional tests not reported here were conducted during the same session. Breaks were allowed if asked for by the subject.
Data analysis
Data are reported as average better and worse ear PTA hearing thresholds for frequencies 0.5, 1.0, 2.0 and 4.0 kHz (BEPTA and WEPTA, respectively), better and worse ear PTA high-frequency hearing thresholds for frequencies 3.0, 4.0 and 6.0 kHz (HFBEPTA and HFWEPTA, respectively) cognitive flexibility and age. At the clinic and in prevalence studies, the low frequency PTA (0.5, 1, 2 and 4 kHz) has often been used as a measure of hearing at “speech frequencies” while the high-frequency PTA (3, 4 and 6 kHz) has been used to assess high-frequency hearing loss (Agrawal, Platz, and Niparko Citation2008).
Brännström et al. (Citation2018b) tested working memory, inhibitory control and cognitive flexibility in young individuals with normal hearing. They used the same cognitive tasks (shifting ability and the Keep Track task). They performed a principal component analysis and found that these two measures of cognitive flexibility measure the same underlying component. Therefore, it is reasonable to combine these two measures into a single one representing cognitive flexibility. All variables were converted to z-scores and these z-scores were used in all statistical tests. The purpose of the conversion was to be able to combine the two tested components in cognitive flexibility into a single variable: the data for the two tests of the separate components in cognitive flexibility (shifting ability and information updating ability) were first converted into z-scores and then added. The sum scores were used in the analysis thus yielding a normal variable with a mean of zero and a variance of 2.0. Furthermore, from a theoretical point of view, cognitive flexibility that encompasses several different aspects such as the ability to change perspectives spatially (the Number–Letter task) and solving tasks require the use of the reciprocal relationship between working memory and inhibitory control (Keep Track task). Therefore, cognitive flexibility cannot be represented by performance on individual tasks. Based on this, we chose to use a combined measure of cognitive flexibility in the analyses rather than examining performance in the separate tasks. The BEPTA, WEPTA, HFBEPTA, HFWEPTA and age were simply converted to z-scores. Higher values indicate higher hearing thresholds (worse hearing), better cognitive performance and higher age.
The one-sample Kolgomorov–Smirnov test indicated that the only variable that met the requirement of being normally distributed was cognitive flexibility (D[72] = 0.102, p = 0.06). The one-sample Kolgomorov–Smirnov test for the other variables was D[72] ≥ 0.153, p ≤ 0.001 but with only slightly positive skews in the histograms. Therefore, z-scores were used but with non-parametric statistics. Mann–Whitney U-tests with Bonferroni correction was used to assess differences between groups of subjects (sex). Partial Spearman’s rank correlation coefficients (rho) were used to assess associations between variables (Conover Citation1999). Benjamini and Hochberg (Citation1995) false discovery rate was used to correct for multiple tests in the correlation analysis. A scaled alpha level of 0.05 after the correction was considered statistically significant.
Results
Better and worse ear average pure tone hearing thresholds for separate frequencies are shown in . Actual cognitive performance prior to conversion to z-scores is shown in . Initially, Spearman’s rank correlation coefficients showed that age was significantly correlated with WEPTA (rho[70] = 0.257, p = 0.029) and HFWEPTA (rho[70] = 0.250, p = 0.034) before correction for multiple tests. Age was not significantly correlated with any other variable (rho[70] < 0.222, p ≥ 0.061) before correction for multiple tests. Therefore, age was included as a covariate in the following analyses. Mann–Whitney U-tests were used to assess differences between male and female subjects on the outcome variables. There were no significant differences before the correction between male and female subjects on the outcome variables (U ≥ 334, p ≥ 0.074). Therefore, sex was not included as a covariate in the following analyses.
Figure 1. Average pure-tone hearing thresholds in dB HL for frequencies 0.125–8.0 kHz. Circles denote the right ear and cross denote the left ear. Error bars indicate standard deviation. (N = 72).
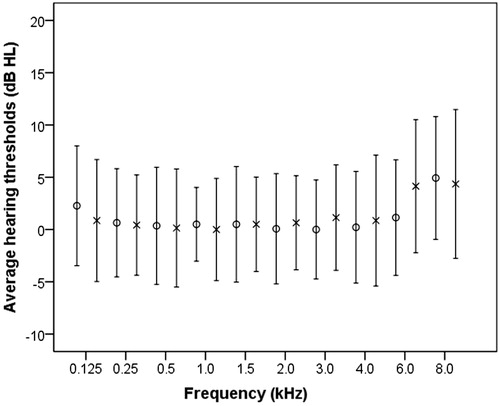
Table 1. Average shifting ability (see text for explanation) and information updating (proportion of scores correct) along with standard deviations (SDs), minimum (min) and maximum (max) values before normalisation. The values are shown for the two experiment groups (group 1, n = 46 and group 2, n = 26) and all subjects together (n = 72).
In a second analysis, partial Spearman’s rank correlation coefficients were calculated between BEPTA, WEPTA, HFBEPTA, HFWEPTA and cognitive flexibility (see ). Significant intercorrelations were seen between BEPTA, WEPTA, HFBEPTA and HFWEPTA. Cognitive flexibility was significantly correlated with BEPTA and with HFBEPTA. show the relationships between cognitive flexibility and different pure-tone measures. The figures also show the overlap of responses collected from the two samples. All significant correlations remained significant after correction for multiple tests.
Figure 2. Scatterplot for BEPTA in dB HL and cognitive flexibility as z-scores. BEPTA is shown in dB HL for ease of interpretation. Circles represent the results for the group from the first experiment (n = 46) and dots represent the results for the group from the second experiment (n = 26).
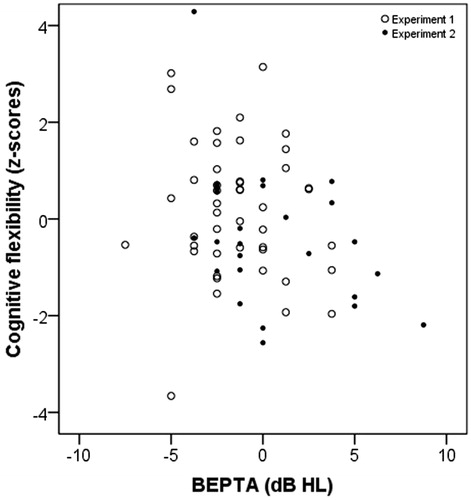
Figure 3. Scatterplot for WEPTA in dB HL and cognitive flexibility function as z-scores. Otherwise as in .
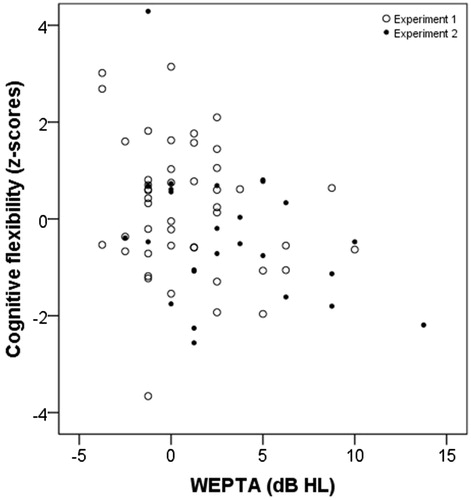
Figure 4. Scatterplot for HFBEPTA in dB HL and cognitive flexibility as z-scores. Otherwise as in .
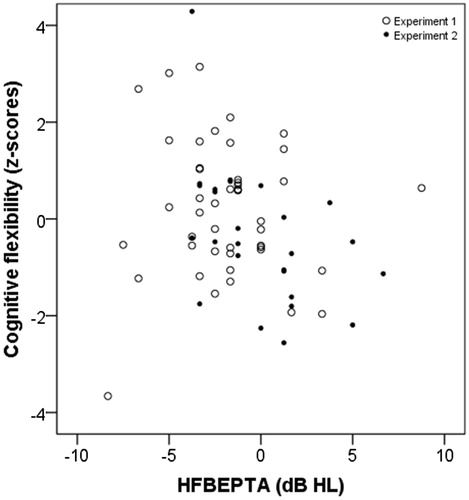
Figure 5. Scatterplot for HFWEPTA in dB HL and cognitive flexibility function as z-scores. Otherwise as in .
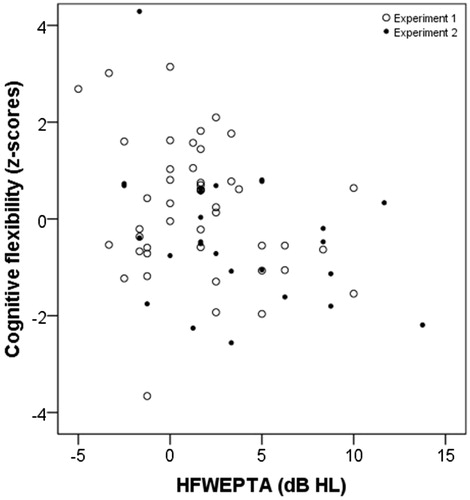
Table 2. Partial Spearman rank correlation coefficients (rho) between the outcome variables using age as a covariate. Degrees of freedom = 69. (n = 72).
Discussion
These findings showed that PTAs were significantly correlated with cognitive flexibility. We argued initially that we did not expect to find an association between pure-tone air conduction hearing thresholds and executive functions in young healthy individuals with normal hearing. This was based on the assumption that there would be no relationship between hearing thresholds and executive functions after removing the effect of hearing loss. These findings are in contrast to this assumption.
It cannot be deduced from this data why there seems to be a relationship between average pure hearing thresholds and executive function measured as cognitive flexibility. In a previous study, Brännström et al. (Citation2018a) reported that smaller better and worse ear differences in high-frequency hearing thresholds (frequency range 10–14 kHz) in individuals with normal hearing in the frequency range 0.125–8 kHz were related to higher executive function. The association between actual high-frequency hearing thresholds and executive function was not significant. Brännström et al. (Citation2018a) did not, as in this study, examine the association between BEPTA, WEPTA, HFBEPTA, HFWEPTA and executive functions.
It is not obvious why cognitive flexibility is related to hearing thresholds. Pure tone audiometry is a detection task where the participant is instructed to press a button every time a tone is heard. The participant thus needs to decide whether a signal is present or not before responding. Arguably, all three core executive functions may be involved to complete this task (Diamond Citation2013); Working memory seems required to maintain short-term goals in task goal pursuit (press the button when a signal is detected). Inhibitory control seems required to inhibit behaviour (withholding response when there is no signal). Cognitive flexibility seems required to be able to change perspective and switch between tasks (decide whether a signal is present or not) (Diamond Citation2013). These findings suggest that the ability to change perspective and/or switch tasks could be important when engaging in pure tone audiometry. On the other hand, it is also possible that a common source of error is present when testing both pure tone audiometry and cognitive flexibility, i.e. an unknown factor influencing performance in all these tests in a common way, causing the correlation. It is also possible that pure tone audiometry is not a demanding task as long as the signals are clearly audible. As soon as we approach threshold and tones are presented in the vicinity of what is physiologically possible to detect, perhaps those with higher cognitive capacity can push themselves further in order to make accurate decisions, i.e. whether a tone is present or not.
When it comes to diagnosing hearing in adults, pure tone thresholds in the normal range and subjective experience of normal hearing is usually satisfactory to label someone as having normal hearing. The margin for labelling pure tone thresholds as normal can be examined and compared to the statistical variation of thresholds of a large group of normal-hearing people. However, pure tone thresholds in themselves are not usually enough to draw any profound conclusions about someone’s hearing. Perhaps threshold levels are more easily explained and provide more information about someone’s hearing when a peripheral hearing problem is present, but the mechanisms behind the variability and reliability of normal pure-tone hearing thresholds are less well understood. Based on our findings, the nature of hearing and the ability to detect low intensity sounds in the context of pure tone audiometry may perhaps depend, to a larger degree than we were previously aware, on aspects other than peripheral hearing. Furthermore, the concept of normal hearing thresholds is somewhat arbitrary. Perhaps hearing thresholds, rather than the presence of hearing loss, may have an impact on cognitive performance.
Limitations and future studies
There are several limitations with this study that may influence the generalisation of the findings. These findings are based on the pooled data from two separate experiments. The purpose of this pooling was to achieve a larger sample to answer the research question more reliably. The variable cognitive flexibility was derived from the combination of two tests assessing its two components, information updating and shifting ability. In a previous study, Brännström et al. (Citation2018b) showed that these two tests represent the same underlying construct using a principal component analysis. Therefore, it seems valid to pool these two measures together.
The measures of hearing thresholds and cognitive flexibility represent tasks in different modalities. We selected visual measures of cognitive flexibility to avoid audibility issues since this study is a part of a larger project where individuals with normal hearing are compared with individuals with hearing loss. However, since the findings suggest that there is an association between hearing thresholds and cognitive flexibility despite using tasks in different modalities, they indicate that the connection between performance on these measures lies beyond the processing of auditory signals.
Based on the findings of this study, it could be speculated that those with higher executive functions have the ability to better detect changes from the neural resting state when inner hair cells become stimulated. This could perhaps be studied by examining whether the slopes of the psychometric function differ between those with high and low executive function. This is hard to do using only the 5 dB step size used in this study (Leijon Citation1992). It is also possible that those with higher executive function were faster to learn the hearing threshold measurement procedure during the test than those with poorer executive function. There are indications suggesting that pure-tone hearing thresholds improve with exposure to the test (Robinson, Shipton, and Hinchcliffe Citation1981). Furthermore, pure tone hearing thresholds are influenced by several within-subject factors such as physiological noise, adaptation, habituation, temporal integration, ability to participate, willingness to participate, instructions and learning effects (Arlinger Citation1993). Hence it is likely that pure-tone hearing threshold assessments are influenced by behavioural processes related to attention such as accuracy and response times that were not assessed in this study. Future studies could examine these things.
Conclusion
Pure tone hearing thresholds seem to be related to cognitive flexibility in healthy individuals with normal hearing. Based on these findings, it is unclear why this relationship is seen.
Ethical approval
This study received approval from the regional ethics committee. This study adhered to the Declaration of Helsinki ethical principles.
Disclosure statement
The authors alone are responsible for the content and writing of the article. The authors confirm this manuscript is an original contribution, not previously published and not under consideration for publication elsewhere.
References
- Agrawal, Y., E. A. Platz, and J. K. Niparko. 2008. “Prevalence of Hearing Loss and Differences by Demographic Characteristics among US Adults: Data from the National Health and Nutrition Examination Survey, 1999–2004.” Archives of Internal Medicine 168 (14): 1522–1530. doi:10.1001/archinte.168.14.1522.
- Arlinger, S. 1993. Manual of Practical Audiometry. Vol. 2. London: Whurr Publishers Ltd.
- Benjamini, Y., and Y. Hochberg. 1995. “Controlling for the False Discovery Rate: A Practical and Powerful Approach to Multiple Testing.” Journal of the Royal Statistical Society: Series B (Methodological) 57: 289–300. doi:10.1111/j.2517-6161.1995.tb02031.x.
- Brännström, K. J., E. Karlsson, S. Waechter, and T. Kastberg. 2018a. “Extended High-Frequency Pure Tone Hearing Thresholds and Core Executive Functions.” International Journal of Audiology 57 (9): 639–645. doi:10.1080/14992027.2018.1475755.
- Brännström, K. J., E. Karlsson, S. Waechter, and T. Kastberg. 2018b. “Listening Effort: Order Effects and Core Executive Functions.” Journal of the American Academy of Audiology 29 (8): 734–747. doi:10.3766/jaaa.17024.
- Conover, W. J. 1999. Practical Nonparametric Statistics. New York, NY: Wiley.
- Diamond, A. 2013. “Executive Functions.” Annual Review of Psychology 64 (1): 135–168. doi:10.1146/annurev-psych-113011-143750.
- Eckert, M. A., S. L. Cute, K. I. Vaden, Jr., S. E. Kuchinsky, and J. R. Dubno. 2012. “Auditory Cortex Signs of Age-Related Hearing Loss.” Journal of the Association for Research in Otolaryngology 13 (5): 703–713. doi:10.1007/s10162-012-0332-5.
- Harrison Bush, A. L., J. J. Lister, F. R. Lin, J. Betz, and J. D. Edwards. 2015. “Peripheral Hearing and Cognition: Evidence from the Staying Keen in Later Life (SKILL) Study.” Ear and Hearing 36 (4): 395–407. doi:10.1097/AUD.0000000000000142.
- Hua, H., M. Emilsson, R. Ellis, S. Widen, C. Möller, and B. Lyxell. 2014a. “Cognitive Skills and the Effect of Noise on Perceived Effort in Employees with Aided Hearing Impairment and Normal Hearing.” Noise and Health 16 (69): 79–88. doi:10.4103/1463-1741.132085.
- Hua, H., M. Emilsson, K. Kahari, S. Widen, C. Moller, and B. Lyxell. 2014b. “The Impact of Different Background Noises: Effects on Cognitive Performance and Perceived Disturbance in Employees with Aided Hearing Impairment and Normal Hearing.” Journal of the American Academy of Audiology 25 (9): 859–868. doi:10.3766/jaaa.25.9.8.
- Humes, L. E., D. Kewley-Port, D. Fogerty, and D. Kinney. 2010. “Measures of Hearing Threshold and Temporal Processing across the Adult Lifespan.” Hearing Research 264 (1–2): 30–40. doi:10.1016/j.heares.2009.09.010.
- ISO 389-1 1998a. ISO 389-1. Acoustics: Reference Zero for the Calibration of Audiometric Equipment. Part 1: Reference Equivalent Threshold Sound Pressure Levels for Pure Tones and Supra-Aural Earphones. Geneva, Switzerland: International Organization for Standardization.
- ISO 8253-1. 1998b. ISO 8253-1. Acoustics: Audiometric Test Methods Part 1: Basic Pure Tone Air and Bone Conduction Threshold Audiometry. Geneva, Switzerland: International Organization for Standardization.
- Leijon, A. 1992. “Quantization Error in Clinical Pure-Tone Audiometry.” Scandinavian Audiology 21 (2): 103–108. doi:10.3109/01050399209045989.
- Lin, F. R. 2011. “Hearing Loss and Cognition among Older Adults in the United States.” The Journals of Gerontology Series A: Biological Sciences and Medical Sciences 66: 1131–1136. doi:10.1093/gerona/glr115.
- Lin, F. R., L. Ferrucci, E. J. Metter, Y. An, A. B. Zonderman, and S. M. Resnick. 2011. “Hearing Loss and Cognition in the Baltimore Longitudinal Study of Aging.” Neuropsychology 25 (6): 763–770. doi:10.1037/a0024238.
- Lin, F. R., K. Yaffe, J. Xia, Q. L. Xue, T. B. Harris, E. Purchase-Helzner, S. Satterfield, et al. 2013. “Hearing Loss and Cognitive Decline in Older Adults.” JAMA Internal Medicine 173 (4): 293–299. doi:10.1001/jamainternmed.2013.1868.
- Lindenberger, U., H. Scherer, and P. B. Baltes. 2001. “The Strong Connection between Sensory and Cognitive Performance in Old Age: Not Due to Sensory Acuity Reductions Operating during Cognitive Assessment.” Psychology and Aging 16 (2): 196–205. doi:10.1037/0882-7974.16.2.196.
- Miyake, A., N. P. Friedman, M. J. Emerson, A. H. Witzki, A. Howerter, and T. D. Wager. 2000. “The Unity and Diversity of Executive Functions and Their Contributions to Complex “Frontal Lobe” Tasks: A Latent Variable Analysis.” Cognitive Psychology 41 (1): 49–100. doi:10.1006/cogp.1999.0734.
- Peelle, J. E., and A. Wingfield. 2016. “The Neural Consequences of Age-Related Hearing Loss.” Trends in Neurosciences 39 (7): 486–497. doi:10.1016/j.tins.2016.05.001.
- Robinson, D. W., M. S. Shipton, and R. Hinchcliffe. 1981. “Audiometric Zero for Air Conduction. A Verification and Critique of International Standards.” International Journal of Audiology 20 (5): 409–431. doi:10.3109/00206098109072712.
- Rudner, M., M. Seeto, G. Keidser, B. Johnson, and J. Rönnberg. 2019. “Poorer Speech Reception Threshold in Noise is Associated with Lower Brain Volume in Auditory and Cognitive Processing Regions.” Journal of Speech, Language, and Hearing Research 62 (4S): 1117–1130. doi:10.1044/2018_JSLHR-H-ASCC7-18-0142.
- Sheft, S., V. Shafiro, E. Wang, L. L. Barnes, and R. C. Shah. 2015. “Relationship between Auditory and Cognitive Abilities in Older Adults.” PLoS One 10 (8): e0134330. doi:10.1371/journal.pone.0134330.