
Abstract
Objective: To report a robust measure of the proportion of adults who do not use their hearing aids.
Design: Data on hearing aid use was extracted from national household survey data, from 2004 to 2018 in Wales, UK.
Study sample: A representative sample of 10,000 to 16,000 adults per year.
Results: Self-reported hearing difficulty increased smoothly from 14 to 16% during the 12 years when survey administration remained unchanged. The proportion reporting that they had tried a hearing aid increased from 5 to 7% and stabilised at this level since 2011. The proportion who reported using their hearing aid most of the time increased from 47 to 52% during the 15-year period. The proportion who did not use their hearing aids at all decreased from 21 to 18% over the same period.
Conclusions: In this extensively-surveyed population, approximately 20% of adults currently do not use their hearing aids at all, 30% use them some of the time and the remaining 50% most of the time. Hearing aids are valued by many, as judged by use, but there is substantial room for improvement. Inclusion of questions on use within a large-scale, regular national survey enables the collection of demonstrably reliable data.
Keywords:
Introduction
Hearing loss is the most prevalent sensory deficit (Mathers, Smith, and Concha Citation2000), and represents a major public health issue with substantial economic and societal costs (Archbold et al. Citation2014). There are no effective medical or surgical treatments for mild to moderate sensorineural hearing loss, so the main clinical intervention is the use of acoustic hearing aids (Kochkin Citation2009). Hearing aids have been shown to be effective in reducing the handicap caused by hearing loss (Chisolm et al. Citation2007), even for mild and moderate hearing impairment (Ferguson et al. Citation2017). The cost to the National Health Service (NHS) for the provision of all types of hearing-related care in Wales was £36 m per year I 2017/18 (Welsh Government Citation2019) for a population of approximately 3.1 million, in the expectation that the benefits will outweigh this substantial cost. For some recipients of hearing aids, the benefit is zero, as they elect not to use the devices. The reasons for hearing aid non-use are varied and include lack of perceived benefit, difficulties managing hearing aids, discomfort related to wearing hearing aids, and appearance (Bennett et al. Citation2018; McCormack and Fortnum Citation2013). The proportion of recipients who decide not to wear their devices at all, or who wear them for only a small proportion of the time has been surveyed numerous times, and in numerous countries across the world. Unfortunately, the estimate of the proportion of people who do not wear their devices varies hugely across these surveys.
At one extreme, one small-scale study reported that everyone used their devices (Takahashi et al. Citation2007) and three large-scale surveys have reported that only 1% of participants never use their devices (Bertoli et al. Citation2009; Dillon, Birtles, and Lovegrove Citation1999; Uriarte et al. Citation2005). In all three large-scale studies, a further 2 to 3% of respondents report wearing their devices for less than 1 hour per week. Near the other extreme, a large-scale study reported 29% of past owners of hearing aids never use their devices (Popelka et al. Citation1998). A smaller study of people fitted with hearing aids following an innovative screening programme that encouraged uptake of hearing aids reported that 57% never use their devices (Gianopoulos, Stephens, and Davis Citation2002).
In between these two extremes, a plethora of studies, summarised in , report widely varying percentages of respondents who never wear their hearing aids. Selection criteria for choosing these studies from the literature were that the survey: (a) reported the proportion of respondents who did not use their hearing aids; (b) was not restricted to people already known to have continued with hearing aid use after a trial period; (c) reported sufficient methodological details to understand the conditions under which the participants were recruited.
Table 1. Proportion of people fitted with hearing aids that report never using them, along with some procedural details of each survey. Studies are listed in decreasing order of non-use rate. Those percentages in column 3 marked with a include the proportion of people who report using their hearing aids for less than 1 hour per week.
Most of these studies also report the percentage of respondents who use their hearing aids for a limited amount, often defined as less than 1 hour per day, or from 1 to 4 h per day. These estimates of limited use also vary widely but are outside the scope of this article to review.
How can studies effectively asking such a simple question: “Do you ever wear your hearing aid(s)?” produce such widely varying answers, and where does the truth lie? Given that some of the surveys producing widely divergent answers have thousands of respondents, the spread of results is far wider than can be explained on the basis of random sampling variance. There are several factors relating to survey methodology, the characteristics of the population surveyed, and the services to which they have access, that have the potential to materially affect the answer obtained.
Who asks the question?
If the survey is conducted by the clinician, or organisation, that provided the services, some respondents may be biased to give the answer they expect the questioner wants to hear, especially if they think their response may affect the future service they receive. This probable tendency to exaggerate use can be referred to as acquiescence bias. Those studies in conducted by a researcher independent of the clinic had a median non-use rate of 7%, whereas those conducted by the clinic that fitted the hearing aids had a median non-use rate of 5%.
Which clients are asked the question?
If the survey is directed to people randomly chosen from the entire population, the ratio of people wearing their first hearing aids to those wearing subsequent hearing aids will reflect that of the general population. If the survey is instead directed to people randomly chosen from those fitted some defined time before (e.g. 6 months), there will be a substantially higher proportion of people who possess their first hearing aids. As there is a lower probability of a successful fitting for new clients than there is for clients returning for subsequent hearing aids (Aazh et al. Citation2015), such surveys may produce higher estimates of non-use than would occur for population-based surveys. Conversely, those recruited after a recent visit to a clinic may be more engaged with using their hearing aids than those fitted longer ago. The studies in surveying new users had a median non-use rate of 5%, whereas those surveying all users had a median non-use rate of 7%. Across the studies, the median non-use rates for surveys of recently fitted people is 5%, whereas those of people fitted at any time is 12%. This may indicate a lessening of use with time after fitting or may be the result of differences in the other dimensions that co-occurred with this dimension.
Which clients answer the question?
It is established that clients who do not wear their hearing aids are less likely to respond to surveys about their hearing aid use (Bertoli et al. Citation2009; Dillon Citation2012). Consequently, the lower the response rate to the survey, the lower the likely non-use rate. All the studies in with a non-use rate greater than 20% had a survey response rate greater than 76%.
Methodological issues?
Various methodological issues can in general affect survey responses (Perez and Edmonds Citation2012), including precisely how the question is phrased, what response alternatives are allowed, whether the question is embedded in a general questionnaire or one narrowly focussed on hearing (Stephens, Lewis, and Davis Citation2004), and whether the administration is paper and pencil versus automated or self-administered versus interviewer-administered.
Provision system?
Wearing rates may be affected by whether people have to pay for their hearing aids, the effort that people have to expend to obtain hearing aids, and the quality and availability of fitting and subsequent support services. As an example, the very high non-use rate of 57% reported by Gianopoulos, Stephens, and Davis (Citation2002) was in the context of a screening system in which people found to have hearing loss were encouraged to try hearing aids, despite them not previously independently taking any action towards acquiring them. Those studies in where the hearing aids were provided at no cost to the users have a median non-use rate of 6% and those where the users paid have a median non-use rate of 9%. Studies with a mixed-cost provision system have a median non-use rate of 5%.
Although the preceding review has used available literature to illustrate the effects of procedural differences on non-use rate, because the 26 studies differ across the multiple dimensions of response rate, type of investigator, type of clients surveyed, and time since fitting, the average non-use proportions indicated cannot be taken as reliable estimates for the relevant procedural issue.
The aim of this study was to report on the adoption, use, and non-use of hearing aids, using the results of national surveys repeatedly performed in Wales. The surveys were performed under conditions likely to give an answer that is representative of the truth in the population surveyed. That is, questions about hearing aid use are contained within a much larger, broader health survey; the questions are asked by a person not connected to service provision, those surveyed are chosen randomly, but representatively from the entire adult population, and the sample size is very large (reducing the effects of random sampling error). Further several of the questions have been administered annually for over a decade, enabling both trends and reliability to be determined. The Welsh Health Survey (WHS) has collected data on a wide range of health issues, contained in over one hundred questions (Doyle, Brown, and Alvariez (Citation2016); Sadler et al. Citation2012). Since 2004, it has contained questions on self-perceived hearing difficulty, adoption and use of hearing aids, and the occurrence of difficulty with hearing while wearing hearing aids. In 2016, the WHS was replaced by, and partially incorporated into, the annual National Survey for Wales (NSW Citation2016) which contains hundreds of questions on a wide variety of topics. The questions on hearing and hearing aid use were retained unchanged, albeit with some changes in the method of administration. The same questions were also included in the 2018 NSW survey, resulting in a record of responses stretching over 15 years. In Wales, hearing aids are available to patients free-of-charge from the National Health Service, although the most recent NSW indicates that 19% of respondents who possess hearing aids elected to purchase them from private sector providers (i.e. for a fee) instead of obtaining free ones from the National Health Service.
Methods
The WHS was administered annually from 2004 to 2015 to between 10,000 to 16,000 respondents aged 16 years or greater living in private residencies (but not institutions) in Wales. Households were chosen randomly but stratified by local areas so that the survey sample was representative of the adult population of Wales. An initial interview identified all members of the selected households. All adult members of the household were then invited to complete the full questionnaire, which was self-administered in pencil and paper form. The few questions on hearing involved the presence of hearing difficulties, and the use of hearing aids, as follows. Each question is preceded here by the identifying code used by the Welsh Office for National Statistics for that question and followed by the allowable response alternatives.
HearDiff
Do you have any difficulty with your hearing? Without a hearing aid if you usually wear one. [Yes/No/Don’t know]
HearAid
Do you usually wear a hearing aid? [Yes, most of the time/Yes, some of the time/No, but have tried one /No/Don’t know]
HearAidDiff
Do you have any difficulty with your hearing while wearing the aid? [Yes/No/Don’t know]
In the first year of the WHS, 74% of households responded to the survey request, and 85% of adults within responding households provided a survey. The effective response rate of individual adults was therefore 63%. By 2016, these response rates had altered only slightly to 76% of households and 77% of adults within responding households, giving a combined response rate of 59%.
In 2016, the NSW replaced the WHS as the Welsh Government’s source of health information. The questions on hearing that had been used in the WHS continued unchanged in the NSW, with the exception that the question labelled HearAidDiff was not administered in the 2018 NSW. Households were again randomly selected in a manner to make them representative of the population. A major difference, however, was that the questions were asked by a trained interviewer, who entered the responses into an automated system. Another difference from the WHS is that a single adult living in each household was chosen randomly to answer the questions.
The number of respondents varied between a low of 10,450 (for the NSW in 2016) to a high of 16,298 (for the WHS in 2004). The number who reported ever wearing or trying hearing aids (those who chose any of the first three responses to the HearAid question) varied from a low of 735 (for the NSW in 2016) to a high of 1130 (for the WHS in 2013).
In keeping with standard practice for such surveys, individual responses are weighted so that their effect on the total score is the same that would have been achieved if the households and individuals surveyed had the same distribution of demographic factors as the entire adult population (Helme and Brown Citation2018).
Results
Reported hearing difficulties
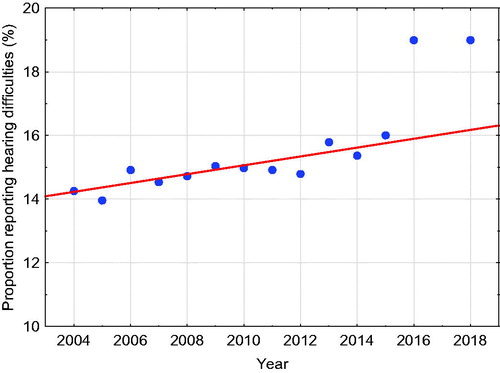
shows the proportion of the respondents who responded “Yes” to the question “Do you have difficulties with your hearing? (Without a hearing aid if you usually wear one).” In this and subsequent graphs, the year shown is that in which the survey was completed. The proportion of responders who report difficulty with hearing increased from 14% in 2004 to 16% in 2015. Regression of the proportion against the year of the survey for just the years of the WHS (2004 to 2015) indicates that the prevalence of reported hearing difficulties rose steadily and significantly (r = 0.86, p = 0.0003) with time at a rate of 0.14% per year. It is apparent that, as discussed later, the rates reported in the subsequent NSW (Citation2016) and NICE (Citation2018) are well outside the range of results found in the WHS.
Figure 1. Proportion of responders who report difficulty with their hearing. The line is the linear regression fitted to the data from the WHS (2004–2015). Note that in this and subsequent figures, a suppressed zero is used to enable the trends and fluctuations to be more easily seen.
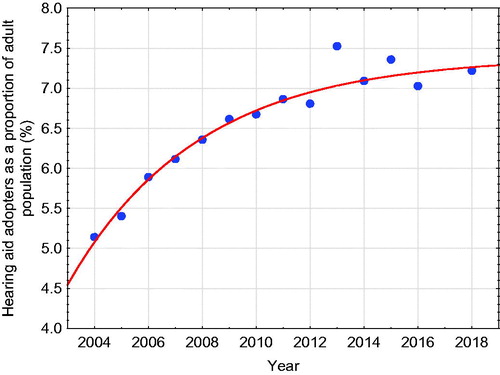
shows the proportion of responders in each survey who reported wearing or having tried one or more hearing aids. Unlike the question on hearing difficulties, the change in method of administration does not appear to have impacted on the proportion reporting that they are wearing, or have previously tried, hearing aids. After increasing for a decade, the proportion of the adult population who have tried hearing aids appears to be levelling off at around 7%.
Figure 2. Proportion of responders who report having ever tried one or more hearing aids, and fitted exponential regression line.
The proportion who wear or have ever tried hearing aids can alternatively be expressed as a proportion of those who report having hearing difficulties. The proportion increases smoothly from 36 to 46% during the 12 years of the WHS. However, the proportion then drops abruptly back to 37 and 38%, respectively during the 2 years of the NSW. As such dramatic decreases in the proportion of a population who have tried hearing aids can not occur within a 12 month period, this apparent change is presumably the result of more people reporting hearing difficulties in the NSW. The same issue occurs when those currently wearing hearing aids are expressed as a proportion of those who report hearing difficulties. This proportion rises smoothly from 29 to 38% during the 12 years of the WHS and then drops abruptly back to 30 and 32% during the 2 years of the NSW.
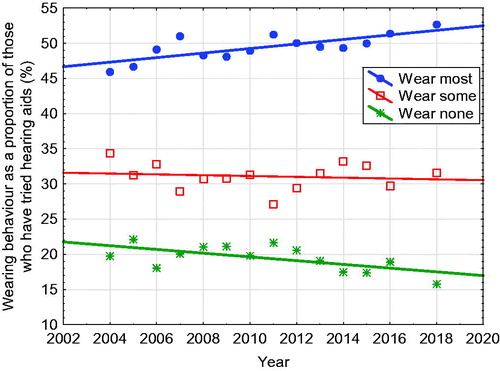
shows the proportion of people who wear and do not wear their hearing aids, as a proportion of those who have ever tried hearing aids. Averaged over the years of the survey, approximately 50% of respondents wear their hearing aids most of the time, 30% some of the time, and 20% never. The gradual increase in the proportion of those who mostly wear their hearing aids is significantly correlated with time (r = 0.74, p = 0.002), as is the decrease in the proportion of those who never wear their hearing aids (r = −0.64, p = 0.014). There was no significant change in the proportion who use their hearing aids some of the time (r = −0.11, p = 0.71).
Figure 3. People who report wearing their hearing aid(s) most of the time, some of the time, or not at all, as a proportion of those who have ever tried hearing aids.
The survey also asked those responders who wore hearing aids at least some of the time whether they had any difficulty with their hearing while wearing their hearing aid. The proportion answering “yes” was stable, varying randomly within the range 43–49% during the 11 years in which this question was asked.
Discussion
At first sight, the step increase from 16 to 19% in the proportion of people saying they had hearing difficulties in 2016 might be a cause for alarm. However, given the slow and smooth change in this proportion in the preceding years, it is much more likely that the change in data collection methodology has caused this change. Although it not clear why having an interviewer ask the question of a randomly selected adult in the household has produced a markedly higher proportion of responses than asking all adult members of the household to self-complete the survey. Possibly rapport with the interviewer has prompted more willingness to reveal a problem. Whatever the reason for the apparent change, it is not appropriate to draw any inference that the change reflects a real change in the population. This point has been made in relation to various other health statistics that showed discontinuities like this in the transition from the WHS to the NSW (Rees and Roberts Citation2018).
By contrast to the statistics on whether hearing difficulty is perceived, the responses related to hearing aid possession and use do not appear to have been affected by the change in survey methodology. Whether or not a hearing aid has ever been tried does not require a value judgment to answer, unlike whether difficulties in hearing (which every person must surely experience at least very occasionally) reach a level where the person considers that they have a hearing difficulty. It appears that currently, at least in Wales, around 7% of adults have at some time tried a hearing aid. The increase in ownership rate from 2004 to 2007 may perhaps have been the result of publicity associated with the introduction of digital hearing aids and the NHS hearing aid modernisation programme in Wales.
The most important finding in the study is that currently in this population, around 18% of those fitted with hearing aids never use them. Although this does represent a significant wastage of health resources, the percentage is smaller than the 30% of people who have been found in one large-scale survey to not take medications they have been prescribed for common, treatable, health conditions (Langley and Bush Citation2014), and much smaller than the 50% of people more generally found to not adhere to long-term therapies for a wide range of chronic conditions (Sabate Citation2003).
On the positive side, the proportion who never use their hearing aids has been gradually reducing during the 15 years that these surveys have been taking place. There has been a commensurate increase in the proportion who report using their hearing aids most of the time. Increased hearing aid use may reflect the progressive improvement of NHS care against nationally adopted Audiology service quality standards, encompassing improved devices, and on-going support for people fitted with hearing aids (Welsh Government Citation2016).
It is not possible to precisely interpret the finding that 31% of people report wearing their hearing aids “some of the time.” At one extreme, these might include people who wear them for several hours per day, on most days, in all the situations in which they experience any difficulty hearing. At the other extreme, they may include people who try their hearing aids only half-heartedly and occasionally, and who have considerable hearing difficulties that they are not using their hearing aids to help overcome. On the basis of these results alone, all we can say is that, in addition to the 18% who do not use their hearing aids at all, under-use of hearing aids occurs for an additional unknown proportion of people that is somewhere between 0 and 31% of those who receive them. Gatehouse (Citation1999) reported that 50% of aid wearers surveyed used their hearing aids for less than 70% of the time that they were in situations where they had some hearing difficulty. Given that this situation is much more likely to apply to “sometimes users” than to most-of-the-time users, it seems likely that most of the 31% of “sometimes users” were not using their devices in all the situations where they need help. The total proportion of people getting sub-optimal help from their hearing aids is therefore likely to be closer to 49% (i.e. 18 + 31) than it is to 18%. More specific questions, however, would be needed to better understand the reasons for part-time use.
Non-use, and under-use both represent missed opportunities. Hearing aid wearers and their families fail to get the hearing-related quality of life improvements that hearing aids can confer, including any downstream effects arising from reduced social isolation and possibly cognitive decline. People who have not tried hearing aids may also be disadvantaged if reports of non-use from others discourage or delay them from seeking help. Finally, non-use and low-use by some will lower the average benefit that hearing aids provide, potentially decreasing the resources that societies are willing to apply to hearing rehabilitation. This will become a greater problem as society ages, and competition for scarce health resources increases. There is some very limited evidence that developing self-management abilities, modifying attitudes, and/or enhancing service delivery can increase hearing aid use (Barker et al. Citation2016).
These statistics are particularly trustworthy and valuable in understanding the use of hearing aids for a number of reasons:
The number of respondents on which they are based is large, and the population has been sampled repeatedly over time, resulting in demonstrably reliable estimates. The survey is sufficiently reliable to show systematic trends in the use of hearing aids over time, reflecting the impact of changes in device quality or national service quality.
The sample has been chosen from the complete adult population, rather than being chosen based on people who have had contact with an audiological service provider within some defined period in the immediate past. This reduces potential bias associated with having an over-representation in the sample of people recently fitted with their first hearing aids.
Responses have been corrected to allow for demographic differences between the respondents and the entire adult population.
Although the survey response rates were only around 60%, people who had tried hearing aids presumably did not choose to participate based on whether they wore their hearing aids or not. This is because the survey was extensive and wide in scope, such that questions on hearing comprised only a tiny fraction of the survey questions. This reduces any bias associated with those who wore their hearing aids being more likely to respond.
The questions have been asked by a person and/or organisation that has no connection to the clinicians or organisation who delivered the service. This minimises acquiescence bias.
One limitation of the data reported here is that they were obtained from adults living in private residencies. It is possible, if not likely, that adults living in institutions, especially aged care homes, have different patterns of use from adults living in their own household. Census data indicate that 3.2% of the population of Wales age 65 years or older were residents in institutions (ONS Citation2011). A second limitation is that interpreting the boundary between “most of the time” and “some of the time” in relation to hearing aid use is likely to vary between respondents. As concluded by Perez and Edmonds (Citation2012), questions on usage where the response is expressed in hours per day would be less open to differences in interpretation, even if the reported usage is still not completely reliable.
A third limitation is that hearing aid use and non-use relied on self-report by the person involved. Numerous studies have shown that, on average, hearing aid wearers slightly over-estimate their average daily use (Brooks Citation1981; Haggard, Foster, and Iredale Citation1981; Laplante-Levesque et al. Citation2014; Maki-Torkko, Sorr, and Laukli Citation2001; Solheim and Hickson Citation2017; Taubman et al. Citation1999). It is not known whether this inaccuracy also applies to the simpler question of whether hearing aids are, or are not, being worn at all.
Returning to the overall benefits and cost of hearing aid provision to healthcare systems; non-use of hearing aids has been considered in modelling cost-effectiveness of hearing aids. Cost-utility analysis, assuming higher non-use rates than reported in this study, has concluded that hearing aids are cost-effective for managing hearing loss (NICE Citation2018).
Conclusions
A large-scale, repeated, robust survey has shown that around 18% of the adult Welsh population who have been fitted with hearing aids do not use them. A further 31% do not use them all of the time, and we expect that most of these are not being helped in at least some of the situations where they need help. The full-time or part-time use of hearing aid by 82% of those who try them supports the cost-effectiveness of hearing aid provision. Efforts to identify and address reasons for non-use and under-use are, however, urgently needed. This may include new methods of helping people adapt to their hearing aids or otherwise support their on-going use, and/or making hearing aids better adapt to the listening situations they are used in. The inclusion of standardised questions related to hearing aid usage, embedded within regular national surveys, could allow health systems to monitor access to and efficacy of interventions for hearing impaired adults at a national level.
Declaration of interest
None of the authors disclose any financial interest in the results reported in this paper.
Acknowledgments
Collection and compilation of the survey data were performed by Health, Social Services and Population Statistics, Wales, UK. We are grateful to Cath Roberts of the Welsh Government for advice on the data.
Additional information
Funding
References
- Aazh, H., D. Prasher, K. Nanchahal, and B. C. Moore. 2015. “Hearing-Aid Use and Its Determinants in the UK National Health Service: A Cross-Sectional Study at the Royal Surrey County Hospital.” International Journal of Audiology 54 (3): 152–161. doi:10.3109/14992027.2014.967367.
- Archbold, S., B. Lamb, C. O’Neill, and J. Atkins. 2014. The real cost of adult hearing loss. https://www.heartogether.org.uk/research/adult-strategy-reports/the-real-cost-of-adult-hearing-loss-2014.Accessed 6 May 2020.
- Barker, F., E. Mackenzie, L. Elliott, S. Jones, and S. de Lusignan. 2016. “Interventions to Improve Hearing Aid Use in Adult Auditory Rehabilitation.” The Cochrane Database of Systematic Reviews 8: CD010342. doi:10.1002/14651858.CD010342.pub3.
- Bennett, R. J., A. Laplante-Levesque, C. J. Meyer, and R. H. Eikelboom. 2018. “Exploring Hearing Aid Problems: Perspectives of Hearing Aid Owners and Clinicians.” Ear and Hearing 39 (1): 172–187. doi:10.1097/AUD.0000000000000477.
- Bertoli, S., K. Staehelin, E. Zemp, C. Schindler, D. Bodmer, and R. Probst. 2009. “Survey on Hearing Aid Use and Satisfaction in Switzerland and Their Determinants.” International Journal of Audiology 48 (4): 183–195. doi:10.1080/14992020802572627.
- Bisgaard, N., and S. Ruf. 2017. “Findings from EuroTrak Surveys from 2009 to 2015: Hearing Loss Prevalence, Hearing Aid Adoption, and Benefits of Hearing Aid Use.” American Journal of Audiology 26 (3S): 451–461. doi:10.1044/2017_AJA-16-0135.
- Brannstrom, K. J., and I. Wennerstrom. 2010. “Hearing Aid Fitting Outcome: clinical Application and Psychometric Properties of a Swedish Translation of the International Outcome Inventory for Hearing Aids (IOI-HA).” Journal of the American Academy of Audiology 21 (8): 512–521. doi:10.3766/jaaa.21.8.3.
- Breidablik, H. J. 1998. “Hearing Aids among the Elderly--Not Only in the Drawer!” Tidsskrift for Den Norske Laegeforening : Tidsskrift for Praktisk Medicin, ny Raekke 118 (9): 1414–1416.
- Brink, R. H. S., H. P. van den Wit, G. I. J. M. Kempen, and M. G. J. Heuvelen. 1996. “Attitude and Help-Seeking for Hearing Impairment.” British Journal of Audiology 30 (5): 313–324. doi:10.3109/03005369609076779.
- Brooks, D. 1981. “Use of Post-Aural Aids by National Health Service Patients.” British Journal of Audiology 15 (2): 79–86. doi:10.3109/03005368109081419.
- Chisolm, T. H., C. E. Johnson, J. L. Danhauer, L. J. P. Portz, H. B. Abrams, S. Lesner, P. A. McCarthy, and C. W. Newman. 2007. “A Systematic Review of Health-Related Quality of Life and Hearing Aids: Final Report of the American Academy of Audiology Task Force on the Health-Related Quality of Life Benefits of Amplification in Adults.” Journal of the American Academy of Audiology 18 (2): 151–183. doi:10.3766/jaaa.18.2.7.
- Dillon, H. 2007. Usage of hearing aids by responders and non-responders. Paper presented at the Hearing Services Ministerial Consultative Committee, Canberra.
- Dillon, H., E. Koritschoner, J. Battaglia, R. Lovegrove, J. Ginis, G. Mavrias, L. Carnie et al. 1991. “Rehabilitation Effectiveness II: Assessing the Outcomes for Clients of a National Hearing Rehabilitation Program.” Australian Journal of Audiology 13 (2): 68–82.
- Dillon, H. 2012. Hearing Aids. New York, NY: Thieme.
- Dillon, H., G. Birtles, and R. Lovegrove. 1999. “Measuring the Outcomes of a National Rehabilitation Program: Normative Data for the Client Oriented Scale of Improvement (COSI) and the Hearing Aid User’s Questionnaire (HAUQ).” Journal of the American Academy of Audiology 10 (2): 67–79.
- Doyle, M., L. Brown, and P. C. Alvarez. 2016. Welsh Health Survey 2015: Technical report. Retrieved from Accessed 6 May 2020.
- Ferguson, M. A., P. T. Kitterick, L. Y. Chong, M. Edmondson-Jones, F. Barker, and D. J. Hoare. 2017. “Hearing Aids for Mild to Moderate Hearing Loss in Adults.” The Cochrane Database of Systematic Reviews 9: CD012023. doi:10.1002/14651858.CD012023.pub2.
- Gatehouse, S. 1999. “Glasgow Hearing Aid Benefit Profile: Derivation and Validation of a Client-Centered Outcome Measure for Hearing Aid Services.” Journal of the American Academy of Audiology 10 (2): 80–103.
- Gianopoulos, I., D. Stephens, and A. Davis. 2002. “Follow up of People Fitted with Hearing Aids after Adult Hearing Screening: The Need for Support after Fitting.” British Medical Journal 325 (7362): 471. doi:10.1136/bmj.325.7362.471.
- Gimsing, S. 2008. “Use of Hearing Aids Five Years after Issue.” Ugeskrift for Laeger 170 (43): 3407–3411.
- Hartley, D., E. Rochtchina, P. Newall, M. Golding, and P. Mitchell. 2010. “Use of Hearing Aids and Assistive Listening Devices in an Older Australian population.” Journal of the American Academy of Audiology 21 (10): 642–653. doi:10.3766/jaaa.21.10.4.
- Hickson, L., S. Clutterbuck, and A. Khan. 2010. “Factors Associated with Hearing Aid Fitting Outcomes on the IOI-HA.” International Journal of Audiology 49 (8): 586–595. doi:10.3109/14992021003777259.
- Haggard, M., J. Foster, and F. Iredale. 1981. “Use and Benefit of Postaural Aid in Sensory Hearing Loss.” Scandinavian Audiology 10 (1): 45–52. doi:10.3109/01050398109076161.
- Helme, M., and Z. Brown. 2018. National Survey for Wales 2017-18 Technical Report. https://gov.wales/sites/default/files/statistics-and-research/2019-07/national-survey-for-wales-april-2018-to-march-2019-technical-report_0.pdf
- Kochkin, S. 2009. “MarkeTrak VIII: 25-Year Trends in the Hearing Health Market.” Hearing Review 16 (11): 12–31.
- Kochkin, S. 2005. “MarkeTrak VII: Customer Satisfaction with Hearing Aids in the Digital Age.” The Hearing Journal 58 (9): 30–37. doi:10.1097/01.HJ.0000286545.33961.e7.
- Langley, C. A., and J. Bush. 2014. “The Aston Medication Adherence Study: Mapping the Adherence Patterns of an inner-city population.” International Journal of Clinical Pharmacy 36 (1): 202–211. doi:10.1007/s11096-013-9896-3.
- Laplante-Levesque, A., C. Nielsen, L. D. Jensen, and G. Naylor. 2014. “Patterns of Hearing Aid Usage Predict Hearing Aid Use Amount (Data Logged and Self-Reported) and Overreport.” Journal of the American Academy of Audiology 25 (2): 187–198. doi:10.3766/jaaa.25.2.7.
- Lupsakko, T. A., H. J. Kautiainen, and R. Sulkava. 2005. “The Non-Use of Hearing Aids in People Aged 75 Years and over in the City of Kuopio in Finland.” European Archives of Oto-Rhino-Laryngology, 262 (3): 165–169. doi:10.1007/s00405-004-0789-x.
- Maki-Torkko, E. M., M. J. Sorr, and E. Laukli. 2001. “Objective Assessment of Hearing Aid Use.” Scandinavian Audiology. Supplementum 52: 81–82.
- Mathers, C., A. Smith, and M. Concha. 2000. “Global Burden of Hearing Loss in the Year 2000.” Global Burden of Disease 18 (4): 1–30.
- McCormack, A., and H. Fortnum. 2013. “Why Do People Fitted with Hearing Aids Not Wear Them?” International Journal of Audiology 52 (5): 360–368. doi:10.3109/14992027.2013.769066.
- NICE. 2018. Hearing Loss In Adults: Assessment and Management, NICE guideline [NG98], Appendix N: Cost-Effectiveness Analysis: Early Versus Delayed Management of Hearing Loss. https://www.nice.org.uk/guidance/ng98/evidence/appendices-as-pdf-4852693118
- NSW. 2016. National Survey for Wales. Retrieved from https://gov.wales/hearing-and-eye-care-national-survey-wales-april-2016-march-2017. Accessed 17 February 2020.
- ONS 2011. Official labour market statistics. Retrieved from https://www.nomisweb.co.uk/census/2011. Accessed 6 May 2020
- Parving, A., and P. Sibelle. 2001. “[Users' Experiences with Modern Hearing Aids. An Audit].” Ugeskrift for Laeger 163 (13): 1857–1862.
- Perez, E., and B. A. Edmonds. 2012. “A Systematic Review of Studies Measuring and Reporting Hearing Aid Usage in Older Adults since 1999: A Descriptive Summary of Measurement Tools.” PLoS One 7 (3): e31831. doi:10.1371/journal.pone.0031831.
- Popelka, M. M., K. J. Cruickshanks, T. L. Wiley, T. S. Tweed, B. E. Klein, and R. Klein. 1998. “Low Prevalence of Hearing Aid Use among Older Adults with Hearing Loss: The Epidemiology of Hearing Loss Study.” Journal of the American Geriatrics Society 46 (9): 1075–1078. doi:10.1111/j.1532-5415.1998.tb06643.x.
- Rees, R., and C. Roberts. 2018. Discontinuities in Results for Health-Related Lifestyle and General Health between the Welsh Health Survey and National Survey for Wales. https://gov.wales/sites/default/files/statistics-and-research/2019-02/discontinuities-results-health-related-lifestyle-general-health-between-welsh-health-survey-national-survey-wales-2018.pdf.Accessed 19 December 2019.
- Sabate, E. 2003. Adherence to Long-Term Therapies: Evidence for Action. Geneva, Switzerland: World Health Organization.
- Sadler, K., M. Doyle, D. Hussey, K. Pickering, and R. Stafford. 2012. “Welsh Health Survey 2011.” London: NatCen Social Research 13.
- Solheim, J., and L. Hickson. 2017. “Hearing Aid Use in the Elderly as Measured by Datalogging and self-report.” International Journal of Audiology 56 (7): 472–479. doi:10.1080/14992027.2017.1303201.
- Stark, P., and L. Hickson. 2004. “Outcomes of Hearing Aid Fitting for Older People with Hearing Impairment and Their Significant Others.” International Journal of Audiology 43 (7): 390–398. doi:10.1080/14992020400050050.
- Stephens, D., P. Lewis, and A. Davis. 2004. “The Epidemiology of Hearing Problems: How Should we Investigate It?” Acta Oto-Laryngologica 124 (552): 11–15. doi:10.1080/03655230410017553.
- Takahashi, G., C. D. Martinez, S. Beamer, J. Bridges, D. Noffsinger, K. Sugiura, G. W. Bratt, and D. W. Williams. 2007. “Subjective Measures of Hearing Aid Benefit and Satisfaction in the NIDCD/VA Follow-up Study.” Journal of the American Academy of Audiology 18 (4): 323–349. doi:10.3766/jaaa.18.4.6.
- Taubman, L. B., C. V. Palmer, J. D. Durrant, and S. Pratt. 1999. “Accuracy of Hearing Aid Use Time as Reported by Experienced Hearing Aid Wearers.” Ear and Hearing 20 (4): 299–305. doi:10.1097/00003446-199908000-00003.
- Uriarte, M., L. Denzin, A. Dunstan, J. Sellars, and L. Hickson. 2005. “Measuring Hearing Aid Outcomes Using the Satisfaction with Amplification in Daily Life (SADL) Questionnaire: Australian Data.” Journal of the American Academy of Audiology 16 (6): 383–402. doi:10.3766/jaaa.16.6.6.
- Vuorialho, A., M. Sorri, I. Nuojua, and A. Muhli. 2006. “Changes in Hearing Aid Use over the past 20 Years.” European Archives of Oto-Rhino-Laryngology 263 (4): 355–360. doi:10.1007/s00405-005-1007-1.
- Welsh Government. 2016. Quality Standards for Adult Hearing Rehabilitation Services. https://gov.wales/sites/default/files/publications/2019-10/quality-standards-for-adult-hearing-rehabilitation-services.pdf
- Welsh Government. 2019. NHS Expenditure Programme Budgets, 2017-18. https://gov.wales/nhs-expenditure-programme-budgets-april-2017-march-2018. Accessed 6 May 2020.
- Wilson, C., and D. Stephens. 2003. “Reasons for Referral and Attitudes toward Hearing Aids: do They Affect Outcome?” Clinical Otolaryngology and Allied Sciences 28 (2): 81–84. Retrieved from 12680823 doi:10.1046/j.1365-2273.2003.00669.x.