
Abstract
Objective
To investigate electrically evoked auditory cortical responses (eACR) elicited from the stimulation of intracochlear electrodes based on individually fitted stimulation parameters in cochlear implant (CI) users.
Design
An eACR setup based on individual fitting parameters is proposed. A 50-ms alternating biphasic pulse train was used to stimulate apical, medial, and basal electrodes and to evoke auditory cortical potentials (N1-P2 complex).
Study sample
The eACR setup proposed was validated with 14 adult CI users.
Results
Individual and grand-average eACR waveforms were obtained. The eACR amplitudes were lower in the basal than in the apical and medial regions. Earlier N1 latencies were found in CI users with lower maximum comfortable loudness levels and shorter phase duration in response to apical stimulation, while medial and basal stimulation resulted in earlier N1 latencies and larger N1-P2 amplitudes in users with longer CI experience.
Conclusions
eACR could be elicited by direct intracochlear stimulation using individual fitting parameters with a success rate of 71%. The highest cortical peak-to-peak amplitudes were obtained in response to apical stimulation. Unlike the P2, the N1 component appeared to be a consistent cortical potential to determine eACR and gain knowledge of the auditory processing beyond the cochlea in CI users.
eACR can be elicited through direct stimulation of intracochlear electrodes.
Stimulation of apical and medial regions yielded the highest N1-P2 amplitudes.
CI users with lower maximum comfortable loudness levels had shorter N1 latencies during apical stimulation.
The present dataset of mainly well-performing CI users suggests better cortical processing, that is, higher amplitudes and shorter latencies of N1.
The N1 potential appears a more consistent and reliable potential than the P2 to determine eACR responses in CI users.
Highlights
Introduction
Cochlear implant (CI) use allows children and adults with severe-to-profound hearing loss to develop or restore hearing (Wilson and Dorman Citation2008). Current CI fitting procedures are mainly based on a behavioural approach in which electric pulses are sent to the intracochlear electrodes until the user reports their thresholds (THR) and maximum comfortable loudness levels (MCL). The difference between the MCL and the THR value is the user’s electric dynamic range (EDR), which, along with other parameters, constitutes their clinical fitting map (Banda González, Castillo, and Lee Citation2017). Nevertheless, this behavioural approach is difficult to use with very young children and adults who are unable to provide reliable verbal responses. Therefore, considerable research efforts have been directed towards optimising CI fitting procedures through electrophysiological measures. These provide specific subject-level information that can guide the fitting process in a more objective way (Finke, Billinger, and Büchner Citation2017). However, some measures commonly used in clinical practice, such as the electrically evoked stapedius reflex threshold (Kosaner et al. Citation2018), the electrically evoked compound action potential (He, Teagle, and Buchman Citation2017), or the electrically evoked auditory brainstem response (Bahmer, Polak, and Baumann Citation2010), are peripheral measures that do not account for the entire auditory pathway (Lundin, Stillesjö, and Rask-Andersen Citation2015; Scheperle and Abbas Citation2015). The fact that some users exhibit a delayed response or more limited benefit with their CI indicates that there might be some central processing mechanisms, in addition to the peripheral ones, that are responsible for the overall CI performance (Glennon, Svirsky, and Froemke Citation2020; Han et al. Citation2019).
Cortical auditory evoked potentials (CAEP) have often been used to assess the neural response evoked by auditory stimuli in the cortex. Typical CAEPs are a series of peaks (P1, N1, P2), which are interpreted as the cortical response to acoustic stimuli (Cañete, Citation2014; Abbas and Brown Citation2015). In fact, CAEPs correlate strongly with hearing thresholds and speech perception tests in adult and paediatric CI users (Mao et al. Citation2018; Legris et al. Citation2018; Sharma et al. Citation2016; Guo et al. Citation2016; Shafer, Yu, and Wagner Citation2015). Thus, they have been suggested as a helpful tool to objectively evaluate auditory cortical maturation and development of auditory skills in CI users (Brown et al. Citation2015; Sharma et al. Citation2015; Mcneill, Sharma, and Purdy Citation2009; Polonenko et al. Citation2017; Parry et al. Citation2019; Távora-Vieira et al. Citation2018). Although the majority of CAEP studies presented acoustic signals through loudspeakers in a free field, some authors have investigated the use of electrically evoked cortical auditory responses (eACR) through direct stimulation of intracochlear electrode channels. The latter avoids the effect of bank filtering and signal distribution over multiple stimulated electrodes, and it therefore presents some advantages, such as a more precise stimulation pattern and better control of the stimulation parameters and timing via the software. Moreover, it guarantees that the contralateral ear is not simultaneously stimulated, therefore simplifying the removal of CI artefacts (Friesen and Picton Citation2010; Sinkiewicz, Friesen, and Ghoraani Citation2017; Mathew et al. Citation2018).
Previous studies have used eACR to assess cortical plasticity and to measure the sensitive period of auditory development in CI users. For instance, by stimulating electrodes with 36-ms biphasic pulse trains, significant implant-driven plasticity was demonstrated in the auditory cortices of children with asymmetric hearing loss (Polonenko, Papsin, and Gordon Citation2019). Other authors have also analysed the feasibility of using eACR to objectively determine behavioural thresholds and comfort levels in CI users. Visram et al. (Citation2015) used 50-ms biphasic pulse trains with amplitudes ranging from 20 to 100% EDR over different electrodes to collect eACR signals. The amplitude growth functions of the global field power were highly correlated with the behavioural thresholds, whereas the comfort levels could not be inferred due to a large variability among participants. Mao et al. (Citation2019) also found the eACR growth functions to be highly correlated with the behavioural thresholds for both a standard EEG montage (Cz to mastoid) and a montage with the recording channels close to the CI. However, the correlation with the behavioural comfort levels was only moderate.
Recent studies have also focussed on optimising the stimulation parameters for recording eACR in CI users (Kranick et al. Citation2021), analysing the influence of different electrode sites and stimulation conditions on eACR signals, and assessing correlations with speech perception tests (Liebscher, Alberter, and Hoppe Citation2018). Kranick et al. (Citation2021) found significantly higher N1-P2 amplitudes for increased stimulus levels (MCL versus 50% EDR), whereas the position of the electrode (apical, medial, basal) or the duration of the stimuli did not have a significant effect on the eACR morphology. In contrast, Liebscher, Alberter, and Hoppe (Citation2018) found significantly higher eACR amplitudes for the apical than for the medial and basal electrodes. They also found that larger N1-P2 amplitudes corresponded to longer inter-stimulus intervals (ISIs). Monosyllabic word recognition scores were shown to correlate with larger N1 and N1-P2 amplitudes at the medial electrodes, which, in turn, were associated with stronger cortical activation and neuronal recruitment. Additionally, word recognition scores were correlated negatively with the P2 latency at the apical electrodes, suggesting that prolonged P2 latencies (i.e. a longer processing time) may be associated with poorer speech understanding in CI users.
The eACR techniques represent a promising approach to better understanding implant-driven cortical mechanisms. However, possibly due to methodological differences, the results reported in the literature are heterogeneous. Open questions remain about the correlation between eACR and behavioural measures and their applicability in a clinical setting. We hypothesise that, if eACR are successfully recorded and correlated with individual fitting map settings, they can be used to validate and predict behavioural fitting parameters, which are especially useful for people unable to provide consistent responses. The primary objective of our study was to verify that eACR can be collected using individual stimulation parameters from the behavioural fitting map in a group of MED-EL CI users, including very high pulse rates (2500–10,000 pps) at the apical electrodes under the FS4-p strategy (Riss et al. Citation2014). The secondary objective was to analyse the relationship between individual stimulation parameters (e.g. charge level, phase duration, and burst rate) and the electrophysiological eACR responses obtained in the same group of CI users. Differences in the eACR responses at different electrode sites (apical, medial, and basal) were also investigated.
Materials and methods
Participants
Fourteen participants (11 females and 3 males) with a mean age of 53.4 ± 15.1 years (range 24‒76 years) took part in the study. All participants had post-lingual severe-to-profound hearing loss and were unilateral CI users (mean 3.6 ± 2.1 years of CI use, range 0.83–8.33). See for further demographic information.
Table 1. Demographic data.
The participants’ mean auditory thresholds in free-field aided pure tone audiometry were 28 ± 6 dB HL at 500 Hz, 31 ± 5 dB HL at 1000 Hz, 29 ± 5 dB HL at 2000 Hz and 30 ± 5 dB HL at 4000 Hz. The mean recognition score among participants was 72 ± 11% for disyllabic words (Cárdenas and Marrero Citation1994), all using the FS4-p sound coding strategy.
The study was approved by the Ethics Committee of the Hospital Universitario Virgen Macarena in Seville, Spain (PEIBA #2059-N-18). All participants gave their informed consent.
Clinical fitting
Electrode field impedances and behavioural MCL values were measured prior to the eACR recordings. Default 50-ms monopolar biphasic pulses were delivered using the MAX programming interface and the MAESTRO 8.0.2 software (MED-EL GmbH, Innsbruck, Austria) to the apical (E2), medial (E6), and basal (E10) electrodes during clinical fitting. The FS4-p coding strategy provides fine structure processing at the four apical electrodes, where the electrical stimulus is aligned at the zero crossing of the low-frequency input signal (Riss et al. Citation2014) to a variable stimulation rate on these electrodes.
Measurement of eACR
Stimuli
Fifty-millisecond electrical stimuli were delivered the same way as during the clinical fitting (the setup is shown in Supplementary Appendix A). They were alternating biphasic pulses, sent in consecutive cycles of bursts. The phase duration and the rate of the biphasic pulses corresponded to the individual fitting parameters of the user’s fitting map, at a level corresponding to 90% of their MCL values. The pulses had a standard inter-phase gap of 2.1 µs. The rate of the biphasic pulses delivered to the apical channels was aligned with that used in the FS4-p strategy. The frequency of repetition of each burst cycle was defined as the inter-stimulus interval (ISI). Previous studies have found larger eACR signals when increasing the ISI from 300 to 5000 ms (Liebscher, Alberter, and Hoppe Citation2018), particularly at the apical and medial electrodes. To reach a trade-off between the eACR amplitude and recording time, an ISI of 1000 ms was chosen in this study.
EEG recording
EEG was recorded with a two-channel Nicolet EDX Synergy system with a sampling rate of 48,000 Hz (Natus Medical Incorporated®, Pleasanton, CA, USA). A three-electrode clinical montage was used with the active electrode (+) at Fz, the reference electrode (−) on the contralateral mastoid, and the ground electrode (G) in the lower part of the forehead (Fpz). The impedance of the electrodes was kept below 4 kΩ. The amplifier range was set to 200 μV and the pre-amplifier filters were set to 30 Hz (low pass) and 1 Hz (high-pass). Time frames (epochs) from −150 to 600 ms were used. Each epoch corresponded to a single stimulus burst cycle, therefore, an external trigger pulse was required to synchronise the stimulus signal with the averaging analysis of the EEG system. To guarantee the reproducibility of the eACR response and to avoid cortical habituation, the stimuli were delivered, and the epochs were collected in 3–4 different replications, which were subsequently averaged to improve the signal-to-noise ratio. Each run consisted of 30 stimuli (i.e. 90–120 epochs in total per stimulus condition), sent to a single electrode (E2, E6, or E10) at a stimulation level of 90% MCL. To minimise myogenic artefacts, participants were asked to sit comfortably in a reclining chair while watching a muted video with subtitles. Artefact rejection was set to ± 80 µV. Finally, to minimise the CI electrical artefact in the EEG recordings, the reference electrode was located at the contralateral mastoid, and EEG recording cables were placed as far away from the CI device and the stimulating coil cable as possible (Liebscher, Alberter, and Hoppe Citation2018). To reduce polarity-dependent artefacts, stimuli were presented with alternating polarity (Mao et al. Citation2019). The total test duration for each participant was less than 1 hour.
Data analysis
The EEG baseline was corrected by the Synergy software, then exported and further processed in Matlab R2018a (Mathworks®, Natick, Massachusetts, USA). Exported data were smoothed and denoised using a moving average filter. Individual grand-average waveforms were obtained by averaging the eACR responses and used to interpret the waveform morphology and latencies of individual responses. Individual eACR latency of N1 and P2 (ms) and the N1-P2 inter-peak amplitude (μV) were considered as “replicable” responses when the averaged EPs revealed (1) the same morphology (i.e. the typical biphasic N1-P2 complex as known as the typical cortical detection component in adults), (2) showed reproducible amplitudes, and (3) reproducible latencies. The cortical N1 component was defined as a negative peak within the time window between 50 and 120 ms post-stimulus presentation; the cortical P2 component was defined as a positive peak between 150 and 250 ms post-stimulus. All raw and averaged data have been automatically analysed post hoc by a Matlab script for each electrode, and, in conformity with current clinical audiological practice, additionally verified and subjectively interpreted by at least two experienced clinicians with extensive clinical and research expertise in the interpretation of auditory EPs. By applying very strict and stringent criteria, we have tried to optimally reduce any inter-rater variability, with the aim to keep the dataset as homogenous as possible. For each electrode site, only data of which clinicians were 100% sure that they showed reproducibility, were included in the final analyses. On the other hand, such strict criteria not only helped keep our data “clean” from suggestive individual (mis)interpretations, but also reduced the total number of useful observations. A repeated-measures ANOVA and Bonferroni-corrected post-hoc pairwise tests were used to compare the eACR amplitudes and latencies between the apical, medial, and basal electrodes. Differences in the fitting stimulation parameters (MCL, electrode impedances, phase duration, and pulse rate) were also analysed. Finally, the correlation between the eACR morphology (N1-P2 amplitude and latencies) and individual fitting parameters was assessed using Pearson’s correlation test. All results were considered significant at p < 0.05. Only significant correlations are reported in the Results section. All other correlations analysed can be consulted in Supplementary Appendix B.
Results
Clinical fitting data
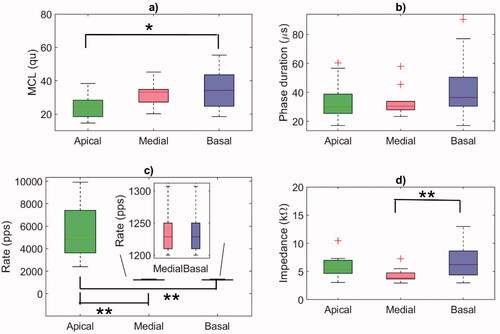
The distribution of the individual fitting parameters, namely the MCL values, phase duration, and the rate of the biphasic pulses delivered to the electrodes, are shown in . These individual parameters were later used to generate the eACR-eliciting stimuli. The mean MCL was highest at the basal electrode (34.5 ± 11.2 qu), followed by the medial (31.7 ± 6.7 qu), and the apical electrodes (24.6 ± 7.6 qu). A one-way ANOVA showed a statistically significant difference between the electrodes (F(2, 39) = 4.78, p = 0.0139). Post-hoc comparisons using the Bonferroni correction showed that the mean MCL at the apical electrode was significantly lower than at the basal electrode (p = 0.0140), with no significant differences between the apical and the medial (p = 0.1152) or between the medial and the basal electrode (p = 1) (). The highest mean phase duration of 44.7 µs was found at the basal electrode, although an ANOVA did not reveal any significant differences between the electrodes (F(2, 39) = 2.13, p = 0.1321) (). The stimulation rates were significantly different between the electrodes (F(2, 39) = 37.43, p < 0.0001), because the FS4-p coding strategy used in the fitting map mimics fine structure information, providing significantly higher stimulation rates in the range of 2400–9917 pps at the apical electrodes (). The electrode impedance was significantly different between the electrodes (F(2, 39) = 6.02, p = 0.0053) (). Specifically, the basal electrode exhibited significantly higher impedance than the medial electrode (p = 0.004).
Figure 1. Boxplots showing the distribution of individual fitting parameters at the apical, medial, and basal electrodes used for eliciting eACR. (a) Maximum comfortable loudness level (MCL) values in charge units (1 qu equals approximately 1 nC). (b) Phase duration (µs). (c) Rate of the biphasic pulses (pps) (the pulse rate at the medial and basal electrodes was lower than at the apical electrodes and is shown in a close-up box with a different y-axis). (d) Electrode impedance (kΩ). Horizontal lines represent the mean value of the 14 CI users, the crosses represent outliers. Statistics: ANOVA + Bonferroni multiple comparison test. *p < 0.05; **p < 0.01.
Morphology of eACR
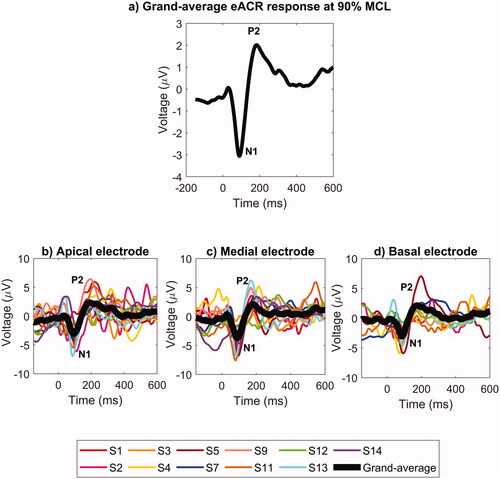
Eleven out of fourteen participants demonstrated reproducible eACR. The eACR of the remaining three participants (S6, S8, S10) were not consistent and reproducible, so they were excluded from the analysis. The responses were obtained at 90% of the individual behavioural MCL. The eACR responses averaged across participants and electrodes are shown in . The individual eACR waveforms at each electrode are shown in . An example of a typical individual eACR response containing three different within-subject replications for each apical, medial, and basal electrode can also be seen in Supplementary Appendix C. At a group level, the morphology of the N1-P2 eACR response was easily recognisable at each of the three electrodes. We detected eACR responses for all participants at the apical electrode (n = 11). We were not able to quantify the N1-P2 amplitude for participants S1 and S14 at the basal electrode, and for participant S3 at the medial electrode.
Figure 2. Top panel: (a) Grand-averages of eACR responses for 11 participants who had reproducible eACR, averaged across the three electrodes. Bottom panels: Individual (coloured curves) and total grand-average (black curves) eACR waveforms at different electrodes: (b) apical, (c) medial and (d) basal. Stimulation level was at 90% MCL.
Relationship between eACR responses and stimulation site
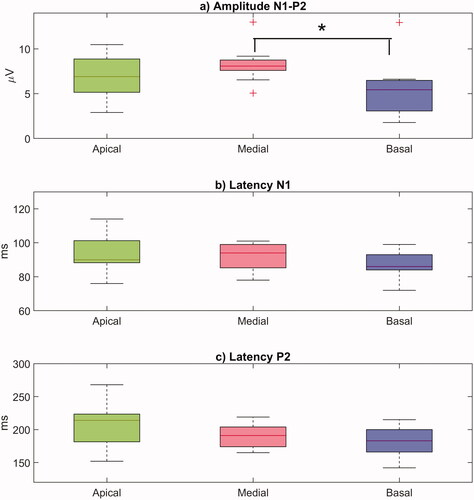
The distributions of individual N1-P2 amplitudes and latencies obtained at each electrode are shown in . The highest mean eACR amplitude was measured at the medial electrode (8.3 ± 2.1 µV), followed by the apical (6.8 ± 2.4 µV), and the basal electrode (5.5 ± 3.2 µV). Although the effect of the electrode site on individual N1-P2 amplitudes was not statistically significant according to a one-way repeated measures ANOVA (F(2, 27) = 2.73, p = 0.0830), a two-sample t-test showed that the amplitudes at the basal electrode were significantly smaller than those at the medial electrode (t = 2.23, p = 0.0392). A t-test did not show any significant differences in the amplitudes between the apical and the medial (t = 1.49, p = 0.1524) or between the apical and the basal electrodes (t = −1.05, p = 0.3089) (). The mean N1 latency was 94 ± 11 ms at the apical, 91 ± 8 ms at the medial, and 88 ± 8 ms at the basal electrode (). The mean P2 latency was 206 ± 11 ms at the apical, 189 ± 19 ms at the medial, and 182 ± 23 ms at the basal electrode. A one-way repeated measures ANOVA did not show any significant differences between the electrodes either for the N1 latency (F(2, 27) = 1.28, p = 0.2943), or for the P2 latency (F(2, 27) = 2.345, p = 0.1151) ().
Figure 3. Boxplots showing the distribution of individual values for (a) the N1-P2 eACR amplitudes (µV), (b) the latency of the N1 peak (ms), and (c) the latency of the P2 peak (ms) measured at the apical, medial, and basal electrodes. The horizontal lines represent mean values, the crosses represent outliers. Statistics: two-sample t-tests. *p < 0.05.
Relationship between eACR responses and clinical fitting parameters
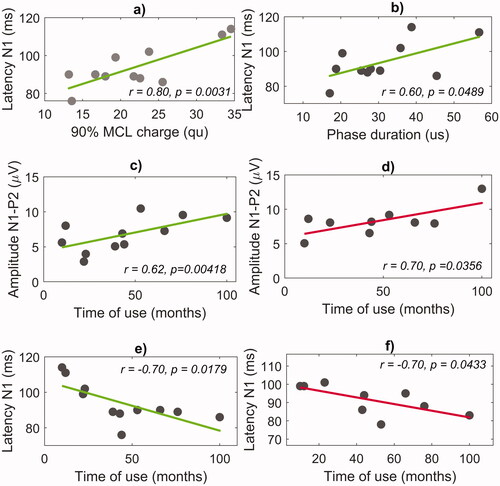
The N1 latency at the apical electrode had a significant positive correlation with both the MCL (r = 0.80, p = 0.0031) () and the phase duration (r = 0.60, p = 0.0489) (). No correlation between the N1 latency and the MCL was observed at the medial and the basal electrode. No correlation between the individual fitting parameters and the N1-P2 amplitudes or P2 latencies was found, either.
Figure 4. Correlation between the eACR parameters, the individual fitting parameters and time of CI use. The panels in the top row show the correlation of the N1 latency at the apical electrode with (a) the charge levels corresponding to 90% MCL and with (b) the phase duration. The panels in the second row show the correlation of the N1-P2 amplitudes with the time of CI use at (c) the apical and (d) the medial electrodes. The panels in the third row show the correlation of the N1 latency with the time of CI use at (e) the apical and (f) the medial electrodes.
Relationship between eACR responses and time of CI use
The N1-P2 amplitude had a significant positive correlation with the time of CI use at the apical (r = 0.62, p = 0.0418) () and the medial electrode (r = 0.70, p = 0.0356) (). The N1 latency had a significant negative correlation with the time of CI use at the apical (r = −0.70, p = 0.0179) () and the medial electrode (r = −0.70, p = 0.0433) (). Interestingly, no correlations were found at the basal electrode. The P2 latency did not correlate with the time of CI use at any of the three electrodes.
Discussion
In contrast with previous studies that used generalised stimulation parameters, we propose an eACR setup based on individual clinical fitting data. Different methods and stimulation parameters used in the literature and in our study are reviewed in Supplementary Appendix D. However, data of three participants were excluded from further analyses because of a lack of reproducibility of their cortical potentials, the fact that patients were restless and, in consequence, that they revealed a poor signal-to-noise ratio in their running EEG. Nevertheless, reproducible eACR responses were successfully obtained from 11 out of 14 participants in this study. The typical N1-P2 morphology was recognisable when the responses were averaged across participants and electrodes. The average N1 and P2 latencies observed in this study fell within the range reported in the literature for adults with normal hearing and CI users (50–120 ms for N1 and 150–250 ms for P2) (Cañete Citation2014; Mao et al. Citation2019; Firszt et al. Citation2002). Our data also shows that the N1 seems to be a consistent and stable cortical peak for auditory detection. In contrast to the P2 component, the N1 component was clearly recognised in 78.6% of the total number of observations. The variability in N1 peak latency was less compared to P2 peak latencies, with a mean latency of 91.1 ± 9.4 ms and 192.8 ± 27.5 ms for N1 and P2, respectively (see also ). This consistency also corresponds to the fact that the N1 component originated from pure exogenous bottom-up processing in contrast to the P2 component, which consists of a combination of exo- and endogenous (top-down) neural processing mechanisms (Cranford et al. Citation2004).
Relationship between eACR responses and stimulation site
In this study, the N1-P2 amplitudes were significantly lower in the basal region than in the medial region, while no differences were observed between other sites. Results reported in the literature are mixed. Kranick et al. (Citation2021) did not find any differences in the eACR amplitude at different cochlear sites, whereas Liebscher et al. (Citation2018) found a significant decline in the response amplitude from the apex to the base, which did not depend on the ISIs. Similarly, Visram et al. (Citation2015) found significantly lower eACR amplitudes in the basal region. They also reported that participants felt uncomfortable sensations during basal stimulation, therefore lower charge levels were applied to these electrodes, possibly explaining the lower N1-P2 amplitudes. The amplitude reduction from the apex to the base has also been associated with a higher number of residual functional auditory neurons in the apical region (Visram et al. Citation2015; Liebscher, Alberter, and Hoppe Citation2018). In our study, lower eACR amplitudes were detected at the basal electrodes even though they were stimulated with larger charge levels. We did not see, however, a gradual decline of the eACR amplitudes from the apex to the base, which might be explained by the relatively small variance in amplitudes at the medial electrode and the relatively large variance at the apical electrode. Similar to Kranick et al. (Citation2021), the N1 and P2 latencies in our study were not different along the cochlea.
Relationship between eACR responses and fitting parameters
Using the same 50-ms burst duration for both eACR measurement and clinical fitting allowed a direct comparison between them. Longer stimuli used in clinical fitting by some CI manufacturers may have the disadvantage of producing an overlap of the CI electrical artefact with the neural response. For instance, Visram et al. (Citation2015) obtained significantly lower thresholds for the 500-ms fitting stimuli than for the 50-ms eACR-eliciting stimuli. Therefore, the amplitude growth functions of global field power for eACR signals correlated strongly (r = 0.93, p < 0.0001) with the behavioural thresholds at 50-ms bursts, but the correlation between the eACR and the behavioural thresholds at 500-ms bursts could not be proved. Kranick et al. (Citation2021) reported non-significant differences in the eACR morphology at different burst durations of 50, 100 and 150 ms, possibly explained by the fact that the amplitude had been adjusted to achieve the same perceived loudness. Previous studies have also investigated the relationship between eACR and behavioural comfort levels, which was either moderate (r = 0.50, p < 0.024) (Mao et al. Citation2019) or could not be inferred from the amplitude growth functions due to a large variability among subjects (Visram et al. Citation2015). In our study, the eACR amplitudes did not correlate with the level of electric charge delivered to the electrodes. However, a significant positive correlation was observed between the N1 latencies and the electric charge delivered to the apical region. A smaller, but still significant association, was also seen for the phase duration at the same electrode site. This finding may be in line with a previous study that associated lower comfort charge levels with larger neuronal populations in the apical region (Liebscher, Alberter, and Hoppe Citation2018). However, the present statistical findings should be interpreted with some caution. The aim of the present study was not to investigate a potential superiority of applying individual personalised settings, but merely the feasibility of it for clinical application, since it reflects a similar manner of stimulation as in patients’ daily life. After all, a general preference for using individual parameter settings to assess cortical processing would require more extensive research in a larger, but also less homogenous population consisting of poor as well as good performers.
Relationship between eACR responses and time of CI use
The amplitude of the eACR responses obtained at the apical and medial electrodes was positively correlated with the time of CI use. The N1 latencies were negatively correlated with the time of CI use, which may indicate an increase in neural processing (i.e. shorter latencies) due to electrical stimulation. These outcomes suggest that eACR may serve as an objective marker of accommodation to electrical stimulation or even learning effects and cortical plasticity. Since only a limited number of CI users is involved, the wider implementation of eACR electrophysiological measures in longitudinal studies might allow us to better understand the timing of CI accommodation and its implications at the cortical level. This would help to objectively assess the sensitive period for optimising CI fitting and follow-up in children and adults.
Limitations, open issues, and future directions
Previous studies have reported difficulties registering eACR in participants who found it difficult to stay alert because their EEG signals were contaminated with eye-blink artefacts resistant to rejection (Visram et al. Citation2015). Liebscher et al. (Liebscher, Alberter, and Hoppe Citation2018) also reported that peak detectability depended strongly on the ISI and the stimulation electrode tested. In our study, the preliminary results obtained from 14 CI users showed that eACR responses can be measured at both individual and group levels, with an overall success rate of 71.4% (78.6% for apical electrode, 71.4% for medial electrode, and 64.3% for basal electrode). More research efforts are still needed to design more accurate and robust eACR methodologies that can be efficiently used in routine clinical practice.
One technical limitation of registering EEG in CI users is the electrical CI artefact that can obscure the eACR response, often making the recognition of the N1-P2 response impossible. Depending on the burst duration, the CI artefact can partly or completely overlap with the N1-P2 response, thus preventing the use of longer burst durations often used during clinical fittings (Visram et al. Citation2015). We decided to place the contralateral reference electrode and the EEG cables far away from the CI and the coil cable. This setup, together with the short 50-ms stimuli with alternating polarity, may have helped prevent CI artefacts in our study. However, depending on the stimulation parameters and the EEG hardware/software used, additional processing steps may be applied to successfully separate the neural response from the CI artefact. They include subtraction techniques (Friesen and Picton Citation2010), spatial filtering (Mathew et al. Citation2018), and wavelet-based methods (Sinkiewicz, Friesen, and Ghoraani Citation2017).
Conclusion
Our preliminary results indicate that eACR can be elicited by direct intracochlear stimulation using the individual CI fitting parameters, with a relatively high success rate of 71%. In contrast to intracochlear basal stimulation, the highest cortical peak-to-peak amplitudes are obtained in response to apical stimulation. Unlike the P2, the N1 component appeared to be a consistent and reliable cortical potential to determine eACR and help improve our understanding of the auditory processing beyond the cochlea in CI subjects.
Author contributions
Conceptualisation: M.A.C.-L., M.M.B.-R, A.K, S.S.-G.; Methodology: M.A.C.-L., M.M.B.-R, A.K, A.J.B.; Formal analysis and investigation: M.A.C.-L., M.M.B.-R; Writing: M.A.C.-L., M.M.B.-R, A.K; Original draft preparation: M.A.C.-L., M.M.B.-R; Writing, review and editing: M.A.C.-L., M.M.B.-R, A.K, A.J.B.; Funding acquisition: S.S.-G.; Resources: S.S.-G., A.K; Supervision: A.J.B.
Supplemental Material
Download MS Word (39.2 KB)Supplemental Material
Download MS Word (301.9 KB)Supplemental Material
Download MS Word (25.7 KB)Supplemental Material
Download MS Word (680.5 KB)Acknowledgements
We would like to thank the CI users who volunteered their time and the staff of Hospital Universitario Virgen Macarena for their help in carrying out the eACR recordings. We also thank Giacomo Mandruzzato (MED-EL) for his helpful comments and Angelina Gurkina (MED-EL) and David Plant for language and style help on a version of this manuscript.
Disclosure statement
No potential conflict of interest was reported by the author(s).
Data availability statement
Data available on request from the authors.
Additional information
Funding
References
- Abbas, P. J., and C. J. Brown. 2015. “Assessment of Responses to Cochlear Implant Stimulation at Different Levels of the Auditory Pathway.” Hearing Research 322: 67–76. doi:10.1016/j.heares.2014.10.011.
- Bahmer, A., M. Polak, and U. Baumann. 2010. “Recording of Electrically Evoked Auditory Brainstem Responses after Electrical Stimulation with Biphasic, Triphasic and Precision Triphasic pulses.” Hearing Research 259 (1–2): 75–85. doi:10.1016/j.heares.2009.10.003.
- Banda González, R. I., S. C. Castillo, and G. R. Lee. 2017. “Fitting Parameters for Cochlear Implant.” Boletín Médico Del Hospital Infantil de México 74 (1): 65–69. doi:10.1016/J.BMHIME.2017.11.016.
- Brown, C. J., E. K. Jeon, L.-K. Chiou, B. Kirby, S. A. Karsten, C. W. Turner, P. J. Abbas, et al. 2015. “Cortical Auditory Evoked Potentials Recorded from Nucleus Hybrid Cochlear Implant Users.” Ear and Hearing 36 (6): 723–732. doi:10.1097/AUD.0000000000000206.
- Cañete, O. M. 2014. “Cortical Auditory Evoked Potentials: P1-N1-P2 Complex and Their Clinical Applications.” Revista de otorrinolaringología y cirugía de cabeza y cuello 74 (3): 266–274. doi:10.4067/S0718-48162014000300012
- Cárdenas, M. R., and V. Marrero. 1994. Cuaderno de Logoaudometría, Guía de Referencia Rápida. Vol. 129. Logrono, Spain: Universidad Internacional de Educación a Distancia.
- Cranford, J. L., A. K. Rothermel, L. Walker, A. Stuart, and S. Elangovan. 2004. “Effects of Discrimination Task Difficulty on N1 and P2 Components of Late Auditory Evoked Potential.” Journal of the American Academy of Audiology 15 (6): 456–461. doi:10.3766/JAAA.15.6.6.
- Finke, M., M. Billinger, and A. Büchner. 2017. “Toward Automated Cochlear Implant Fitting Procedures Based on Event-Related Potentials.” Ear and Hearing 38 (2): e118–e127. doi:10.1097/AUD.0000000000000377.
- Firszt, J. B., R. D. Chambers, N. Kraus, and R. M. Reeder. 2002. “Neurophysiology of Cochlear Implant Users I: Effects of Stimulus Current Level and Electrode Site on the Electrical ABR, MLR, and N1-P2 Response.” Ear and Hearing 23 (6): 502–515. doi:10.1097/00003446-200212000-00002.
- Friesen, L. M., and T. W. Picton. 2010. “A Method for Removing Cochlear Implant artifact.” Hearing Research 259 (1–2): 95–106. doi:10.1016/J.HEARES.2009.10.012.
- Glennon, E., M. A. Svirsky, and R. C. Froemke. 2020. “Auditory Cortical Plasticity in Cochlear Implant Users.” Current Opinion in Neurobiology 60: 108–114. doi:10.1016/j.conb.2019.11.003.
- Guo, Q., Y. Li, X. Fu, H. Liu, J. Chen, C. Meng, M. Long, et al. 2016. “The Relationship between Cortical Auditory Evoked Potentials (CAEPs) and Speech Perception in Children with Nurotron® Cochlear Implants during Four Years of Follow-Up.” International Journal of Pediatric Otorhinolaryngology 85: 170–177. doi:10.1016/J.IJPORL.2016.03.035.
- Han, J.-H., H.-J. Lee, H. Kang, S.-H. Oh, and D. S. Lee. 2019. “Brain Plasticity Can Predict the Cochlear Implant Outcome in Adult-Onset Deafness.” Frontiers in Human Neuroscience 13: 38. doi:10.3389/fnhum.2019.00038.
- He, S., H. F. B. Teagle, and C. A. Buchman. 2017. “The Electrically Evoked Compound Action Potential: From Laboratory to Clinic.” Frontiers in Neuroscience 11: 339. doi:10.3389/fnins.2017.00339.
- Kosaner, J., P. Spitzer, S. Bayguzina, M. Gultekin, and L. A. Behar. 2018. “Comparing eSRT and eCAP Measurements in Pediatric MED-EL Cochlear Implant Users.” Cochlear Implants International 19 (3): 153–161. doi:10.1080/14670100.2017.1416759.
- Kranick, M., L. Wagner, S. Plontke, and T. Rahne. 2021. “Optimizing Stimulation Parameters to Record Electrically Evoked Cortical Auditory Potentials in Cochlear Implant Users.” Cochlear Implants International 22 (3): 121–127. doi:10.1080/14670100.2020.1850032.
- Legris, E., J. Galvin, S. Roux, M. Gomot, J.-M. Aoustin, M. Marx, S. He, et al. 2018. “Cortical Reorganization after Cochlear Implantation for Adults with Single-Sided Deafness.” PLOS One 13 (9): e0204402. doi:10.1371/journal.pone.0204402.
- Liebscher, T., K. Alberter, and U. Hoppe. 2018. “Cortical Auditory Evoked Potentials in Cochlear Implant Listeners via Single Electrode Stimulation in Relation to Speech Perception.” International Journal of Audiology 57 (12): 933–940. doi:10.1080/14992027.2018.1514469.
- Lundin, K., F. Stillesjö, and H. Rask-Andersen. 2015. “Prognostic Value of Electrically Evoked Auditory Brainstem Responses in Cochlear Implantation.” Cochlear Implants International 16 (5): 254–261. doi:10.1179/1754762815Y.0000000005.
- Mao, D., H. Innes-Brown, M. A. Petoe, Y. T. Wong, and C. M. McKay. 2018. “Cortical Auditory Evoked Potential Time-Frequency Growth Functions for Fully Objective Hearing Threshold Estimation.” Hearing Research 370: 74–83. doi:10.1016/J.HEARES.2018.09.006.
- Mao, D., H. Innes-Brown, M. A. Petoe, Y. T. Wong, and C. M. McKay. 2019. “Fully Objective Hearing Threshold Estimation in Cochlear Implant Users Using Phase-Locking Value Growth Functions.” Hearing Research 377: 24–33. doi:10.1016/J.HEARES.2019.02.013.
- Mathew, R., D. Vickers, P. Boyle, A. Shaida, D. Selvadurai, D. Jiang, J. Undurraga, et al. 2018. “Development of Electrophysiological and Behavioural Measures of Electrode Discrimination in Adult Cochlear Implant Users.” Hearing Research 367: 74–87. doi:10.1016/J.HEARES.2018.07.002.
- Mcneill, C., M. Sharma, and S. C. Purdy. 2009. “Are Cortical Auditory Evoked Potentials Useful in the Clinical Assessment of Adults with Cochlear Implants?” Cochlear Implants International 10 (1): 78–84. doi:10.1179/cim.2009.10.Supplement-1.78.
- Parry, L. v., M. R. D. Maslin, R. Schaette, D. R. Moore, and K. J. Munro. 2019. “Increased Auditory Cortex Neural Response Amplitude in Adults with Chronic Unilateral Conductive Hearing impairment.” Hearing Research 372: 10–16. doi:10.1016/j.heares.2018.01.016.
- Polonenko, M. J., B. C. Papsin, and K. A. Gordon. 2019. “Cortical Plasticity with Bimodal Hearing in Children with Asymmetric Hearing Loss.” Hearing Research 372: 88–98. doi:10.1016/j.heares.2018.02.003.
- Polonenko, M. J., K. A. Gordon, S. L. Cushing, and B. C. Papsin. 2017. “Cortical Organization Restored by Cochlear Implantation in Young Children with Single Sided Deafness.” Scientific Reports 7 (1): 16900. doi:10.1038/s41598-017-17129-z.
- Riss, D., J.-S. Hamzavi, M. Blineder, C. Honeder, I. Ehrenreich, A. Kaider, W.-D. Baumgartner, et al. 2014. “FS4, FS4-p, and FSP: A 4-Month Crossover Study of 3 Fine Structure Sound-Coding Strategies.” Ear and Hearing 35 (6): e272–e281. doi:10.1097/AUD.0000000000000063.
- Scheperle, R. A., and P. J. Abbas. 2015. “Peripheral and Central Contributions to Cortical Responses in Cochlear Implant Users.” Ear and Hearing 36 (4): 430–440. doi:10.1097/AUD.0000000000000143.
- Shafer, V. L., Y. H. Yu, and M. Wagner. 2015. “Maturation of Cortical Auditory Evoked Potentials (CAEPs) to Speech Recorded from Frontocentral and Temporal Sites: Three Months to Eight Years of Age.” International Journal of Psychophysiology 95 (2): 77–93. doi:10.1016/J.IJPSYCHO.2014.08.1390.
- Sharma, A., H. Glick, A. Sharma, and H. Glick. 2016. “Cross-Modal Re-Organization in Clinical Populations with Hearing Loss.” Brain Sciences 6 (1): 4. doi:10.3390/brainsci6010004.
- Sharma, A., H. Glick, E. Deeves, and E. Duncan. 2015. “The P1 Biomarker for Assessing Cortical Maturation in Pediatric Hearing Loss: A Review.” Otorinolaringologia 65 (4): 103–114.
- Sinkiewicz, D., L. Friesen, and B. Ghoraani. 2017. “A Novel Method for Extraction of Neural Response from Single Channel Cochlear Implant Auditory Evoked Potentials.” Medical Engineering & Physics 40: 47–55. doi:10.1016/j.medengphy.2016.11.009.
- Távora-Vieira, D., A. Wedekind, R. Marino, S. C. Purdy, and G. P. Rajan. 2018. “Using Aided Cortical Assessment as an Objective Tool to Evaluate Cochlear Implant Fitting in Users with Single-Sided Deafness.” PLOS One 13 (2): e0193081. doi:10.1371/journal.pone.0193081.
- Visram, A. S., H. Innes-Brown, W. El-Deredy, and C. M. McKay. 2015. “Cortical Auditory Evoked Potentials as an Objective Measure of Behavioral Thresholds in Cochlear Implant Users.” Hearing Research 327: 35–42. doi:10.1016/J.HEARES.2015.04.012.
- Wilson, B. S., and M. F. Dorman. 2008. “Cochlear Implants: A Remarkable past and a Brilliant Future.” Hearing Research 242 (1–2): 3–21. doi:10.1016/j.heares.2008.06.005.