
Abstract
Objective
Hearing aids are typically programmed using the individual’s audiometric thresholds and verified using real-ear measures. Developments in technology have resulted in a new category of direct-to-consumer devices, which are not necessarily programmed using the individual’s audiometric thresholds. This review aimed to identify whether programming hearing aids using the individual’s validated audiogram-based prescription, and verified using real-ear measures, results in better outcomes for adults with hearing loss.
Design
The review was registered in PROSPERO and reported in accordance with PRISMA guidelines.
Study sample
After screening more than 1370 records, seven experimental studies met the eligibility criteria.
Results
Studies were categorised under three methods of fitting: (i) comparative fitting evaluating different settings based on the beliefs of the audiologist; (ii) client choice of preset responses; and (iii) self-fit by adjustment. The findings suggest that using a prescription based on the individual’s audiogram improves outcomes relative to the comparative and client choice fitting approaches. Self-adjustment during daily use may produce equivalent (or better) outcomes than an audiogram-based prescription. The quality of evidence for the outcomes ranged from low to very low.
Conclusions
This review has highlighted the dearth of high-quality studies on which to make evidence-based decisions on hearing aid fitting methods.
Introduction
Hearing loss is a debilitating health condition that affects more than 450 million individuals worldwide (World Health Organization Citation2020). It is also the most common cause for years lived with disability (World Health Organization Citation2018). Hearing loss can directly affect people’s ability to communicate with ease, which can lead to poor social interaction, loneliness and depression (Davis et al. Citation2007). It is also associated with a reduced quality of life and an increased risk of dementia (Thyer et al. Citation2018).
Hearing aids are the primary intervention for permanent hearing loss and have been shown to improve hearing-related quality of life (Kochkin Citation2009; Ferguson et al. Citation2017). The goals for hearing aids are to restore the audibility of low level sounds, maximise the intelligibility of conversational-level sounds and ensure that intense sounds are within comfortable levels (Munro and Mueller Citation2016).
In the early 1940s and 1950s, the most controversial aspects of clinical audiology were hearing aid selection and programming, as experts could not agree upon the most appropriate approaches (Nance and Causey Citation1968). Since this period, prescriptive approaches have evolved to provide recommended gains for each audiometric frequency and input level. The concept of hearing aid prescriptions goes back to the early 1940s when Jones and Knudsen (Citation1938) developed the audiogram mirroring prescription procedure, in which every decibel (dB) of loss was compensated with an additional dB of gain. The prescription was then developed by Watson and Knudsen (1940) to incorporate the individual’s most comfortable level. Shortly after, Lybarger (Citation1944) developed the half-gain rule, in which every additional 2 dB of hearing loss were compensated with an additional 1 dB of gain (Lybarger Citation1944). Since then, many other prescription procedures have been developed, but very few of them have been comprehensively studied and validated. The continuous development and improvement of prescription procedures has led to the wide acceptance of hearing aid prescriptions (Dillon Citation2001; Mueller Citation2015).
Several research groups have developed validated audiogram-based prescription methods and the most commonly used prescriptions are the National Acoustic Laboratories Non-Linear (NAL-NL1 and NAL-NL2; Byrne et al. Citation2001; Keidser et al. Citation2011) and the Desired Sensation Level (DSL5.0; Scollie et al. Citation2005). These and other prescription formulae and associated methods of measuring amplification aimed to provide the optimal amount of amplification for each audiometric frequency and input level (Byrne et al. Citation2001; Moore et al. Citation2010; Keidser et al. Citation2012). Both NAL and DSL procedures have been revised and updated multiple times based on a combination of theoretical derivation and empirical data (Scollie et al. Citation2005; Keidser et al. Citation2012). Our recent review and meta-analysis on this topic (Almufarrij et al. Citation2021a) revealed that the combination of validated prescription methods and probe-tube real-ear verification resulted in statistically significant benefits over manufacturers’ approximation of prescription methods.
Numerous direct-to-consumer hearing devices have been mass-produced and marketed to customers. Although these hearing devices vary considerably in quality, a few have electroacoustics comparable to those of conventional hearing aids that are programmed and fitted by audiologists (Almufarrij et al. Citation2019). Moreover, some of these hearing devices allow consumers to use their smartphone or remote controls to adjust the amplification characteristics according to their preferences (Sabin et al. Citation2020). Allowing users to take control of their amplification characteristics may help them achieve a response that they prefer to one based on prescription targets that reflect what is optimal for an average person who has the same audiogram as that individual user. In addition, individuals with hearing loss may prefer different amplification characteristics for different acoustic environments (Keidser Citation1995; Scollie et al. Citation2010; Walravens et al. Citation2020), in ways that vary beyond the variation prescribed by existing non-linear prescription formula. Alternatively, imprecision in adjustments made by the individual, or an inadequately adjusted hearing aid, may result in poorer outcomes than one adjusted by a clinician on the basis of the individual’s audiogram.
It is timely to investigate whether the use of individually prescribed amplification characteristics, using audiogram-based prescription formulae, and verified using real-ear probe microphone measurements, provides better outcomes than using amplification characteristics set using a different procedure (e.g. users choose from amongst a small group of alternative responses, or users adjust the amplification characteristics of their device based on their preferences). Mueller (Citation2005) systematically reviewed studies that compared audiogram-based prescriptions with each other or with the same prescription but with the user’s adjustment to the overall gain. Direct-to-consumer hearing devices that allow users to fine-tune the amplification characteristics without audiometric thresholds were not widely available at the time of Mueller’s review. Thus, the aim of this review was to identify whether the outcomes for adults are better when hearing aids are programmed using audiogram-based prescription formulae.
Methods
This review protocol was registered in International Prospective Register of Systematic Reviews (PROSPERO; CRD42020197232) and published in BMJ Open (Almufarrij et al. Citation2021b). The method of this systematic review is reported in line with the Preferred Reporting Items for Systematic Review and Meta-Analyses (PRISMA) guidelines (Moher et al. Citation2009).
Eligibility criteria
The eligibility criteria of this review were specified and described in line with the participants, interventions, comparators, outcomes and study designs (PICOS) criteria (Richardson et al. Citation1995; Shamseer et al. Citation2015).
Participants
Participants were adults (≥ 18 years) with any defined degree and type of hearing. Studies that reported only qualitative descriptions of age and hearing thresholds were also included.
Interventions
The intervention of interest was amplification devices (i.e. conventional hearing aids, direct-to-consumer hearing devices or simulated hearing aids) that had not been programmed using the individual user’s hearing thresholds.
Comparators
Comparators included amplification devices (i.e. conventional hearing aids, direct-to-consumer hearing devices or simulated hearing aids) programmed to an audiogram-based prescription target (e.g. NAL-NL2) and verified using a real-ear measurement system. Implantable devices, assistive listening devices and bone conduction hearing devices were excluded. Studies using different hearing devices for the intervention and comparator were also excluded, as differences in technology, features and appearance could serve as serious confounding variables.
Outcomes
Our choice of primary outcome was listening preference because it put patients at the centre of their care, as they are best at judging the intelligibility, quality and comfort of different fitting approaches. Secondary outcomes were hearing-specific health-related quality of life (e.g. Hearing Handicap Inventory for the Elderly; Ventry and Weinstein Citation1982), self-reported listening ability (e.g. the Speech, Spatial and Qualities of Hearing Scale; Gatehouse and Noble Citation2004), speech intelligibility of words and sentences in quiet and noisy situations, sound quality ratings and adverse events (e.g. discomfort, hearing aid rejection and noise-induced hearing loss). Studies that only quantify the deviation from the prescriptive targets were excluded. Studies that used only predicted speech intelligibility (speech intelligibility index) as an outcome were also excluded.
Study designs
Randomised, non-randomised controlled trials, and cross-over designs peer-reviewed published studies were included. Conference abstracts, book chapters and theses were excluded. Case reports, reviews and clinical guidelines were also excluded.
Information sources
A systematic search strategy was conducted to identify published and completed but unpublished studies. The following databases were searched: EMBASE, MEDLINE, PubMed, PsycINFO, Web of Science, Cochrane Library, Emcare and Academic Search Premier. All databases were searched on 23 August 2020 with no search restrictions in relation to the publication’s year, status and language. To ensure that this review included the most recent evidence, the searches were repeated at the final write-up stage.
The reference lists of the studies selected for inclusion in the review were scanned to identify other relevant studies. We also tracked citations of the studies using Google Scholar to identify additional relevant articles.
Search strategy
A medical information specialist developed the search protocol in consultation with the review team. The search terms were developed based on free text, expert opinions and controlled terms (e.g. Medical Subject Headings). The search strategies were iteratively tested to ensure they captured all the relevant studies that the review team were aware of. The search protocol for each of the databases is reported in Supplement Table 1.
Data management
The records from the search results were extracted to EndNote X9 Reference Management software (Clarivate Analytics, 2018) to automatically remove duplicated records. Study details (i.e. authors, publication year, titles and abstracts) were then transformed into a Microsoft Excel (2016) spreadsheet so that they could be easily assessed for inclusion and exclusion criteria.
Selection process
Two of the review team independently screened the title and abstract of all retrieved studies to determine their eligibility for inclusion. The reason for excluding any article was documented. Articles that met the inclusion criteria were retrieved for a full inspection. The same two authors screened the articles against the eligibility criteria. The study selection process, along with the main reasons for exclusion, is illustrated in a PRISMA flow diagram (see the Results section).
Data collection process and data items
The first author extracted the data from all eligible studies. Another member of the review team independently extracted the data to check for consistency. On the rare occasion (i.e. <5%) where there was a disagreement, it was resolved by discussion. An online extraction tool (WebPlotDigitizer) was used to extract data that were only available in figures and graphs.
Risk of bias in individual studies
Methodological quality was assessed using the Downs and Black (Citation1998) checklist because it has acceptable validity and reliability, and can be used with randomised and non-randomised studies. This tool provides numeric scores for each of the following domains: study quality, external validity, study bias, confounding, selection bias and statistical power of the study. In this review, the score for the power domain (i.e. question number 27) was reduced from three points to one point because there is a dearth of knowledge about the clinically important differences in hearing aid outcomes (Maidment et al. Citation2018; Almufarrij et al. Citation2021a, Citation2021b). A score of one for this domain was awarded if a sample size calculation was made and a score of zero was awarded if it was not. However, if no power analysis was performed but the sample size was commensurate with the other studies for which one was performed, the study was not penalised. Thus, the maximum possible score was 28 and the quality of each study was categorised as excellent (26–28), good (20–25), fair (15–19) or poor (<14; Hooper et al. Citation2008). The assessment of the risk of bias was carried out independently by all authors. Disagreements were resolved by discussion.
Data analysis
The data were synthesised into a meta-analysis (albeit of limited size) in cases where two or more studies measured the same outcome for a similar intervention. The standardised mean difference for the studies combined was calculated along with the 95% confidence interval (CI). All effect estimates were corrected using Hedges's g. Data from different study designs (i.e. between- and within-group) were combined after transferring their effect sizes to the same metric (i.e. standardised mean difference) and ensuring that their effect sizes estimated the same treatment effect. For studies that used multiple validated tools to measure the same outcome, multiple within-study conditions, or measured the same outcome at different time points, a composite effect size was calculated using the method described in Borenstein et al. (Citation2009). The formulae used are reported in Supplement Table 2. For the primary outcome of listening preference, the difference in proportion between those preferring each condition was calculated and reported. The 95% CI around the proportion difference was computed by arcsine transforming the original percentages, and calculating the 95% CI with transformed values. The back-transformed values were reported in this review. A fixed-effect meta-analysis was computed whenever the statistical heterogeneity was low; otherwise, the data were synthesised using a random-effect meta-analysis. The generic inverse of variance approach was used to weight each study and hence compute the effect estimate and its 95% CI. The data for each meta-analysis are presented in a forest plot (see the Results section).
Assessment of reporting bias
Publication bias is well known in academic research (i.e., insignificant results are less likely to be published; Kyzas et al. Citation2007; Turner et al. Citation2008). Despite our intention to assess publication bias (based on funnel plots of precision), this was not possible because we had far fewer studies available for each intervention type than the minimum of ten that is recommended (Matthew et al. Citation2019).
Assessment of heterogeneity
The variability across studies was assessed using the I2 statistic for each outcome (Higgins and Green Citation2008). Heterogeneity was categorised as either low, medium or high when I2 was 0–40%, 41–60% or 61–100%, respectively. In addition, a chi-squared test was performed to assess the statistical significance of the identified heterogeneity.
Dealing with missing data
Missing data were obtained by contacting the studies’ corresponding authors. Missing means and SDs were estimated from the median, minimum and maximum scores, when reported, using formulae described by Wan et al. (Citation2014). Missing correlation coefficients were estimated from the other studies and sensitivity analyses were performed to examine the impact of such estimation (Borenstein et al. Citation2009).
Confidence in cumulative estimate
The Grading of Recommendations, Assessment, Development and Evaluations tool (GRADE) was used to rate the overall evidence of each outcome. The assigned rating (i.e. high, moderate, low or very low) reflects our confidence of the pooled estimate; that is, high-quality evidence implies that the pooled estimates are probably very close to the true effect of the intervention. Conversely, very low-quality evidence implies that the pooled estimate is likely to be substantially different from the true effect and further research is needed to strengthen our confidence in the pooled effect. The initial quality ratings for randomised and non-randomised trials were assessed as high and low, respectively. Cross-over designs, where each participant acts as their own control, were initially assessed as high quality provided cross-over order was counterbalanced across participants. The assigned rating was upgraded or downgraded by one or two points based on the seriousness of multiple factors. Notably, three factors may upgrade the quality of evidence: (i) large effect size; (ii) dose–response gradient (e.g. the magnitude of the participants’ preference for the audiogram-based approach [comparator] increased when the deviation from the prescribed target decreased); and (iii) plausible confounding factors that likely have reduced the effect observed (e.g. participants preferred the amplification characteristics for the audiogram-based approach [comparator] over the other approaches [intervention] even when more advanced features were exclusively activated with the intervention). Meanwhile, study limitations, inconsistency, indirectness and imprecision are factors that could reduce our confidence in the pooled estimates. The overall quality rating for each outcome was presented in an overall quality rating table utilising the GRADEpro online tool (https://gradepro.org/). Two members of the review team independently graded the overall quality of each outcome. Disagreements were resolved through discussion.
Results
Search and selection of studies
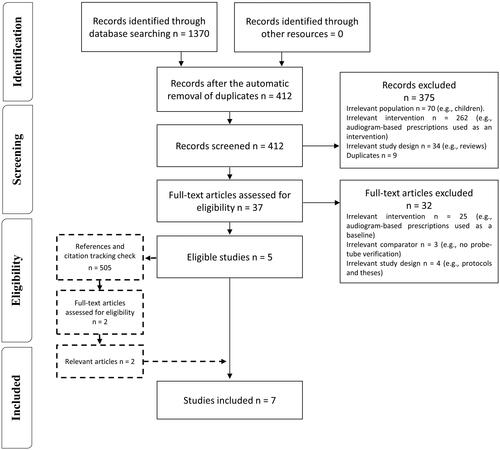
shows the flow diagram of the selection process based on PRISMA. Searching the databases retrieved 1370 records, of which 958 duplicates were removed. Of the remaining 412 records, 375 were discarded based on the titles and abstracts because they were irrelevant to the review question. Of the remaining 37 articles, 32 were discarded because they used an irrelevant intervention, comparator or study design. Screening the reference lists and citation tracking yielded an additional 505 records, 503 of which were removed after screening, leaving two studies that were fully inspected and found to be relevant. The number of studies identified from each database are reported in Supplement Table 3.
Figure 1. Flow diagram of the selection process based on the Preferred Reporting Items for Systematic Reviews and Meta-Analyses (PRISMA). Note: n: number of studies; REM: real-ear measurement; HA: hearing aids.
Study characteristics
summarises the study characteristics. All studies were published from 2008 onwards. Four studies used a between-groups design (Metselaar et al. Citation2008; Metselaar et al. Citation2009; Humes et al. Citation2017; Sabin et al. Citation2020), two used a prospective sequential design (Humes et al. Citation2019; Reed et al. Citation2019), and the remaining study used a crossover design (Urbanski et al. Citation2021). Five of the studies were conducted in the United States (Humes et al. Citation2017, Citation2019; Reed et al. Citation2019; Sabin et al. Citation2020; Urbanski et al. Citation2021) and the remaining two in the Netherlands (Metselaar et al. Citation2008, Citation2009). The mean participant age ranged from 55 to 71 years. The sex distribution of the participants was reported in all studies, and approximately two-thirds were female. Studies primarily involved participants with sensorineural hearing loss, and all but two predominantly recruited new hearing aid users. The two exceptions involved both new and experienced hearing aid users (Metselaar et al. Citation2008, Citation2009).
Table 1. Study characteristics.
Outcomes
The outcome measures used in the studies are reported in Supplement Table 4. Our choice of primary outcome, listening preference, was reported in only one study (Sabin et al. Citation2020). Of the secondary outcomes, each of hearing-related quality of life, self-reported listening ability, speech intelligibility under quiet conditions and under noisy conditions and sound quality were measured in two or more studies. No studies used adverse events as an outcome measure. The collection time for the outcomes ranged from the fitting session (e.g. Reed et al. Citation2019) to 6 months post-fitting (Metselaar et al. Citation2009).
Interventions and comparators
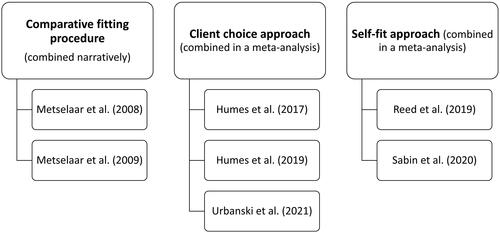
Three different categories of intervention were used in the studies: comparative fitting evaluating different settings based on the knowledge or beliefs of the audiologist, the client choice approach, and the self-fit approach. shows which studies evaluated each type of intervention. These interventions were comprehensively described in all but two studies (Metselaar et al. Citation2008, Citation2009). The Metselaar studies referenced a non-English publication for further details. In all studies, the comparator used was hearing aids programmed to a validated audiogram-based prescription and verified using real-ear measurements.
Figure 2. Summary of intervention categories and studies involved.
Comparisons
Comparative fitting approach vs. audiogram-based approach
Two related studies (Metselaar et al. Citation2008, 2009) compared the comparative fitting approach to an audiogram-based prescription (i.e. NAL-RP). These studies were performed on the same group of participants and reported three outcomes: self-reported listening ability (using the Abbreviated Profile of Hearing Aid Benefit [APHAB]; Cox and Alexander Citation1995) and speech intelligibility in both quiet and noisy environments. Metselaar et al. (Citation2009) also assessed hearing-specific health-related quality of life using the Hearing Handicap and Disability Inventory; however, this outcome was not included in this review because the tool’s psychometric properties have not been validated in a peer-reviewed publication.
In the comparative fitting approach, the hearing health specialists used both their knowledge and the participants’ hearing thresholds for the initial hearing aid selection. The final hearing aid selection was influenced by the participant’s performance on a test of free-field speech intelligibility in quiet (primary criterion) and sound quality judgements (secondary criterion). That is, the hearing aid that provided the highest speech intelligibility scores with an acceptable sound quality was then worn by the patients. The hearing health specialist then adjusted the amplification characteristics (if necessary) after 6 weeks of hearing aid experience.
The results of these studies were narratively synthesised because data required to calculate the estimated effect were missing (i.e. the number of participants analysed in each arm). The authors found no difference between the fitting approaches for self-reported benefit or for speech intelligibility in quiet, but speech intelligibility in noise was significantly higher for the audiogram-based approach (p = 0.002).
Client choice versus audiogram-based prescription
Three studies (Humes et al. Citation2017, Citation2019; Urbanski et al. Citation2021) compared client choice with audiogram-based prescription (i.e. NAL-NL2). These studies reported five different outcomes: hearing-related health-specific quality of life (using the Hearing Handicap Inventory for the Elderly [HHIE]; Ventry and Weinstein Citation1982), self-reported listening ability (using the Profile of Hearing Aid Performance [PHAP]; Cox and Gilmore Citation1990), speech intelligibility in quiet and in noisy conditions, and sound quality.
In the client choice approach, the participants (or their hearing health specialists) selected one of the pre-programmed settings for common audiometric configurations. Although the participants in all studies self-selected their hearing aids (or setting) by trying them in quiet and noisy environments, the participants in Urbanski et al. (Citation2021) also had their hearing aid setting selected by a hearing health specialist using four other methods: selection by audiogram (based on the participants’ audiograms), selection by self-testing (based on their results of an automated online hearing test), selection by questionnaire (based on their scores on the quick hearing check questionnaire) and random selection.
shows the forest plot comparing client choice to audiogram-based prescription for all outcomes. Two studies measured hearing-specific health-related quality of life and the improvement was statistically significant in favour of audiogram-based prescription (SMD = −0.46, p = 0.003, 95% CI [−0.15, −0.76]; I2 = 0%; fixed-effect; Humes et al. Citation2017, Citation2019). Similarly, two studies measured self-reported listening ability and the improvement was statistically significant in favour of audiogram-based prescription (SMD = −0.62, p = 0.011, 95% CI [−0.14, −1.10]; I2 = 53%; random-effect; Humes et al. Citation2017, Citation2019).
Figure 3. Forest plot of comparisons between client choice versus audiogram-based prescription, showing the SMD for each outcome. Squares represent the effect sizes or pooled effect estimates for each outcome, and whiskers denote the 95% confidence intervals around them. Note: n: number of studies; SMD: standardised mean difference; QoL: quality of life.
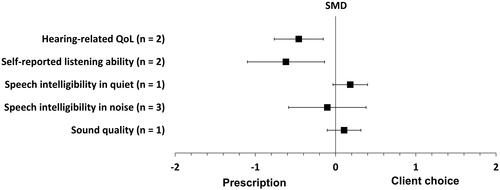
Speech intelligibility in quiet was measured in one study, and the improvement tended to favour the client choice approach, but this was not statistically significant (SMD = 0.18, p = 0.095, 95% CI [0.40, −0.03]; Urbanski et al. Citation2021). Conversely, three studies measured speech intelligibility in noise and difference between the two fitting approaches was close to, and not significantly different from, zero (SMD = −0.103, p = 0.67, 95% CI [0.38, −0.59]; I2 = 67%; random-effect; Humes et al. Citation2017, Citation2019; Urbanski et al. Citation2021).
Sound quality in quiet and noisy environments was measured in one study, and the difference in sound quality for the two fitting approaches was close to, and not significantly different from, zero (SMD = 0.11, p = 0.32, 95% CI [0.32, −0.10]; Urbanski et al. Citation2021). All the effect estimates for this fitting approach are reported in Supplement Table 5.
Self-fit versus audiogram-based approach
Two studies (Reed et al. Citation2019; Sabin et al. Citation2020) compared the self-fit approach with audiogram-based prescriptions (i.e. NAL-NL2). These studies reported four different outcomes: participants’ listening preferences, self-reported listening ability (using the APHAB and the 12-item abbreviated version of the Speech, Spatial and Qualities of Hearing Scale [12-SSQ]; Noble et al. Citation2013), speech intelligibility in noise and sound quality.
For the self-fit approach, all participants were instructed to fit their own hearing devices with or without additional assistance (Reed et al. Citation2019; Sabin et al. Citation2020). The hearing devices used in all of these studies (Bose, Soundhawk and Sound World Solution CS-50+) allowed the participants to fine-tune the amplification characteristics using a smartphone controller.
shows the forest plot of the comparisons between the self-fit approach and audiogram-based prescription for all outcomes. The participants’ listening preferences were measured in one study, and the difference was statistically significant in favour of the self-fit approach (proportion difference = 65%, p = 0.00002, 95% CI [85%, 38%]; Sabin et al. Citation2020). The same study was the only one that measured self-reported listening ability; the difference between the two fitting approaches was close to, and not significantly different from, zero (SMD = 0.16, p = 0.70, 95% CI [0.51, −0.19]; Sabin et al. Citation2020).
Figure 4. Forest plot of comparisons between the self-fit approach and audiogram-based prescription, showing the SMD or proportion difference for each outcome. Squares represent the effect sizes or pooled effect estimates for each outcome, and whiskers denote the 95% confidence intervals around them, except for listening preference, where the square represents the proportion difference and the whiskers denote the 95% confidence interval around it.
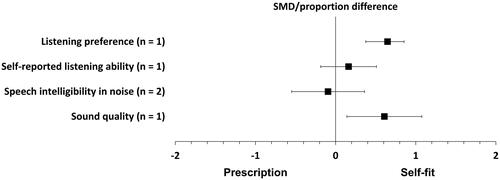
Speech intelligibility in noise was measured in both studies, and the difference between the two fitting approaches was close to, and not significantly different from, zero (SMD = −0.09, p = 0.22, 95% CI [0.71, −0.9]; I2 = 90%; random effect; Reed et al. Citation2019; Sabin et al. Citation2020). Sound quality was measured in only one study, and the improvement was statistically significant in favour of the self-fit approach (SMD = 0.60, p = 0.01, 95% CI [1.08, 0.14]; Sabin et al. Citation2020). All the effect estimates for this fitting approach are reported in Supplement Table 6.
Quality of evidence
The Downs and Black (Citation1998) risk-of-bias scores and categories (i.e. excellent, good, fair and poor) for all the studies are reported in Supplement Table 7. In general, the total scores for the studies were relatively high, ranging from 17 (Reed et al. Citation2019) to 26 (Humes et al. Citation2017). Two studies were categorised as fair (Reed et al. Citation2019; Sabin et al. Citation2020), four as good (Metselaar et al. Citation2008, Citation2009; Humes et al. Citation2019; Urbanski et al. Citation2021) and one as excellent (Humes et al. Citation2017). All the studies had high scores for the quality of reporting and internal validity domains. Similarly, all but two studies (Reed et al. Citation2019; Urbanski et al. Citation2021) obtained the maximum score for statistical power because they either performed a sample size calculation or recruited a sample that was commensurate with the other studies. However, the scores in the external validity domain were low for three studies because they applied tight inclusion criteria and performed some aspects of the study in unrepresentative environments (Reed et al. Citation2019; Sabin et al. Citation2020; Urbanski et al. Citation2021).
The overall quality of evidence for each outcome using GRADE are reported in Supplement Table 8. In general, the quality of evidence was downgraded by two or three points (i.e. from high to low or very low quality) for all outcomes. This was due to borderline, serious or very serious risk of bias (e.g. high attrition and performance bias), inconsistency (e.g. point estimates varying widely with statistically significant heterogeneity), indirectness (e.g. tight eligibility criteria) or imprecision (e.g. only one study contributed to that outcome).
Sensitivity analysis
The correlation coefficient between the intervention and comparator was estimated for one study (Urbanski et al. Citation2021). The impact of estimating the correlation coefficient on the individual and pooled estimate as well as their 95% CIs was assessed using a sensitivity analysis. In simple terms, estimates and their 95% CIs were calculated using different plausible correlation coefficient values. The pooled estimate and its 95% CIs did not change when the assumed correlation was changed. This indicates that estimating the correlation coefficient has no significant impact on the pooled estimate. However, changing the assumed correlation values markedly affected the individual estimates for all outcomes in Urbanski et al. (Citation2021). All sensitivity analyses are reported in Supplement Table 9.
Discussion
This review aimed to identify and evaluate the evidence on whether the outcomes for adults are better when hearing aids are programmed using an audiogram-based prescription formula and verified using real-ear measurements, relative to an alternative approach not based on the individual’s hearing thresholds. Only seven studies were deemed eligible for inclusion. Exacerbating this small number of studies, the interventions themselves were heterogeneous as two evaluated the comparative fitting approach, three evaluated the client choice and two evaluated the self-fit approach. The most common outcome was speech intelligibility in noise followed by self-reported listening ability, hearing-specific health-related quality of life, sound quality and preference, respectively. No adverse events were reported in any of the included studies. Outcomes were measured at the fitting sessions (Reed et al. Citation2019; Urbanski et al. Citation2021), after 3–6 weeks (Metselaar et al. Citation2008; Humes et al. Citation2017, Citation2019) and after 6 months (Metselaar et al. Citation2009), indicating that some studies did not allow participants to adapt to or sufficiently fine-tune their hearing aids. Nearly all studies involved predominantly adults with mild to moderate hearing loss with no prior hearing aid experience.
Comparative fitting approach versus audiogram-based approach
Two related studies investigated the effectiveness of the comparative fitting approach relative to the audiogram-based prescription (Metselaar et al. Citation2008, Citation2009). Unlike the other identified alternative fitting approach, the comparative fitting requires direct input from the hearing health professional. The sample size in these two studies was relatively large (n = 254). However, the analysis was performed on a subset of participants who were satisfied with their hearing aids’ programming (circa 30–50% of the sample were unsatisfied with their hearing aid fitting). The number of individuals who were satisfied and analysed from each research arm was not reported. In addition, the groups’ means and standard deviations were not provided. Therefore, the results of these two studies were limited to a narrative report.
The findings of these two studies indicated that these two fitting approaches were comparable in speech intelligibility in quiet and self-reported listening ability. However, a statistically significant advantage for audiogram-based prescription was found for speech intelligibility in noise. This can be partially attributed to the fact that the hearing aid selection process was influenced by the participants’ performance on speech intelligibility in quiet, but not in noise. Indeed, individuals with hearing loss may prefer different amplification characteristics for different acoustic environments (Keidser Citation1995; Scollie et al. Citation2010; Walravens et al. Citation2020). Despite the fact that the authors used a suboptimal prescription formula (i.e. NAL-RP has been superseded by NAL-NL1 and then NAL-NL2) and provided additional fine-tuning for those in the comparative group, the audiogram-based prescription was significantly superior. The quality of evidence for all outcomes was downgraded to low or very low due to a serious risk of bias, serious indirectness and imprecision.
Client choice versus audiogram-based prescription
Three studies investigated the effectiveness of the client choice relative to the audiogram-based prescription (Humes et al. Citation2017, Citation2019; Urbanski et al. Citation2021). These studies reported five outcomes: hearing-related health-specific quality of life, self-reported listening ability, speech intelligibility in quiet, speech intelligibility in noisy conditions and sound quality.
Hearing-related health-specific quality of life was measured in two studies (Humes et al. Citation2017, Citation2019). These two studies found small to medium statistically significant effects in favour of the audiogram-based prescription. The pooled effect estimate was statistically significant in favour of the audiogram-based prescription (with a medium effect). Altering the model of the meta-analysis from fixed to random would alter neither the pooled effect size nor the 95% confidence interval for this outcome. The average advantage on the HHIE was 7 points, which is about a quarter of the 26.5 points total benefit of acquiring hearing aids reported in Ferguson et al. (Citation2017). Similarly, self-reported listening ability was measured in the aforementioned studies with small to large statistically significant effects in favour of the audiogram-based prescription (Humes et al. Citation2017, Citation2019). Pooling the effect estimates of these two studies resulted in a medium statistically significant advantage for the audiogram-based prescription. The average advantage on the PHAP was 8%, which corresponds to about a quarter of the 33-point total benefit of acquiring hearing aids on APHAB reported in McArdle et al. (Citation2005). The heterogeneity between the size of the individual effect estimates for the self-reported listening ability outcome could be due to the potential intervention bias associated with the within-group sequential design study (i.e. some participants in the Humes et al. (Citation2019) study self-selected hearing aids with no gain (or minimal) in one ear and experimental hearing aids for the other ear for the intervention condition). This observation, along with the potential order effect in Humes et al. (Citation2019), may inflate the reported effects.
Speech intelligibility in noise was measured in all studies. There were small effects in favour of the audiogram-based prescription in two studies (Humes et al. Citation2019; Urbanski et al. Citation2021). However, the effect in the remaining study tended to favour the client choice (Humes et al. Citation2017). The pooled effect for these three studies was close to, and not significantly different from, zero.
Speech intelligibility in quiet conditions and sound quality were measured in one study (Urbanski et al. Citation2021). For these two outcomes, the effect sizes were close to, and not significantly different from, zero. However, to calculate the effect sizes for these two outcomes, the correlation coefficients between the fitting approaches were estimated; changing the estimated values could narrow or broaden the CIs around the estimates.
Interestingly, when Humes et al. (Citation2017) compared audiogram-based prescription and client choice with a placebo group (those who received hearing aids with no or minimal gain), both approaches were found to be significantly better than placebo. Although both were efficacious (compared to placebo), the hearing aid retention rate (measured before revealing the treatment allocations) was higher with the audiogram-based prescription than with the client choice (81% versus 55%, respectively). However, around 20% of individuals with hearing loss are currently using hearing aids, and, if those who were randomised to the client choice are representative of the 80% who have not sought hearing aids via the existing clinical routes, and half of them kept the hearing aids, this would triple the number of people currently using hearing aids (20% currently using hearing aids plus half of the remaining 80%).
The quality of evidence for all outcomes was downgraded to low or very low for various reasons, including low initial quality rating and serious risk of bias, indirectness and imprecision.
Self-fit versus audiogram-based approach
Two studies investigated the effectiveness of the self-fit approach relative to the audiogram-based prescription (Reed et al. Citation2019; Sabin et al. Citation2020). These studies reported four outcomes: participants’ listening preferences, self-reported listening ability, speech intelligibility in noise and sound quality.
Listening preference, the primary outcome of this review, was measured in one study (Sabin et al. Citation2020). The difference between the two fitting approaches was statistically significant in favour of the self-fit approach, indicating that the majority of participants preferred their own self-fit settings. The same study was the only one that measured self-reported listening ability and the difference between the fitting approaches was close to, and not significantly different from, zero.
Speech intelligibility in noise was measured in two studies, with one finding a small effect in favour of the audiogram-based prescription. The other study found a small effect in favour of the self-fit approach. The pooled effect was close to, and not significantly different from, zero. The difference between the two studies can be partially attributed to the fact that the participants in Reed et al. (Citation2019) had no chance to fine-tune their hearing devices in real life.
Sound quality was measured in one study (Sabin et al. Citation2020) and the improvement was statistically significant in favour of the self-fit approach.
The quality of evidence for all outcomes was downgraded to low or very low for various reasons, including low initial quality rating and serious risk of bias, indirectness and inconsistency.
Clinical implications and future directions
It is well established that the use of hearing aids programmed using the individual’s hearing thresholds improves outcomes relative to the unaided condition (Ferguson et al. Citation2017). Likewise, the benefits of alternative listening devices not programmed using the individual’s hearing thresholds suggest that those devices could improve speech intelligibility in noise relative to the unaided condition (Maidment et al. Citation2018).
The findings of this review shed limited light on whether the outcomes for adults are better when hearing aids are programmed using an audiogram-based prescription formula and verified using real-ear measurements, relative to when they are programmed according to an alternative approach not based on the individual’s hearing thresholds. Programming hearing aids using an individual user’s audiogram could improve outcomes, although the clinical benefit is questionable, relative to the comparative and client choice fitting approaches. Self-adjustment during daily use may produce equivalent (or better) outcomes than a prescription based on an individual’s audiogram.
However, it should be noted that the cost associated with the client choice and self-fit approaches is expected to be significantly lower than that of the individualised audiogram-based prescription approach with real-ear probe-tube verification, given that the former approaches do not require the presence of an audiologist or the use of advanced equipment. Indeed, a main drive behind developing these alternative fitting approaches is to reduce the cost associated with the traditional fitting approach. Thus, a cost-effectiveness analysis is urgently needed to determine if the identified statistical advantages for individualised audiogram-based prescription with real-ear probe-tube verification is worth the cost involved.
The review has also highlighted that there is a dearth of relevant studies, most of which provide low quality evidence, on which to make evidence-based decisions.
Limitations of the systematic review
This review was limited to studies published in peer-reviewed journals because there is no uniform approach to systematically searching other literature. Although our search strategy captured numerous theses, conference abstracts and book chapters, none of them were relevant to this review.
The data from Urbanski et al. (Citation2021) were extracted from the figures using an online tool (i.e. WebPlotDigitizer). Extracting data using this approach may slightly affect the accuracy of the calculated estimates and their 95% CIs.
Deviation from the protocol
The intention was to exclude studies that included participants with audiometrically normal hearing but did not analyse these independently. However, one study violated this inclusion criterion and enrolled normal hearing participants without controlling for this variable (Sabin et al. Citation2020). This paper was included in this review because all participants with normal hearing thresholds (accounting for <11% of the total sample) had self-reported hearing difficulties. In addition, including this paper enriched the content of this review, as this study alone provided the opportunity for participants to adjust the frequency response and compression characteristics of the hearing devices over an extended period while using the devices in real-life situations. Also, this study was the only one that reported the primary outcome of interest.
Similarly, the plan was to include only studies with participants for whom pure tone hearing threshold levels were outside the approximated audiograms that were used for the client choice fitting procedure. However, two studies violated this inclusion criteria (Humes et al. Citation2017; Urbanski et al. Citation2021). These studies were included to broaden the prospect and enrich the content of this review. Nevertheless, the external validity scores for these two studies were reduced due to this observation. Likewise, the initial plan was to include research papers that were not published in peer-reviewed journals (e.g. conference abstracts and magazine articles), but this was not achieved because there is no agreed method to search such literature.
Conclusions
In general, the benefit of using an individual prescription for adults with mild to moderate hearing loss depends on the fitting method to which it is being compared. The findings of this review suggest that using a prescription with the individual’s audiogram is likely to improve outcomes relative to the comparative and client choice fitting approaches. For the client choice approach, the improvement is equivalent to about one quarter of the total benefit of acquiring hearing aids. Self-adjustment during daily use may, however, produce equivalent (or better) outcomes than an audiogram-based prescription. The quality of evidence for the outcomes ranged from low to very low. This review has, however, highlighted the dearth of high-quality studies on which to make evidence-based decisions. Thus, high-quality studies are needed to guide stakeholders and policymakers on the suitability of using these alternative service delivery models.
Supplemental Material
Download MS Word (14.6 KB)Supplemental Material
Download MS Word (15.6 KB)Supplemental Material
Download MS Word (13.6 KB)Supplemental Material
Download MS Word (14.2 KB)Supplemental Material
Download MS Word (15.3 KB)Supplemental Material
Download MS Word (14.2 KB)Supplemental Material
Download MS Word (12.6 KB)Supplemental Material
Download MS Word (16.4 KB)Supplemental Material
Download MS Word (16.6 KB)Acknowledgements
The authors thank Systematic Review Solutions Ltd for their support on developing the search strategies. The review team extend their gratitude to the corresponding authors of the included studies for sharing data not reported in their publications and for responding to our queries.
Disclosure statement
The authors declare that there is no conflict of interest.
Additional information
Funding
References
- Almufarrij, I., H. Dillon, and K. J. Munro. 2021a. “Does Probe-Tube Verification of Real-Ear Hearing Aid Amplification Characteristics Improve Outcomes in Adults? A Systematic Review and Meta-Analysis.” Trends in Hearing 25: 2331216521999563–2331216521999563. doi:10.1177/2331216521999563.
- Almufarrij, I., H. Dillon, and K. J. Munro. 2021b. “Is the Outcome of Fitting Hearing Aids to Adults Affected by Whether an Audiogram-Based Prescription Formula is Individually Applied? A Systematic Review Protocol.” BMJ Open 11 (8): e045899. doi:10.1136/bmjopen-2020-045899.
- Almufarrij, I., K. J. Munro, P. Dawes, M. A. Stone, and H. Dillon. 2019. “Direct-to-Consumer Hearing Devices: Capabilities, Costs, and Cosmetics.” Trends in Hearing 23: 2331216519858301. doi:10.1177/2331216519858301.
- Borenstein, M., L. V. Hedges, J. P. Higgins, and H. R. Rothstein. 2009. Introduction to Meta-Analysis. Chichester, United Kingdom: John Wiley & Sons.
- Byrne, D., H. Dillon, T. Ching, R. Katsch, and G. Keidser. 2001. “NAL-NL1 Procedure for Fitting Nonlinear Hearing Aids: Characteristics and Comparisons with Other Procedures.” Journal of the American Academy of Audiology 12 (1): 37–51.
- Cox, R. M., and G. C. Alexander. 1995. “The Abbreviated Profile of Hearing Aid Benefit.” Ear and Hearing 16 (2): 176–186. doi:10.1097/00003446-199504000-00005.
- Cox, R. M., and C. Gilmore. 1990. “Development of the Profile of Hearing Aid Performance (PHAP).” Journal of Speech, Language, and Hearing Research 33 (2): 343–357. doi:10.1044/jshr.3302.343.
- Davis, A., P. Smith, M. Ferguson, D. Stephens, and I. Gianopoulos. 2007. “Acceptability, Benefit and Costs of Early Screening for Hearing Disability: A Study of Potential Screening Tests and Models.” Health Technology Assessment 11 (42): 1–294. doi:10.3310/hta11420.
- Dillon, H. 2001. The Research of Denis Byrne at NAL: Implications for Clinicians Today. https://www.audiologyonline.com/articles/research-denis-byrne-at-nal-1200 (Accessed: 25/04/2020).
- Downs, S. H., and N. Black. 1998. “The Feasibility of Creating a Checklist for the Assessment of the Methodological Quality Both of Randomised and Non-Randomised Studies of Health Care Interventions.” Journal of Epidemiology and Community Health 52 (6): 377–384. doi:10.1136/jech.52.6.377.
- Ferguson, M. A., P. T. Kitterick, L. Y. Chong, M. Edmondson-Jones, F. Barker, and D. J. Hoare. 2017. “Hearing Aids for Mild to Moderate Hearing Loss in Adults.” The Cochrane Database of Systematic Reviews 9: CD012023. doi:10.1002/14651858.CD012023.pub2.
- Gatehouse, S., and W. Noble. 2004. “The Speech, Spatial and Qualities of Hearing Scale (SSQ).” International Journal of Audiology 43 (2): 85–99. doi:10.1080/14992020400050014.
- Higgins, J. P. T, and S. Green. 2008. Cochrane Handbook for Systematic Reviews of Interventions. Chichester, England; Hoboken, NJ: Wiley-Blackwell.
- Hooper, P., J. W. Jutai, G. Strong, and E. Russell-Minda. 2008. “Age-Related Macular Degeneration and Low-Vision Rehabilitation: A Systematic Review.” Canadian Journal of Ophthalmology. Journal Canadien D'ophtalmologie 43 (2): 180–187. doi:10.3129/i08-001.
- Humes, L. E., D. L. Kinney, A. K. Main, and S. E. Rogers. 2019. “A Follow-Up Clinical Trial Evaluating the Consumer-Decides Service Delivery Model.” American Journal of Audiology 28 (1): 69–84. doi:10.1044/2018_AJA-18-0082.
- Humes, L. E., S. E. Rogers, T. M. Quigley, A. K. Main, D. L. Kinney, and C. Herring. 2017. “The Effects of Service-Delivery Model and Purchase Price on Hearing-Aid Outcomes in Older Adults: A Randomized Double-Blind Placebo-Controlled Clinical Trial.” American Journal of Audiology 26 (1): 53–79. doi:10.1044/2017_AJA-16-0111.
- Jones, I. H., and V. O. Knudsen. 1938. “What Audiometry Can Now Mean in Routine Practice.” Journal of the American Medical Association 111 (7): 597–605. doi:10.1001/jama.1938.02790330017004.
- Keidser, G. 1995. “The Relationship between Listening Conditions and Alternative Amplification Schemes for Multiple Memory Hearing Aids.” Ear and Hearing 16 (6): 575–586. doi:10.1097/00003446-199512000-00004.
- Keidser, G., H. Dillon, L. Carter, and A. O'Brien. 2012. “NAL-NL2 Empirical Adjustments.” Trends in Amplification 16 (4): 211–223. doi:10.1177/1084713812468511.
- Keidser, G., H. Dillon, M. Flax, T. Ching, and S. Brewer. 2011. “The NAL-NL2 Prescription Procedure.” Audiology Research 1 (1): e24. doi:10.4081/audiores.2011.e24.
- Kochkin, S. 2009. “MarkeTrak VIII: 25-Year Trends in the Hearing Health Market.” Hearing Review 16 (11): 12–31.
- Kyzas, P. A., D. Denaxa-Kyza, and J. P. Ioannidis. 2007. “Almost All Articles on Cancer Prognostic Markers Report Statistically Significant Results.” European Journal of Cancer (Oxford, England : 1990) 43 (17): 2559–2579. doi:10.1016/j.ejca.2007.08.030.
- Lybarger, S. 1944. US patent application SN543-278.
- Maidment, D. W., A. B. Barker, J. Xia, and M. A. Ferguson. 2018. “A Systematic Review and Meta-Analysis Assessing the Effectiveness of Alternative Listening Devices to Conventional Hearing Aids in Adults with Hearing Loss.” International Journal of Audiology 57 (10): 721–729. doi:10.1080/14992027.2018.1493546.
- Matthew, J. P., P. T. H. Julian, and A. C. S. Jonathan. 2019. “Assessing Risk of Bias Due to Missing Results in a Synthesis.” In Cochrane Handbook for Systematic Reviews of Interventions edited by, Julian, P. T. H., James, T., Jacqueline, C., Miranda, C., Tianjing, L., Matthew, J. P. & Vivian, A. W. 2nd ed. Chichester, UK: The Cochrane Collaboration and John Wiley & Sons Ltd.
- McArdle, R., T. H. Chisolm, H. B. Abrams, R. H. Wilson, and P. J. Doyle. 2005. “The WHO-DAS II: Measuring Outcomes of Hearing Aid Intervention for Adults.” Trends in Amplification 9 (3): 127–143. doi:10.1177/108471380500900304.
- Metselaar, M., B. Maat, P. Krijnen, H. Verschuure, W. Dreschler, and L. Feenstra. 2008. “Comparison of Speech Intelligibility in Quiet and in Noise after Hearing Aid Fitting according to a Purely Prescriptive and a Comparative Fitting Procedure.” European Archives of Oto-Rhino-Laryngology 265 (9): 1113–1120. doi:10.1007/s00405-008-0596-x.
- Metselaar, M., B. Maat, P. Krijnen, H. Verschuure, W. A. Dreschler, and L. Feenstra. 2009. “Self-Reported Disability and Handicap after Hearing-Aid Fitting and Benefit of Hearing Aids: comparison of Fitting Procedures, Degree of Hearing Loss, Experience with Hearing Aids and Uni- and Bilateral Fittings.” European Archives of Oto-Rhino-Laryngology: Official Journal of the European Federation of Oto-Rhino-Laryngological Societies (EUFOS): Affiliated with the German Society for Oto-Rhino-Laryngology – Head and Neck Surgery 266 (6): 907–917. doi:10.1007/s00405-008-0847-x.
- Moher, D., A. Liberati, J. Tetzlaff, and D. G. Altman, PRISMA Group. 2009. “Preferred Reporting Items for Systematic Reviews and Meta-Analyses: The PRISMA Statement.” PLoS Medicine 6 (7): e1000097. doi:10.1371/journal.pmed.1000097.
- Moore, B. C., B. R. Glasberg, and M. A. Stone. 2010. “Development of a New Method for Deriving Initial Fittings for Hearing Aids with Multi-Channel Compression: CAMEQ2-HF.” International Journal of Audiology 49 (3): 216–227. doi:10.3109/14992020903296746
- Mueller, H. G. 2005. “Fitting Hearing Aids to Adults Using Prescriptive Methods: An Evidence-Based Review of Effectiveness.” Journal of the American Academy of Audiology 16 (7): 448–460. doi:10.3766/jaaa.16.7.5.
- Mueller, H. G. 2015. 20Q: Today's use of validated prescriptive methods for fitting hearing aids - what would Denis say?: AudiologyOnline. https://www.audiologyonline.com/articles/20q-today-s-use-14101 (Accessed: 5/11/2021).
- Munro, K, and G. H. Mueller. 2016. “Clinical Verification of Hearing Aid Performance.” In Hearing Aids, edited by Popelka, G., Moore, B. C., Fay, R. & Popper, A. Switzerland: Springer.
- Nance, G, and D. Causey. 1968. 'Hearing-Aid Evaluation: An Examination of Two Procedures', Bulletin of Prosthetics Research – Spring.
- Noble, W., N. S. Jensen, G. Naylor, N. Bhullar, and M. A. Akeroyd. 2013. “A Short Form of the Speech, Spatial and Qualities of Hearing Scale Suitable for Clinical Use: The SSQ12.” International Journal of Audiology 52 (6): 409–412. doi:10.3109/14992027.2013.781278.
- Reed, N. S., A. Oliver, N. K. Srinivasan, F. R. Lin, and P. A. Korczak. 2019. “Pilot Comparison of Adjustment Protocols of Personal Sound Amplification Products.” Seminars in Hearing 40 (1): 26–36. doi:10.1055/s-0038-1676781.
- Richardson, W. S., M. C. Wilson, J. Nishikawa, and R. S. Hayward. 1995. “The Well-Built Clinical Question: A Key to Evidence-Based Decisions.” ACP Journal Club 123 (3): A12–A13. doi:10.7326/ACPJC-1995-123-3-A12
- Sabin, A. T., D. J. Van Tasell, B. Rabinowitz, and S. Dhar. 2020. “Validation of a Self-Fitting Method for over-the-Counter Hearing Aids.” Trends in Hearing 24: 2331216519900589. doi:10.1177/2331216519900589.
- Scollie, S., T. Y. Ching, R. Seewald, H. Dillon, L. Britton, J. Steinberg, and J. Corcoran. 2010. “Evaluation of the NAL-NL1 and DSL v4.1 Prescriptions for Children: Preference in Real World Use.” International Journal of Audiology 49 (Suppl. 1): S49–S63. doi:10.3109/14992020903148038.
- Scollie, S., R. Seewald, L. Cornelisse, S. Moodie, M. Bagatto, D. Laurnagaray, S. Beaulac, and J. Pumford. 2005. “The Desired Sensation Level Multistage Input/Output Algorithm.” Trends in Amplification 9 (4): 159–197. doi:10.1177/108471380500900403.
- Shamseer, L., D. Moher, M. Clarke, D. Ghersi, A. Liberati, M. Petticrew, P. Shekelle, and L. A. Stewart, PRISMA-P Group. 2015. “Preferred Reporting Items for Systematic Review and Meta-Analysis Protocols (PRISMA-P) 2015: Elaboration and Explanation.” BMJ (Clinical Research ed.) 350: g7647. doi:10.1136/bmj.g7647.
- Thyer, N. J., J. Watson, C. Jackson, L. Hickson, C. Maynard, A. Forster, L. Clark, et al. 2018. “Randomised Controlled Feasibility Trial of the Active Communication Education Programme plus Hearing Aid Provision versus Hearing Aid Provision Alone (ACE to HEAR): A Study Protocol.” BMJ Open 8 (7): e021502. doi:10.1136/bmjopen-2018-021502.
- Turner, E. H., A. M. Matthews, E. Linardatos, R. A. Tell, and R. Rosenthal. 2008. “Selective Publication of Antidepressant Trials and Its Influence on Apparent Efficacy.” New England Journal of Medicine 358 (3): 252–260. doi:10.1056/NEJMsa065779.
- Urbanski, D., H. Hernandez, J. Oleson, and Y. H. Wu. 2021. “Toward a New Evidence-Based Fitting Paradigm for over-the-Counter Hearing Aids.” American Journal of Audiology 30 (1): 43–66. doi:10.1044/2020_AJA-20-00085.
- Ventry, I. M., and B. E. Weinstein. 1982. “The Hearing Handicap Inventory for the Elderly: A New Tool.” Ear and Hearing 3 (3): 128–134. doi:10.1097/00003446-198205000-00006.
- Walravens, E., G. Keidser, and L. Hickson. 2020. “Consistency of Hearing Aid Setting Preference in Simulated Real-World Environments: Implications for Trainable Hearing Aids.” Trends in Hearing 24: 2331216520933392. doi:10.1177/2331216520933392.
- Wan, X., W. Wang, J. Liu, and T. Tong. 2014. “Estimating the Sample Mean and Standard Deviation from the Sample Size, Median, Range and/or Interquartile Range.” BMC Medical Research Methodology 14 (1): 1–13. doi:10.1186/1471-2288-14-135.
- World Health Organization. 2018. Global Health Estimates 2016: Disease burden by Cause, Age, Sex, by Country and by Region, 2000–2016. Geneva.
- World Health Organization. 2020. Deafness and hearing loss: World Health Organization. https://www.who.int/news-room/fact-sheets/detail/deafness-and-hearing-loss (Accessed: 06/10/2020).