
Abstract
Objective
The concept of conversation success is undefined, although prior work has variously related it to accurate exchange of information, alignment between interlocutors, and good management of misunderstandings. This study aimed (1) to identify factors of conversation success and (2) to explore the importance of these factors in one-to-one versus group conversations.
Design
Group concept mapping method was applied. Participants responded to two brainstorming prompts (“What does ‘successful conversation’ look like?” and “Think about a successful conversation you have taken part in. What aspects of that conversation contributed to its success?”). The resulting statements were sorted into related clusters and rated in importance for one-to-one and group conversation.
Study Sample
Thirty-five adults with normal and impaired hearing.
Results
Seven clusters were identified: (1) Being able to listen easily; (2) Being spoken to in a helpful way; (3) Being engaged and accepted; (4) Sharing information as desired; (5) Perceiving flowing and balanced interaction; (6) Feeling positive emotions; (7) Not having to engage coping mechanisms. Three clusters (1, 2, and 4) were more important in group than in one-to-one conversation. There were no differences by hearing group.
Conclusions
These findings emphasise that conversation success is a multifaceted concept.
Introduction
Conversation is one of the most common forms of human interaction and is a focus of interest for researchers from a variety of different fields. For instance, while linguists investigate the structure of language in conversation, psychologists investigate ways in which people communicate and even link these to personality traits (Kahler Citation2008). Although conversation is hard to define, it is typically understood to involve an alternation of spoken turns that can be focussed on a range of topics and have a range of goals (from information sharing to rapport building). Rubin, Perse, and Barbato (Citation1988) found six different motives to underlie social interpersonal communication: inclusion, pleasure, affection, escape, relaxation, and control. If we understand success as the accomplishment of a certain purpose, this wide variety of motives makes the concept of conversation success almost impossible to compress into a universally valid definition. However, Clark et al. (Citation2019) found that human–human interaction purposes can be grouped into two categories: social purposes (building and maintaining a social bond) and transactional purposes (gathering information to complete a clear objective).
The attempt to measure conversation success can be at least as complex as trying to define it. It is clear, however, that success can be measured in several different ways, and that a range of factors impact how people judge conversation success. Conversation success is context-dependent and can be perceived subjectively by the individuals who took part in the conversation, assessed by external observers or by using objective measurements such as EEG (Electroencephalography). Furthermore, success could occur and be perceived during the conversation (e.g., when participants are smiling) or could appear and be perceived after the conversation (e.g., achieving a goal). To address these different forms of success, the measurement of success could be done progressively, during the conversation, or retrospectively, after the conversation. To date, a variety of measures have been proposed as indicators of success in the study of conversation: the ability to exchange information efficiently in storytelling tasks (Ramsberger and Rende Citation2002) or Diapix/map/maze tasks (Foltz et al. Citation2015; Garrod and Pickering Citation2004), speaker-listener alignment (Garrod and Pickering Citation2004; Holler and Wilkin Citation2011; Stephens, Silbert, and Hasson Citation2010), the ability to predict the end of turn of a speaker’s turn (De Ruiter, Mitterer, and Enfield Citation2006; Hadley, Fisher, and Pickering Citation2020), and conversation fluency (Lind, Hickson, and Erber Citation2006; Tye-Murray Citation2003). In the end, conversation success could mean an accurate information exchange, alignment between communication partners, or simply good management of misunderstandings to ensure conversation fluency.
Conversation has a central locus in humans' lives, and from an evolutionary perspective, humans are well equipped to hold conversations. However, many factors can affect the ease with which people achieve success in conversation. These factors include background noise, non-native language, non-aligned cultural norms, and cognitive impairment, to name a few. The population of interest in this study is people with hearing loss. When experiencing hearing difficulties, following a conversation becomes complicated. Missing portions of speech due to hearing loss can trigger cognitive processes to compensate for the poor auditory signal (Rönnberg, Holmer, and Rudner Citation2019). Then it becomes challenging to interject while still processing what has been said. Asking for repetition might be uncomfortable and the entire conversation might be perceived as tiring. It has been shown that people with hearing loss experience excess fatigue (Holman et al. Citation2019) and are more likely to avoid conversations in noisy environments than those reporting no hearing impairment (Strawbridge et al. Citation2000). The hearing device industry is making progress in alleviating hearing loss by designing user-friendly efficient hearing devices that are meant to restore the ability and desire to fully participate in conversations for people with hearing loss. However, knowing what conversation success is could facilitate faster progress, by ensuring that efforts are focussed on enhancing functionalities that have most importance for users of hearing devices.
Another key factor which might shape what is perceived as conversation success is the size of the conversing group, since the conversation structure depends on the number of interlocutors. In larger groups, the conversation could take the form of an interactive dialogue or a serial monologue where one participant fulfils the role of the speaker, while others are listening (Fay, Garrod, and Carletta 2000). Most empirical studies have focussed on pairs and trios, leaving a gap in the literature with respect to group conversations with more than three interlocutors. Given that two of the most common difficulties reported by people with hearing loss are listening to speech in a group of talkers and conversing in a group of talkers (Vas et al. Citation2017), we also focus in this study on the contrast between one-to-one and group conversation
The present study attempts to fill this knowledge gap by using Group Concept Mapping (GCM), a mixed-method participatory research process (Trochim Citation1989), to gather perspectives from adults with normal and impaired hearing on (1) What are the factors that drive conversation success? and (2) How important are these factors in 1-to-1 and group conversations? The GCM method combines qualitative and quantitative research into a sequential process. One of the strengths of GCM is that it engages participants during the entire process. Besides expressing their thoughts on the topic of interest, participants are also involved in grouping these ideas and rating them on different scales (e.g., importance in 1-to-1 conversation and importance in group conversation), thereby minimising the risk of researchers’ bias and presumptions.
Traditionally, GCM has been used in business management (Trochim, Cook, and Setze Citation1994) but in recent years it has also become popular in health care research, most often exploring patients’ needs (Zevon et al. Citation2007). In audiology research, the method has been used to show that there are factors in client clinician interaction that might influence hearing aid adoption (Poost-Foroosh et al. Citation2011), to investigate methods to reduce the impact of chronic tinnitus upon the lives of children and adolescents (Bennett et al. Citation2018), to explore the use of tele-audiology in remote hearing aid support services (Glista et al. Citation2021), and to seek perspectives of hearing aid users, significant others, and hearing care professionals on how eHealth can meet patients’ and their significant others’ needs (Meyer et al. Citation2022). Our GCM process involved two brainstorming prompts to probe the concept of conversation success. This strategy has been successfully used previously to conceptualise “good health” (McCaffrey et al. Citation2019). Like “good health”, “conversation success” is a broad concept that needs more than one prompt to cover the whole perspective in the brainstorming activity. The next section describes how GCM was implemented in this study.
Materials and methods
Participants
People with normal (NH) and impaired (IH) hearing were invited to participate. They were selected based on an audiogram and demographic data stored in the Hearing Sciences Scottish Section (HSSS) participant database. Invited participants were 50–75 years old and were fluent in English. The NH group had a better-ear four-frequency pure-tone average hearing threshold < 20 dB HL (with no threshold > 40 dB HL), and an asymmetry of average thresholds < 10 dB HL. The IH group had a better-ear four-frequency pure-tone average hearing threshold of 41-60 dB HL and an asymmetry of average thresholds < 15 dB HL. Hearing aids are often recommended for people with hearing losses in this range, thus although it was not an inclusion criterion, all participants with hearing loss were also hearing aid users. Each participant gave their written consent for participation in the study. This research received ethical approval from the West of Scotland Research Ethics Committee (18/WS/0007) and the NHS Greater Glasgow and Clyde R&D (GN18EN094).
Thirty-five participants (N = 16 NH, N = 19 IH), approximately age-matched (mean NH = 62, mean IH = 65) agreed to participate in the first activity (brainstorming), 24 (NH = 10, IH = 14) in the second activity (sorting the statements into groups), and 29 (NH = 13, IH = 16) in the third activity (rating the statements). 27 participants completed all activities, 29 completed two of the three activities and 6 completed only one activity. summarises the demographic data and participation rates in the different GCM activities.
Table 1. Demographics and participation rates.
Group concept mapping steps
The GCM method was implemented as outlined below. Statements coming from all participants, both NH and IH, were processed, sorted, and rated together in order to obtain only one concept map that covered the views gathered from both groups.
Brainstorming: Online individual brainstorming sessions were conducted via an online survey platform (JISC, www.onlinesurveys.ac.uk). Participants were prompted to generate statements by answering the following questions: “What does ‘successful conversation’ look like?” and “Think about a successful conversation you have taken part in. What aspects of that conversation contributed to its success?”. The first question is more general and elicits participants’ imagination in thinking about conversation success. The second question is more specific and explores the post-hoc perception of conversation success by eliciting participants’ memory. Participants were instructed to write a minimum of one statement and a maximum of ten statements for each question. In addition to the brainstorming prompts, participants answered demographic questions related to their work status, and whether they actively use hearing aids.
Next, the researchers condensed the brainstorming statements to create a logical set of statements (Trochim Citation1989). The statements were trimmed and refined using the following strategies: removing duplicates, splitting items that express two or more topics in one statement, editing jargon and personal information, and excluding statements that were not answering the brainstorming prompt. The final list of statements was reworded for clarity.
2. Sorting the statements: This activity was carried out by participants using the card-sorting functionality provided on www.provenbyusers.com, an open-source research platform. Participants that took part in this activity were given a set of virtual cards. One refined statement from the brainstorming step was written on each card. Participants were asked to organise the cards into groups of similar ideas in a way that made sense to them. They were told there was no right or wrong answer and asked to create at least five groups, and to label each group with a unique title. A card could be put alone in a group if it was judged to stand alone as a unique idea, unrelated to the other cards. Participants were also asked not to create a ’miscellaneous’ or ‘other’ group. Three participants did not follow instructions and created less than five groups (n = 2) or created random group names A, B, C (n = 1). These participants were excluded from the analysis, therefore they are excluded from .
3. Rating the statements: In the rating activity, participants were asked to rate how important each statement was to them. For this activity we again used the JISC platform (www.onlinesurveys.ac.uk). Participants rated the statements on a five-point Likert scale (1= not important at all to 5 = extremely important) A) in 1-to-1 conversation and B) in group conversation. Four statements referred to hearing aid use (e.g.: Not needing to constantly adjust the volume on my hearing aid.) therefore a N/A (not applicable) response option was added. This step concluded the participants’ involvement.
4. Data analysis and interpretation: The data were analysed using R-Cmap Software, an open-source tool implemented in R (Bar and Mentch Citation2017). The software follows the steps of the GCM as developed by Trochim (Citation1989). Sorting data is aggregated, and a similarity matrix is obtained. Data is analysed using multidimensional scaling (MDS) analysis, producing x and y coordinates for each statement, corresponding to a point on a map. The extent to which the original relative distances are preserved in the two-dimensional space is measured by a “stress” statistic. The more the MDS algorithm successfully preserved pairwise distances, the lower the stress (Bar and Mentch Citation2017). A hierarchical cluster analysis was applied to the MDS output, grouping these points into clusters. The result is a set of clusters, where clusters are maximally distinct (i.e., distant) from each other, and the points within each cluster are maximally similar (i.e., close) to one another. Finally, the analysis computes averages of importance for each type of conversation across participants to arrive at a statement average and then computes averages across all statements within a cluster to arrive at a cluster average on the scale in question. R-Cmap’s analysis of variance (ANOVA) and post-hoc analysis (Tukey) are limited to means comparisons between clusters within participant groups and within the type of conversation. Therefore, additional two-way mixed ANOVA analysis to compare means between NH versus IH groups in 1-to-1 and group conversations was computed using SPSS. The reliability of sorting and rating data was obtained by applying a split-half correlation process (Rosas and Kane Citation2012; Trochim, Cook, and Setze Citation1994) in SPSS.
Interpreting the maps: Once the concept map was obtained, the researchers analysed, interpreted, and named the clusters. The names were given considering the content of each cluster and were inspired by the titles participants gave to their groupings in the sorting step.
Results
The outcome for each activity is outlined below. We firstly report the results of the brainstorming, and then describe the concept map generated from the sorting (clustering) activity. We then report the data resulting from the rating activity, which is split into multiple sections. We compare the importance of each cluster by conversation type and by participant group, we explore in-depth the differences by hearing group, and finally we report differences between clusters within the same type of conversation.
Brainstorming
Participants created 263 statements that were reduced to 73 after trimming (Appendix A). Each statement expressed an idea of conversation success.
Sorting(clustering)
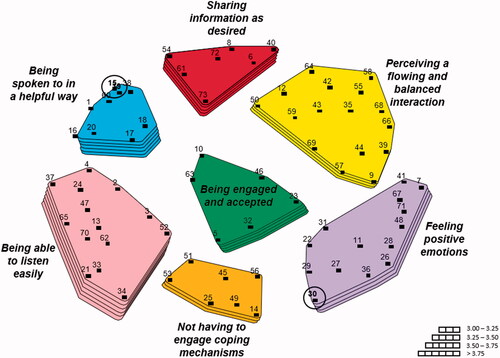
Participants created on average 6.3 groups (Min = 5; Max = 11; SD = 1.62). MDS analysis resulted in the point map shown in . Each point on the map represents one statement. The smaller the distance between two points, the more often the corresponding statements were grouped together by participants. E.g.: statement 1 (The speaker has a loud and clear speaking voice.) was more often grouped together with statement 15 (The speaker makes their points succinctly, without rambling.) than it was grouped with statement 30 (Feeling useful and appreciated). This map has a stress index of 0.325 which is considered to be a value within the acceptable range, as a stress value below 0.369 (Trochim Citation1989) indicates that discrepancies between the distances on the map and the values in the input similarity sort matrix are small.
Figure 1. The cluster map depicting seven clusters of conversation success. The number of layers represents the rating of overall importance given to each cluster.
Clusters of conversation success
To identify the most interpretable division of the data into clusters, we started from the minimum number created by participants (five), then increased the number of clusters until all clusters were internally consistent while being distinct from each other. As a concept map of six clusters contained one cluster with very dissimilar statements, and a map of eight clusters contained two very similar clusters, this left us with seven clusters. As a supplementary check, we also analysed the content of the clusters in a concept map version of three, four, nine, ten and eleven clusters. In all options below seven the content of each cluster lost homogeneity, and in all options above seven, the content of each cluster lost uniqueness. The reliability of the concept map was analysed by randomly distributing the participants into halves and obtaining a concept map for each (Rosas and Kane Citation2012; Trochim, Cook, and Setze Citation1994). Stress values obtained from split-half similarity matrices were correlated resulting in a Cronbach’s alpha of .89. This is higher than .86, the average found in sixty-nine GCM studies (Rosas and Kane Citation2012), indicating that the seven-clusters map possesses strong consistency.
The seven clusters of concepts related to conversation success are: (1) Being able to listen easily; (2) Being spoken to in a helpful way; (3) Being engaged and accepted; (4) Sharing information as desired; (5) Feeling positive emotions; (6) Perceiving flowing and balanced interaction; (7) Not having to engage coping mechanisms. A short description of each cluster along with some examples of statements can be seen in . The full list of statements/cluster is provided in Appendix A.
Table 2. Seven clusters representing factors that can lead to conversation success, a brief description, and examples of statements for each cluster.
Ratings of importance (cluster level)
The average importance ratings of the statements across all the statements within each cluster (see supplementary material) ranged from 4.4 for Being able to listen easily (the most important) to 3.3 for Not having to engage coping mechanisms (the least important).
Comparisons of cluster importance in group and 1-to-1 conversation
While the data obtained from the brainstorming and sorting activities were not specific to conversation type, the rating activity captured the importance perceived by participants in 1-to-1 conversations and group conversations separately. Split-half reliability tests found a Spearman-Brown correction above 0.90 for both types of conversation, consistent with the average correlation in prior GCM work (Rosas and Kane Citation2012).
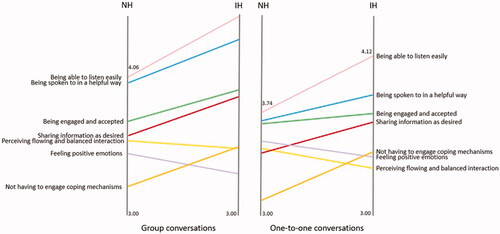
Seven two-way mixed ANOVA were performed, one for each cluster, to analyse the effect of hearing ability (NH and IH) and type of conversation (1-to-1 and group conversation) on the importance given to each cluster. Simple main effects results showed that the following three clusters were statistically more important in group conversation than in 1-to-1 conversation: Being able to listen easily F (1,27) =23.67, p < .001, Being spoken to in a helpful way F (1, 27) =13.52, p < .05 and Sharing information as desired F (1, 27) =.4.408, p > .05. ().
Figure 2. Laddergram showing differences between cluster averages per type of conversation for participants with normal and impaired hearing.
Exploratory analysis by hearing group
While the already mentioned two-way mixed ANOVAs were not significant, in further exploratory analyses a marginal effect was found between participants with NH and IH for the cluster ‘Being able to listen easily’ (p=.059) in one-to-one conversations, with higher scores of importance given by people with hearing impairment. Furthermore, while for NH participants only two clusters (Being spoken to in a helpful way and Being able to listen easily) were rated to be significantly more important in group conversation than in one-to-one conversation, for participants with IH four clusters registered a significant increase in group conversation (Being spoken to in a helpful way, Being able to listen easily, Being engaged and accepted, Sharing information as desired). This is consistent with the notion that relative to people with normal hearing, people with hearing loss experience a greater contrast in difficulty between 1-to-1 and group conversations.
Differences between clusters within the same type of conversation
ANOVA repeated measures analysis was used to compare the importance of each cluster with all other clusters for the same type of conversation across participant groups. A small p-value indicates that at least one cluster has a mean rating which is significantly different. Results showed that mean importance ratings differed between clusters within 1-to-1 conversation F(6, 66) =3.24, p=.007 and within group conversation F(6, 66)=9.07, p < 0.001. Given the results, Tukey’s method was used to perform pairwise comparison between all possible pairs of clusters. Being able to listen easily was significantly more important than several other clusters in both 1-to-1 and group conversation, whereas Being spoken to in a helpful way was only significantly more important than other clusters in group conversations (see ).
Table 3. Tukey p values for significant differences between clusters for each conversation type.
Discussion
This study aimed to identify the factors that relate to conversation success as expressed by people with normal and impaired hearing, and to investigate their importance in 1-to-1 conversations vs group conversations. Seven different clusters indicating distinct concepts relating to conversation success were obtained. The clusters, in order of their overall importance across conversation type and participant group were: (1) Being able to listen easily; (2) Being spoken to in a helpful way; (3) Being engaged and accepted; (4) Sharing information as desired; (5) Perceiving flowing and balanced interaction; (6) Feeling positive emotions; (7) Not having to engage coping mechanisms. The clusters Being able to listen easily, Being spoken to in a helpful way and Sharing information as desired were considered significantly more important in group conversations compared to 1-to-1 conversations across participant groups.
Content of clusters
Interestingly, some of our clusters fit well with prior work (Rubin, Perse, and Barbato Citation1988), though others are novel. The motives to engage in communication found by Rubin, Perse, and Barbato (Citation1988) are well reflected in the content of some clusters. For Rubin et al., motivations to engage in interactions were inclusion, pleasure, affection, escape, relaxation, and control. Rubin’s ‘inclusion’ involves sharing feelings with others and overcoming loneliness, while ‘affection’ points out the will to express caring and appreciation for others. These two motives are compatible with our cluster Being engaged and accepted. Furthermore, Rubin’s “pleasure” refers to communicating because it is fun, entertaining, and stimulating, and “relaxation” refers to using interaction as a method to relax and unwind. These two motives correspond well to the content of our cluster Feeling positive emotions. Finally, Rubin’s “Control” is described as using communication as an instrument to gain compliance which may be considered similar with the cluster Sharing information as desired. Rubin’s “Escape” motive, however, is not reflected in our clusters.
The cluster rated as most important by both groups is Being able to listen easily. Participants grouped together items referring to low effort, for example: 13. Not having to strain to hear the other person, with items referring to low background noise, for example: 65. Being in a quiet place without background noise or music., as well as with items expressing the need for working hearing aids e.g.: 33. Hearing aids working (e.g.: not whistling, coming loose or batteries going flat). All these items have one thing in common: the ability to perceive sounds. Listening effort increases in various situations, such as a noisy environment, or when the listener has hearing loss, and this cluster seems to group items contributing to the effort involved in listening. For people with hearing loss, working hearing aids can reduce effort (Ohlenforst et al. Citation2017; Picou, Ricketts, and Hornsby Citation2013), explaining their appearance in this cluster.
The second most important cluster, Being spoken to in a helpful way, contains ideas that encompass a set of qualities expected from the speaker. For instance, voice volume and intelligibility are reflected in statement 1. The speaker has a loud and clear speaking voice. In line with the theory of audience design (Hadley, Naylor, and Hamilton Citation2022), speakers who form their messages according to the listener’s needs are perceived as ‘helpful’ by listeners. This can be seen when speakers articulate their speech more clearly when talking with a person with hearing loss (Scarborough and Zellou Citation2013), and also in the Lombard effect, whereby speakers increase voice intensity in loud noise (Lombard Citation1911). However, domains other than the acoustical can also contribute to speaking in a helpful way such as the way in which ideas are structured (19. The speaker is not making too many points in the one statement.) as well as other multimodal aspects of speech (18. The speaker is looking towards the listener rather than around.). These statements show that consistent information is perceived as helpful even when it is coming from different sources (audio-visual). In fact, it has been shown that multimodal messages (audio-visual speech) appear to be processed faster than unimodal (audio speech) messages due to gestalt recognition (Holler and Levinson Citation2019).
It is important to note that these two clusters (Being able to listen easily and Being spoken to in a helpful way) are both concerned with ease of speech recognition. Elements related to the “transmitter” (speaker) component of the transmission chain constitute a distinct group (cluster Being spoken to in a helpful way), whereas elements related to the “channel” (environment, devices) and “receiver” (hearing ability) are merged in one group (cluster Being able to listen easily).
The Being engaged and accepted cluster reflects the human need for connection through interaction. This cluster differs from those above in tackling psychosocial aspects of conversation success. People perceive conversation success when there is a connection among interlocutors on different levels: behavioural (5. Body language reflecting engagement, e.g.: nodding, smiling), cognitive (10. Being able to fully understand the topic), and emotional (32. Feeling comfortable when asking or being asked for something to be repeated.). From an evolutionary perspective, it is appropriate for humans to want to connect and belong in communities. Everyone wants to have successful conversations as these might expand or strengthen their social bonds.
In the cluster Sharing information as desired participants grouped items that referred to the goal of the conversation: 8. Communicating a want or a task. with items that indicated the context of the conversation: 54. Being able to clearly communicate with professionals (e.g.: doctor) as well as with items that were representing feelings associated with a transactional conversation: 61. Feeling professional. The statements of this cluster are particularly relevant for transactional conversations (Clark et al. Citation2019) where success is perceived when the goal is achieved.
The cluster Perceiving flowing and balanced interaction confirms that successful conversation is a dynamic interaction and requires engagement from all parties (e.g.: 42. Participants are fully engaged and contributing.) as well as adherence to the unwritten rules of turn-taking (e.g.: 43. Participants do not interrupt or talk over the top of each other) (Grice Citation1975). In successful conversations, interlocutors resemble dancers that follow a certain rhythm, maintaining synchrony and balance while smoothly coordinating successive elements.
Feeling positive emotions contains fourteen statements expressing feelings that can appear during a conversation (28. Feeling joy in chatting with another human being.) and continue or appear after a conversation (27. Leaving a conversation feeling pepped up). It is known that people want to converse because it is fun and stimulating (Rubin, Perse, and Barbato Citation1988), but what is notable, is that our participants reflected a lot on the continuation of positive feelings after the event. Sometimes the positive feelings related to the conversation can continue long after the conversation finished.
The cluster Not having to engage coping mechanisms reveals the emotional struggle to engage in successful conversations. Conversations are not always easy, especially for people with hearing difficulties. For instance, during conversations they can feel negative emotions (e.g.: frustration, withdrawal) linked to hearing loss (Holman, Ali, and Naylor Citation2021). Statements like 14. Not feeling anxious and 49. Not finding myself withdrawing from the conversation. show that people not only identify the positive feelings during conversation, but also the absence of negative feelings/coping behaviours.
These findings emphasise that conversation success is a shared responsibility among interlocutors. While some results (Being able to listen easily) show support for hearing aid use, others (Being spoken to in a helpful way and Not having to engage coping mechanisms) show support for a more holistic approach. In addition to hearing aid use, these results endorse the provision of family centred care and participation in aural rehabilitation programs with frequent communication partners.
Important to note is that although each cluster is unique, there are overlapping ideas between them. For example, the cluster Perceiving flowing and balanced interaction contains a statement (9. A balance between seriousness and humour) that is very close to the cluster Feeling positive emotions. This conceptual overlap is reflected in the physical distance that appears on the cluster map () between the statement 9 and the cluster Feeling positive emotions. These overlaps are common in GCM studies since participants are encouraged to sort the statements in a way that makes sense to them, without being guided to think about a certain logic. Also, even if participants answer the same brainstorming prompt, contradictory ideas can appear, e.g.: 67. Not having any pressure regarding the outcomes of the conversation. and 72. Achieving a desired outcome.
Importance of the clusters
Even the least important cluster, Not having to engage coping mechanisms, has an average importance rating above 3 (‘moderately important’). Therefore, none of the clusters can be considered unimportant. This is a natural consequence of the elicitation approach in the brainstorming step. Although participants were not directly prompted to describe aspects of conversation success that are important for them, it might be that, naturally, the ideas that sprang to their mind were those that they considered important.
The clusters Being able to listen easily and Being spoken to in a helpful way had highest ratings of importance in both types of conversation. These two clusters are linked to the sensory aspects of face-to-face conversation (hearing and vision). High importance ratings might suggest that sensory deficits come with a high cost for conversation success. For instance, a face-to-face conversation might go on and be perceived as successful even if it is not flowing smoothly, whereas a face-to-face conversation where interlocutors can neither hear nor see each other is almost impossible.
Six out of seven clusters registered a higher average importance rating in group than in 1-to-1 conversation, suggesting that the challenge increases with the number of participants. One explanation could be based on the potential link between importance and difficulty. Being able to listen easily, Being spoken to in a helpful way and Sharing information as desired are perhaps more difficult to achieve when time and space are shared with more than one person, and this might be why these clusters have been rated as more important. The contrast between importance in 1-to-1 and group conversation was larger for people with hearing loss, suggesting that they might exert more effort in the simultaneous presence of multiple conversation partners. Conversely, the cluster Feeling positive emotions was considered slightly less important in group than in 1-to-1 conversation, indicating that when more people are involved, personal feelings can perhaps take a back seat in favour of other aspects of conversational success.
Strengths and limitations
GCM is a flexible method that involves each participant brainstorming, sorting, and rating ideas either on their own or collectively in a group. In this study, people worked individually, rather than in a group. An advantage was the fact that participants were not influenced by each other’s ideas, though it is possible that collective brainstorming using the same prompts might have generated a slightly different result. The current study succeeded in bringing together perspectives of older adults with normal and impaired hearing despite the pandemic context of SARS-CoV-2. This has been possible because all three participatory steps were web-based activities. Another strength of this method is the fact that researchers’ influence is limited, allowing participants to sort ideas into groups in ways that make sense to them.
Refining and trimming the statements generated in the brainstorming part is a mandatory step of the process for several reasons. Raw statements can contain information that would impede the sorting and rating activities. For example, raw statements might hold irrelevant answers to the focus question, personal information, jargon elements, typos, repetitive ideas, or multiple ideas within the same statement. Also, sorting and rating a large number of statements might become a burden for participants. Rosas and Kane (Citation2012) found that an average of 96.3 statements have been used in more than sixty GCM studies. In this study, we started with 263 statements, which were trimmed to 73. While trimming is a necessary step, it comes with some drawbacks. For instance, repetitive statements are pointing out a prevalent idea within the sample group. Through trimming, a prevalent idea could lose its power, as an idea could repeat many times in the raw statements, but after trimming may appear only once. As an example, within the raw statements of this study we found 16 statements referring to the need to ask for repetition (i.e.: Not having to ask someone to repeat what was said), but after trimming we ended up with only 3. We might find the prevalence reflected in the importance ratings. However, if the idea is very common but not important, information is lost in the process. Also, some statements were edited in the trimming process. For example, ‘the person who is talking has a loud and clear speaking voice’ was edited to ‘the speaker has a loud and clear speaking voice’. Edits such as this resulted in several statements that all started with the words ‘the speaker’ and this might be a reason why they have been grouped together by the participants.
A potential limitation is the relatively small number of participants, and the homogeneity of the participants. It is possible that a more heterogeneous group would have produced more variety in their responses: we chose to investigate only 50- to 75-year-old adults based in Glasgow and from a relatively homogeneous participant pool. A larger number of participants in the brainstorming part might have provided more ideas. Our study did elicit 263 initial statements, though these contained many duplicates from both groups. A different concept map could have been produced for the same target concept if we had broadened our selection criteria (as, for example, younger adults could have quite different priorities in conversation). Another consideration related to the participants is the fact that most of them (n = 20) were retired. Retirement might constrain the type, the frequency, and the environment of their interactions; therefore it is possible that their idea of conversation success is influenced by their work status.
Another point to note is that the normal hearing participants were recruited from the same participant pool as the impaired hearing group. Participants enter this pool if, at some point in the last five years, they have been to an audiological check at Glasgow Royal Infirmary and given their consent to be part of our participant panel. Therefore, although their audiograms showed audiometrically normal hearing, they may have had some other hearing-related complaints.
Conclusion
The present study was designed to determine how people with normal and impaired hearing understand conversation success in 1-to-1 and group conversations. Seven unique factors that relate to conversation success were identified: (1) Being able to listen easily; (2) Being spoken to in a helpful way; (3) Being engaged and accepted; (4) Sharing information as desired; (5) Perceiving flowing and balanced interaction, (6) Feeling positive emotions; (7) Not having to engage coping mechanisms. The second aim of this study was to investigate how these factors differ in 1-to-1 versus group conversations. The results of this investigation show that Being able to listen easily, Being spoken to in a helpful way and Sharing information as desired are significantly more important in group than in 1-to-1 conversations for all participants. No significant differences were found between people with normal and impaired hearing in terms of importance of these factors. Future research could explore what behaviours are correlated with conversation success or investigate ways to measure success in distinct types of conversations (social, transactional). Also, future work is required to better understand success in group conversations and how participants adapt to the environment in order to maintain conversation success. Our findings suggest that perceived conversation success is a multifaceted concept that encompasses elements of the classic communication chain (speaker, channel, listener) together with subjective components such as feelings and coping strategies. These results bring us closer to understand what is desired from a human-to-human conversation.
Supplemental Material
Download MS Word (18.8 KB)Acknowledgements
The authors thank all the participants who took part in the study and Dr. Haim Bar for his guidance in using R-CMap software.
Disclosure statement
No potential conflict of interest was reported by the author(s).
Additional information
Funding
References
- Bar, H., and L. Mentch. 2017. “R-CMap—An Open-source Software for Concept Mapping.” Evaluation and Program Planning 60:284–292. doi:10.1016/j.evalprogplan.2016.08.018.
- Bennett, R., C. Meyer, R. Eikelboom, and M. Atlas. 2018. “Investigating the Knowledge, Skills, and Tasks Required for Hearing Aid Management: Perspectives of Clinicians and Hearing Aid Owners.” American Journal of Audiology 27 (1):67–84. doi:10.1044/2017_AJA-17-0059.
- Clark, L., N. Pantidi, O. Cooney, P. Doyle, D. Geraialde, J. Edwards, B. Spillane, E. Gilmartin, C. Murad, C. Munteanu, V. Wade, and B. Cowan. 2019. arXiv:1901.06525 [cs.HC], Conference on Human Factors in Computing Systems, Glasgow, Scotland, UK, May 4–9.
- De Ruiter, J. P., H. Mitterer, and N. J. Enfield. 2006. “Projecting the End of a Speaker’s Turn: A Cognitive Cornerstone of Conversation.” Language 82 (3):515–535. doi:10.1353/lan.2006.0130.
- Foltz, A., J. Gaspers, C. Meyer, K. Thiele, P. Cimiano, and P. Stenneken. 2015. “Temporal Effects of Alignment in Text-Based, Task-Oriented Discourse.” Discourse Processes 52 (8):609–641. doi:10.1080/0163853X.2014.977696.
- Garrod, S., and M. J. Pickering. 2004. “Why is Conversation So Easy?” Trends in Cognitive Sciences 8 (1):8–11. doi:10.1016/j.tics.2003.10.016.
- Glista, D., R. O'Hagan, S. Moodie, and S. Scollie. 2021. “An Examination of Clinical Uptake Factors for Remote Hearing Aid Support: A Concept Mapping Study with Audiologists.” International Journal of Audiology 60 (sup1):S13–S22. doi:10.1080/14992027.2020.1795281.
- Grice, H. P. 1975. “Logic and Conversation.” In Syntax and Semantics. Leiden, The Netherlands: Brill. doi:10.1163/9789004368811_003.
- Hadley, L. V., N. K. Fisher, and M. J. Pickering. 2020. “Listeners are Better at Predicting Speakers Similar to Themselves.” Acta Psychologica 208:103094. doi:10.1016/j.actpsy.2020.103094.
- Hadley, L. V., G. Naylor, and A. F. d C. Hamilton. 2022. “A review of theories and methods in the science of face-to-face social interaction.” Nature Reviews Psychology 1 (1):42–54. doi:10.1038/s44159-021-00008-w.
- Holler, J., and S. C. Levinson. 2019. “Multimodal Language Processing in Human Communication.” Trends in Cognitive Sciences 23 (8):639–652. doi:10.1016/j.tics.2019.05.006.
- Holler, J., and K. Wilkin. 2011. “Co-Speech Gesture Mimicry in the Process of Collaborative Referring during Face-to-Face Dialogue.” Journal of Nonverbal Behaviour 35:133–153. doi:10.1007/s10919-011-0105-6.
- Holman, J., Y. Ali, and G. Naylor. 2021. “A Qualitative Investigation of the Hearing and Hearing-aid Related Emotional States Experienced by People with Hearing Loss.” Preprint. doi:10.31235/osf.io/5ybps.
- Holman, J. A., A. Drummond, S. E. Hughes, and G. Naylor. 2019. “Hearing Impairment and Daily-life Fatigue: A Qualitative Study.” International Journal of Audiology 58 (7):408–416. doi:10.1080/14992027.2019.1597284.
- Kahler, T. 2008. The Process Therapy Model: The Six Personality Types with Adaptations. Little Rock, AR: Taibi Kahler Associates, Inc.
- Lind, C., L. Hickson, and N. P. Erber. 2006. “Conversation Repair and Adult Cochlear Implantation: A Qualitative Case Study.” Cochlear Implants International 7 (1):33–48. doi:10.1002/cii.20.
- Lombard, E. 1911. “Le signe de l'elevation de la voix.” Ann. Mal. Oreil. LARYNX 37:101–199.
- McCaffrey, S. A., E. Chiauzzi, C. Chan, and M. Hoole. 2019. “Understanding'Good Health care' from the Patient's Perspective: Development of a Conceptual Model Using Group Concept Mapping.” The Patient 12 (1):83–95. doi:10.1007/s40271-018-0320-x.
- Meyer, C., M. Waite, J. Atkins, K. Ekberg, N. Scarinci, C. Barr, R. Cowan, and L. Hickson. 2022. “How Can eHealth Meet the Hearing and Communication Needs of Adults With Hearing Impairment and their Significant Others? A Group Concept Mapping Study.” Ear and Hearing 43 (2):335–346. doi:10.1097/AUD.0000000000001097.
- Ohlenforst, B., A. A. Zekveld, E. P. Jansma, Y. Wang, G. Naylor, A. Lorens, T. Lunner, and S. E. Kramer. 2017. “Effects of Hearing Impairment and Hearing Aid Amplification on Listening Effort.” Effects of Hearing Impairment and Hearing Aid Amplification on Listening Effort : A Systematic Review 38 (3):267–281. doi:10.1097/AUD.0000000000000396.
- Picou, E., T. Ricketts, and B. Hornsby. 2013. “How Hearing Aids, Background Noise, and Visual Cues Influence Objective Listening Effort.” Ear and Hearing 34 (5): e52–e64. doi:10.1097/AUD.0B013E31827F0431.
- Poost-Foroosh, L., M. B. Jennings, L. Shaw, C. N. Meston, and M. F. Cheesman. 2011. “Factors in Client–Clinician Interaction That Influence Hearing Aid Adoption.” Trends in Amplification 15 (3):127–139. doi:10.1177/1084713811430217.
- Ramsberger, G., and B. Rende. 2002. “Measuring Transactional Success in the Conversation of People with Aphasia.” Aphasiology 16 (3):337–353. doi:10.1080/02687040143000636.
- Rönnberg, J., E. Holmer, and M. Rudner. 2019. “Cognitive Hearing Science and Ease of Language Understanding.” International Journal of Audiology 58 (5):247–261. doi:10.1080/14992027.2018.1551631.
- Rosas, S., and M. Kane. 2012. “Quality and Rigor of the Concept Mapping Methodology: A Pooled Study Analysis.” Evaluation and Program Planning 35 (2):236–245. doi:10.1016/j.evalprogplan.2011.10.003.
- Rubin, R. B., E. M. Perse, and C. A. Barbato. 1988. “Conceptualization and Measurement of Interpersonal Communication Motives I Shape and Nurture Their Self-concepts, Make Decisions About.” Human Communication Research 14 (4):602–628. doi:10.1111/j.1468-2958.1988.tb00169.x.
- Scarborough, R., and G. Zellou. 2013. “Clarity in Communication: “Clear” Speech Authenticity and Lexical Neighborhood Density Effects in Speech Production and Perception.” The Journal of the Acoustical Society of America 134 (5):3793–3807. doi:10.1121/1.4824120.
- Stephens, G. J., L. J. Silbert, and U. Hasson. 2010. “Speaker-listener Neural Coupling Underlies Successful Communication.” Proceedings of the National Academy of Sciences of the United States of America 107 (32):14425–14430. doi:10.1073/pnas.1008662107.
- Strawbridge, W. J., M. I. Wallhagen, S. J. Shema, and G. A. Kaplan. 2000. “Negative Consequences of Hearing Impairment in Old AgeA Longitudinal Analysis.” The Gerontologist 40 (3):320–326. doi:10.1093/geront/40.3.320.
- Trochim, W. 1989. “An Introduction to Concept Mapping for Planning and Evaluation.” Evaluation and Program Planning 12 (1):1–16. doi:10.1016/0149-7189(89)90016-5.
- Trochim, W., J. A. Cook, and R. J. Setze. 1994. “Using Concept Mapping to Develop a Conceptual Framework of Staff’s Views of a Supported Employment Program for Individuals With Severe Mental Illness.” Journal of Consulting and Clinical Psychology 62 (4):766–775. doi:10.1037/0022-006X.62.4.766.
- Tye-Murray, N. 2003. “Conversational Fluency of Children Who Use Cochlear Implants.” Ear and Hearing 24 (1 SUPPL):82–89. doi:10.1097/01.aud.0000051691.33869.ec.
- Vas, V., M. A. Akeroyd, and D. A. Hall. 2017. “A Data-Driven Synthesis of Research Evidence for Domains of Hearing Loss, as Reported by Adults With Hearing Loss and Their Communication Partners.” Trends in Hearing 21. doi:10.1177/2331216517734088.
- Zevon, M. A., S. Schwabish, J. P. Donnelly, and R. Kerry. 2007. “Medically Related Legal Needs and Quality of Life in Cancer Care: A Structural Analysis.” Cancer 109 (12):2600–2606. doi:10.1002/cncr.22682.