
 ?Mathematical formulae have been encoded as MathML and are displayed in this HTML version using MathJax in order to improve their display. Uncheck the box to turn MathJax off. This feature requires Javascript. Click on a formula to zoom.
ABSTRACT
Given the constraints of energy, environment, and climate change in the process of economic development, transitioning to a low-carbon economy by such means as the construction of low-carbon cities is a feasible approach to a sustainable development pattern that balances energy conservation, environmental protection, and economic growth. Utilizing the data of listed companies in China A-shares market over the period 2007–2016, we treat China’s low-carbon city pilot policy (LCCPP) as a quasi-natural experiment and adopt a difference-in-differences approach to explore the effect of LCCPP on the total factor productivity (TFP) of firms. Firm TFP is found to be negatively associated with the implementation of LCCPP. Our mechanism analysis reveals that the LCCPP stimulates innovation by firms in China, consistent with the weak Porter hypothesis. Moreover, the negative relationship between the LCCPP and TFP holds more strongly in larger firms or those located in the eastern region.
JEL:
1. Introduction
Global warming resulting from the emission of greenhouse gases (GHG), especially CO2, has aroused widespread attention due to its threats to biodiversity and the well-being of future generations. Total GHG emissions have grown at 1.5 percent per year over the last decade (2009-2018). The growth in global GHG emissions increased at a rate of 2.0 percent, reaching 51.8 gigatonnes in CO2 equivalent (GtCO2e) without land-use change (LUC) in 2018, and there is no sign of a peak in any of these emissions (Olivier & Peters, Citation2019).Footnote1 As the largest energy consumer in the world, China emits more than one-quarter of global emissions (excluding LUC). Despite a significant contribution to the slowdown in global emissions from 2014 to 2016, emissions in China rise again, growing 2.5 percent in the last decade and 1.6 percent in 2018, to reach a record high of 13.7 GtCO2e in 2018 (United Nations Environment Programme, Citation2019). As a major responsible country, and to cope with climate change and achieve its sustainable development goals, China has been working hard to save energy, reduce emissions, adjust energy structure, and advance green and low-carbon economic and social development. This is also an inevitable requirement of high-quality development.Footnote2
One's understanding of the transformation of the global climate governance model can benefit from exploring the construction of low-carbon cities in China. The Paris Agreement affirmed the important role of non-government actors in global climate governance, and established the Intended Nationally Determined Contributions (INDCs). China’s low-carbon city pilot policy (LCCPP) reflects the responsibility of local government for climate change under the mode of government-leading and business-participation. Based on expectations of high-quality development, both green and low-carbon development and innovation-driven development are inherent requirements. At present, the Chinese economy is in a critical period in which both of the aforementioned types of development are occurring. After implementation of low-carbon regulations, to achieve the target of energy conservation and emission reduction, companies inevitably must conduct low-carbon technology research and development (R&D), and continuously improve their capability with environmental technology innovation. In this case, in addition to achieving the goal of low-carbon development by promoting enterprises to reduce emissions, does the low-carbon regulatory policy further enhance their total factor productivity (TFP)? The answer to this question is of great significance for achieving high-quality development. To address the question, it is practical to explore whether the LCCPP can affect firm TFP or in other words, whether the implementation of LCCPP conforms to the Porter hypothesis.
To explore the impact of LCCPP on TFP, it is necessary to clarify the theoretical relationship between environmental regulation and firm TFP. The existing literature related to this can be summarized into four categories. First, environmental regulation generates compliance costs and increases the total production costs of firms. This is equivalent to imposing new constraints on production decisions and increasing the difficulty of management, production, and sales, and thus reducing their TFP (Christainsen & Haveman, Citation1981; Gray & Shadbegian, Citation1993).
The second view is the Porter hypothesis. There are three versions of this hypothesis. The narrow Porter hypothesis emphasizes that more flexible environmental policy tools, such as pollution charges and emissions trading, can stimulate corporate innovation more favorably than can be achieved with mandatory management. The weak Porter hypothesis states that stricter environmental regulation promotes innovation, but their combined effects are uncertain. The strong Porter hypothesis affirms that the innovation offset effect caused by well-designed regulation can be sufficient to compensate for the compliance costs, thereby improving enterprise productivity to a certain extent (Greenstone, List, & Syverson, Citation2012; Jaffe & Palmer, Citation1997; Porter & Linde, Citation1995). The narrow version of Porter hypothesis emphasizes the types of environmental regulatory policy, and the use of market or government mandate has different impacts on TFP. The weak version of Porter hypothesis stresses the effect of environmental regulation on innovation, and it is a prerequisite for the strong Porter hypothesis. This paper aims to test the weak and strong version of Porter hypothesis. Third, some studies suggest that environmental regulation is only a potential factor for TFP improvement, but fails to indicate its impact on TFP (Jaffe, Citation1995; Palmer, Oates, & Portney, Citation1995). Fourth, there is a complex and indeterminate nonlinear relationship between environmental regulation and firm TFP. For example, different levels of environmental regulation may have different effects on TFP. Although the Porter hypothesis affirms a positive impact of environmental regulation (under a reasonable level) on TFP, the regulation most Chinese firms encounter have yet reached an intensity that would stimulate technological innovation (Wang & Liu, Citation2014). In summary, the impact of environmental regulation on firm TFP is still away from reaching an agreement in theory.
In terms of empirical research, the studies that test the weak version of Porter hypothesis have reached a relatively consistent conclusion. In general, there is a positive association between environmental regulation and technological innovation (Lanoie, Laurent-Lucchetti, Johnstone, & Ambec, Citation2011; Rubashkina, Galeotti, & Verdolini, Citation2015), but the debate over the strong Porter hypothesis is still controversial. Most empirical literature finds that environmental regulation leads to a fall in firm productivity (Greenstone, Citation2002; Rassier & Earnhart, Citation2010; Zhao & Sun, Citation2016), whereas others indicate a positive association (Berman & Bui, Citation2001; Jefferson, Tanaka, & Yin, Citation2013), or even no influence on the competitiveness of firms (Anger & Oberndorfer, Citation2008; Lanoie, Laurent-Lucchetti, Johnstone, & Ambec, Citation2011). From the perspective of industry, Cole, Elliott, and Okubo (Citation2010) and Cole, Elliott, and Shimamoto (Citation2005) use the US and Japanese industrial data and find a negative effect of environmental regulation on industrial competitiveness. According to the pollution shelter hypothesis, environmental regulation internalizes the external pollution faced by companies, which increases their cost and impairs their export competitiveness (Baumol & Oates, Citation1988; Ollivier, Citation2016). Costantini and Mazzanti (Citation2012) instead find that environmental policies do not reduce the export competitiveness of manufacturing firms. In addition, Albrizio, Kozluk, and Zipperer (Citation2016) employ a combination of multinational industry- and firm-level data and find that environmental regulation promotes the productivity of the most productive one-fifth of firms, and reduces the productivity of those with lower rankings. Peuckert (Citation2014) shows that in the short run, the cost of compliance due to environmental regulation is negatively related to competitiveness, while from a long-run perspective, the rise in intensity and effective implementation of regulation is conducive to the improvement in competitiveness.
There is also a set of literature working on the case of China. For example, Jin and Lin (Citation2014) test whether the air pollution levy improves firms’ technical efficiency and find that the levy rates improve their efficiency, while pollution quantity control targets show an insignificant effect. Naso, Huang, and Swanson (Citation2020) investigate how firm TFP varies with an introduction of environmental regulation in China, and find that the regulation reallocates TFP across cities. When the regulation becomes effective, cities with lower level of firm productivity then experience an increase in productivity.
In addition, a series of articles further analyzes the relationship between environmental regulation and green total factor productivity (GTFP). Telle and Larsson (Citation2007) find that the intensity of environmental regulation has a positive effect on GTFP, but its correlation with TFP is insignificant. However, from the perspective of high-quality development, whether environmental regulation can simultaneously produce economic effects is of great significance for countries in formulating their environmental regulatory policies. Hamamoto (Citation2006) and Yang, Tseng, and Chen (Citation2012) use relevant manufacturing data for Japan and Taiwan to test the relationship among the intensity of environmental regulation, innovation activities, and TFP. Their results show that expenditures on pollution control are positively correlated with R&D investment, and the rise in R&D investment resulting from environmental regulation significantly promotes the further growth of TFP.
For the low-carbon policy, the existing literature widely focuses on its effect on the CO2 emission and the environment (Gehrsitz, Citation2017; Shen, Wu, Shuai, Lu, Chau, & Chen, Citation2018), rather than on economic outcomes, in particular the technological innovation and productivity of firms. Jiang (Citation2015) proposes that a less developed pilot city, such as Guangyuan, could solve the CO2 emission dilemma while seeking its economic growth. Yang, Tseng, & Chen, (Citation2017) find that the feasible low-carbon policy is conducive to promoting energy substitution and improving energy efficiency and industrial transformation, and as a result increases the level of energy technology innovation. Cheng, Yi, Dai, and Xiong (Citation2019) adopt the difference-in-differences model to explore the impact of China’s low-carbon city construction on the GTFP of cities. Low-carbon pilot cities are not only the main battlefields for controlling GHG emissions, but also the critical action units for promoting high-quality economic development. However, extensive research regarding the economic effects of LCCPP is still limited.
We believe this paper makes three contributions as follows. First, although current literature addressing environmental regulation and TFP or GTFP is relatively abundant, studies on the microeconomic impact of LCCPP at the firm level are rare. This paper examines how the LCCPP affects firm TFP by utilizing the data on China A-shares listed companies. Second, this paper uses the LCCPP as a quasi-natural experiment to construct a multi-period difference-in-differences (DID) model to alleviate the problem of endogeneity. Third, our results conform to the weak Porter hypothesis, instead of the strong Porter hypothesis, which provides new insights for achieving a win-win situation between low-carbon and high-quality economic development. This can also be applied to cities in other developing countries seeking for a balance among energy conservation, environmental protection, and economic growth.
The next section introduces a policy background. Section 3 describes the data and methodology. Section 4 contains the estimation results, and section 5 concludes.
2. Policy background
2.1. The construction of low-carbon cities in China
In China, cities have a heavy obligation to deal with climate change and reduce GHG emissions. In November 2009, China’s State Council executive meeting proposed that compared with 2005, China’s CO2 emissions per unit of GDP must be reduced by 40% to 45% by 2020, and the ratio of non-fossil energy to primary energy consumption should be increased to 15%. To cope with the global climate change and energy crises and accelerate the transformation of economic development, China’s central and local governments have implemented a substantial number of CO2 emission reduction policies over the past few years (Wang, Song, He, & Qi, Citation2015).
In 2010, China’s National Development and Reform Commission (NDRC) began the construction of low-carbon provinces, regions, and cities. Five provinces and eight cities were listed in the first batch of pilots. In order to comprehensively promote the construction of an ecological civilization, the NDRC further launched the second batch (1 province and 28 cities) in 2012. This emphasizes the need to establish a responsibility system for controlling GHG emissions, and clarifies the allocation and assessment of emission reduction tasks. Later, with incorporation of the elements of the Paris Agreement, cities were to play an increasingly significant role in climate change. To achieve the goal of emission reduction, energy constraints relief, and adaption to climate change, in 2017, the NDRC issued the Notice on the Third Batch of National Low-Carbon City Pilot Projects to further expand the scope of pilots. The third batch includes 41 cities and 4 counties and districts. Compared with the former two batches, the third is more widely and evenly distributed (see ).
Figure 1. Distribution of three batches of low-carbon pilots in China
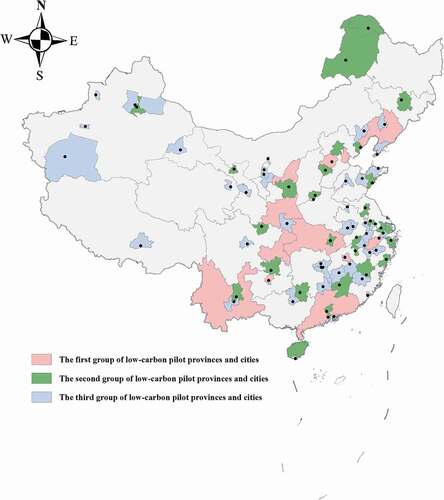
The identification of low-carbon cities is based on the comprehensive consideration of the representativeness of cities, rather than their geographical location and economic development level. This attempt is beneficial to explore a replicable and extendable development mode for other cities. Indeed, the location of these three batches is relatively evenly distributed, and each batch covers the east, middle, and west part of China. Specifically, the first two batches cover most provinces (with at least one low-carbon pilot city) except for Hunan, Ningxia, Tibet, and Qinghai provinces. In addition, the pilot cities are widely representative, including both science and financial center such as Shanghai, resource-based city such as Jinchang, special economic zone such as Shenzhen, and old revolutionary base area such as Yan’an. Therefore, the selection of pilot cities indicates an absence of sample selection bias and related endogenous problems.
2.2. The theory
According to the low-carbon construction, the LCCPP can be summarized by the following measures: First, compile low-carbon development plans and formulate low-carbon technology roadmaps, especially in the areas of clean energy, circular economy, construction and transportation; Second, implemente mandatory systems and regulations (i.e., carbon emission control system, carbon emission report and verification, and punishment system), carry out the statistics, monitoring, and evaluation of GHG, and require firms to publicly disclose their energy conservation and emission reduction status, and similar reporting; Third, provide special funds and financial incentives, such as setting up special funds for low-carbon development to subsidize enterprises in pilot cities; Fourth, promote low-carbon consumption and lifestyles. It is obvious that the regulatory measures mostly focus on the production side, and companies are expected to bear the most difficult tasks during this construction.
Note that the LCCPP is distinct from previous environmental regulations. It is a comprehensive environmental regulation that relates to multiple fields, such as energy, construction, transportation, and consumption. The LCCPP not only improves the environment by optimizing energy efficiency and structure (Shen, Wu, Shuai, Lu, Chau, & Chen, Citation2018; Su, Liang, Chen, Chen, & Yang, Citation2012), but also has externalities that stimulate industrial and technological progress, promote the agglomeration of new industries, and provide upgrades to high-energy-consuming industries (Liu & Qin, Citation2016). This paper thus explores the influence of LCCPP via the channel of cost and technology innovation. The mechanism is presented in .
Figure 2. The mechanism of LCCPP that affects firm total factor productivity
For the cost channel, on the one hand, low-carbon cities implement compulsory systems and regulations to encourage firms to reduce emissions at the cost of increased compliance costs. This then increases their total costs and hinders productivity. Specifically, low-carbon pilot cities establish the carbon emission control system, quota management system, carbon emission trading, carbon emission report and verification, punishment, and legal regulation covering economic and industrial development, construction, transportation, water resources, and ecological environment. These cities also set up mandatory standards for firms and implement an industry admittance system. Those firms that fail to meet the standards are required to strictly restrict their emissions of waste gas and water during production. Thus, in practice, pollution control and emission reduction expenditure are required for ensuring low carbon levels, which increases firm costs and hinders productivity improvements.
On the other hand, low-carbon pilot cities adjust the costs and benefits of energy conservation and emission reduction through financial support and economic incentives. First, low-carbon pilot cities set up special funds for low-carbon development that mainly subsidize firms located in pilot cities through investment subsidies, loan on favorable terms, tax incentives, and financial subsidies. After implementation of LCCPP, taking its environmental and social costs into account, the government formulates a reasonable energy price policy and offers certain benefits for the use of new materials, new energy, and new technologies. In addition, the pilot cities guide the development of low-carbon industry through the government procurement of low-carbon products and priority services. These preferential measures will increase the income of firms in pilot cities and compensate for the increased costs caused by policy regulation.
In terms of the technological innovation channel, low-carbon pilot cities support and encourage the technological innovation by low-carbon industry, generating an innovation offset effect. The pilot cities establish a system for low-carbon technology research and development. They further formulate a low-carbon technology roadmap, and provide supports for product industrialization. Consequently, the transformation of traditional industries is conducive to improving local firm TFP, and the exit (or shutdown) of low-efficiency but high-pollution firms can improve the average level of productivity. In addition, low-carbon pilot cities force firms to reduce emissions due to performance assessment and information disclosure, thus urging them to conduct technological innovation and increase productivity. Precisely, the pilot cities evaluate the completion of low-carbon tasks, which is included in the local annual target responsibility assessment system. They also require firms (or a voluntary basis) to publicly disclose their energy conservation and emission reduction status. As a consequence, firms reduce emissions under the pressure of government and consumer, to some extent promoting their technological innovation.
In summary, the impact of LCCPP implementation on firm TFP depends on its cost effect and technological progress. In the context of China’s vigorous implementation of LCCPP, this paper implies a positive influence of the policy on firm productivity and competitiveness in the long term. However, whether the innovation compensation effect on TFP can counterbalance the negative effect due to increased regulatory costs remains to be explored.
The above analysis focuses on the average effect of LCCPP on firm TFP. Indeed, due to different conditions of carbon emissions among cities, the pressure to reduce emissions differs, leading to differences in specific approach and policy implementation intensity. If the implementation of the policy is not strict, then the effect of the cost channel or technology innovation channel will be weakened, which may result in an insignificant impact of LCCPP or one that is different from the average effect. For example, low-carbon pilot cities located in the eastern and western part enjoy different levels of economic development. The eastern pilot cities are more likely to pursue the quality of economic development, and thus implement the policy more intensely. In contrast, those in the western part still face the challenges of economic development and poverty alleviation and therefore, the implementation of the policy is somehow weaker. This leads to different impacts of LCCPP on TFP of firms located in the eastern and western pilot cities.
In addition, difference in firm size and age also has heterogeneous impacts of the policy. Larger and older firms are more likely to accumulate more fixed assets, and form a path dependence of production and operation. Therefore, they require more time and higher costs for technological transformation. The compensation effect of innovation brought about by R&D is hard to manifest or relatively small in the short run, so TFP of larger and older firms is more likely to be affected by LCCPP. Beyond that, they also attract more attention from the government and society during the implementation of low-carbon policy, which further affects their TFP.
From a dynamic perspective, when firms are regulated by LCCPP, they need an adaptation period for adjustment, and thus its impact on TFP may be insignificant first. Subsequently, these firms update their equipment and conduct low-carbon technology R&D due to emission reduction tasks. The cost of equipment update in this stage leads to a negative impact on TFP. The innovation effect of R&D occurs gradually before having a positive impact on TFP (weak Porter hypothesis) and consequently, the inhibitory effect of cost on TFP is partially offset. When the innovation compensation effect exceeds the cost effect, then TFP begins to rise, consistent with the strong Porter hypothesis.
Finally, a few explanations are needed for the green component of TFP. This paper measures TFP in a traditional sense: the residual after deducting the contribution of capital, labor, and intermediate inputs. Therefore, the relationship between innovation in TFP and environmental innovation is complicated. On the one hand, firms update equipment to reduce emissions (that is, increase capital investment), which will affect environmental (low-carbon) innovation, but we have excluded the contribution of capital investment in the calculation of TFP. On the other hand, firms increase R&D investment to conduct technological innovation that will generate positive economic externalities and increase their productivity levels, including environmental innovation. Therefore, this paper does not consider the impact of LCCPP on firm GTFP. First, due to the availability of firm-level data, we are unable to obtain the information on the types of investment towards equipment update and the specific destination of R&D investment. Second, the environmental effects of LCCPP and its impacts on urban green growth have already been widely demonstrated (see Cheng, Yi, Dai, & Xiong, Citation2019; Su, Liang, Chen, Chen, & Yang, Citation2012; Yung & Chan, Citation2012). In particular, different from the work of Cheng, Yi, Dai, and Xiong (Citation2019), which focuses on GTFP of cities, we aim to identify the microeconomic effects of LCCPP as an environmental policy from the perspective of high-quality development.
3. Data and methodology
3.1. Data and summary statistics
Total factor productivity refers to the contribution of technological progress, rather than other inputs (such as capital and labor), to economic growth. This is an indicator to measure technological progress. Following Fang, Lerner, Wu, and Zhang (Citation2018), Giannetti, Liao, and Yu (Citation2015), and Schoar (Citation2002), we calculate TFP as the residual εit from the following regression which is run industry-by-industry and based on firm-level data (using the Chinese Securities Regulatory Commission’s two-digit industry classification codes):
where yit, kit, lit, and mit refer to the natural logarithm of (one plus) firm i’s output, capital stock, labor, and materials in industry j in year t, respectively. We use revenue, total assets (size), the number of employees (employment), and cash paid for goods and services (CPGS) of firms to measure output, capital stock, labor, and materials, respectively.Footnote3
Data on firm-level basic information used in the analysis are obtained from the China Stock Market Accounting Research (CSMAR) database. This paper covers the period over 2007–2016, given the implementation of new accounting standards in China in 2007. To obtain promising results, this paper excludes the observations in the financial industry and those under special markers (i.e., ST, *ST, suspension of listing, and delisting) from the sample.
In the following regression analysis, we use a number of firm-level control variables to capture their basic characteristics, such as size (measured by the natural logarithm of total asset), age (measured by the natural logarithm of the number of years between the established and observed year), the level of management (the ratio of management cost to total revenue), and the capital-to-labor ratio (the ratio of net fixed asset to the number of employees). Moreover, we also include firms’ financial information as further controls (see Cao, Lemmon, Pan, Qian, & Tian, Citation2019; Giannetti, Liao, & Yu, Citation2015; Jiang, Wan, & Zhao, Citation2013), such as the level of ROA, financial leverage, financial constraint (one minus the ratio of cash flow from operation to capital expenditure), and the liquid asset ratio (as a share of total asset). reports summary statistics of all the variables.
Table 1. Summary statistics
3.2. Econometric specification
We treat the LCCPP as a quasi-natural experiment to investigate how this policy affects firm TFP utilizing the difference-in-differences (DID) model. This is an important method to identify the causal effect, through removing the influence of the pre-existing difference between the treatment group and control group, to obtain the average treatment effect of the low-carbon policy on firm TFP in the treatment cities.
The selection method of these three batches of pilot cities are consistent. The second batch of pilots is based on the first batch to further expand the number of representative cities. Although those cities that have not been awarded as the first batch of pilots may be affected by the result (plausibly more cities will apply for this title), whether they can obtain depends on the central government’s comprehensive consideration of regional representativeness. This can to some extent reduce the self-selection bias.
To estimate an accurate treatment effect, this paper sets the first two batches, comprising 115 cities, as the treatment group and the others are set as the control group, given that the third one was implemented in 2017 and lacks statistical data. Specifically, the first batch was implemented in 2010, covering 82 cities (5 provinces and 8 cities), and the second batch was awarded in 2013, including 33 cities (1 province and 28 cities), as detailed in . Therefore, this paper selects the period over 2010–2016 as the first batch of policy implementation years, and the period from 2013 to 2016 is chosen as the second.
The baseline model that investigates the impact of LCCPP on TFP is defined as:
where i represents each firm, t represents each time period, and εit is the error term. The dependent variable TFPit is a measure of total factor productivity at firm i in year t. The variable of interest is LCCPPit, a dummy variable that equals one if firm i is located in a low-carbon pilot city in year t, and zero otherwise. The coefficient, β, thus indicates the impact of two batches of low-carbon city pilot policy on TFP. A positive and significant β suggests that the policy exerts a positive effect on firms’ productivity, whilst a negative and significant β indicates that the policy pushes the level of productivity lower. Control variables analyzed above (such as firm-level basic and financial information) are included in the vector Xit. Moreover, we also include firm fixed effects, ηi, and time fixed effects, γt. Standard errors are clustered at the firm-level due to the potential correlation of error term, ε, within a firm.
4. Empirical results
4.1. Main results
The incentives and constraints of LCCPP directly reduce the carbon emissions of firms, but the change of their productivity in the process of emissions reduction remains to be explored. In other words, we aim to test the Porter hypothesis in China.
4.1.1. The average treatment effect
This section is to test whether and how TFP across different firms systematically changes with LCCPP. Column (1) of is a simple specification with just a measure of the policy, LCCPP, in the presence of fixed firm and year effects, using annual data regression, with robust standard errors clustered by firm. This shows the raw correlation, and we see a negative and significant relationship. Column (2) further adds full control variables analyzed above on the right-hand side on the basis of column (1). The results using full controls support those already found. Column (3) extends column (2) to include an interaction term of industry and year dummies to control for nationwide shocks such as industrial policy that shapes productivity across industries. In this specification, the sign of the coefficient estimate relating to LCCPP is negative, and statistically significant at the 5% level. This shows that the implementation of LCCPP significantly reduces firm TFP, which challenges the strong Porter hypothesis.
Table 2. Basic estimation results
In , the results relating to the control variables are of some interest. First, it is difficult for firms with more assets to carry out technological transformation and upgrading, leading to a fall in TFP. Second, an increase in the management cost input indicates a lower level of management, which is harmful for TFP. Third, increased ROA shows more funds for compliance equipment and technological transformation, and hence promotes the level of productivity. Fourth, greater capital-to-labor ratio gives a hint of higher productivity since firms with relatively higher ratio pay more attention to the update of equipment and investment in research and development. Fifth, the level of financial leverage and financial constraint is positively associated with TFP because firms with higher productivity demand more from financing, ultimately resulting in greater financing difficulty and higher cost.
4.1.2. Dynamic effects
The baseline estimation presents a static average treatment effect. However, whether the policy has a significant impact on firm TFP in each period calls for an exploration regarding its dynamic effects (see ).
Figure 3. Dynamic effects of LCCPP on firm total factor productivity
As can be seen, the results of dynamic effects are consistent with the theory proposed in this paper. When firms in the first batch of low-carbon cities were regulated by LCCPP, they experienced an adaptation period to adjust, and thus changes in their TFP were insignificant in 2010. Later, those firms updated their equipment and conducted low-carbon technology R&D owing to their emission reduction tasks. The cost effect of equipment updates appeared first, so firm TFP in 2011 significantly declined after implementation of the first batch in 2010. Subsequently, TFP fell from 2014 to 2015, given the impact of the second batch implemented in 2012. The impacts in both 2012 and 2013 were insignificant, as it took some time for the second round of policy revisions to materialize. Moreover, as the innovation effect of R&D gradually occurred, it had a positive impact on TFP (weak Porter hypothesis), and the inhibitory effect of cost was partially counterbalanced. As a result, the negative effect in 2016 compressed. However, since the innovation compensation effect had not exceeded the cost effect, TFP did not show a rise trend, in contrast with the strong Porter hypothesis.
4.2. Robustness tests
4.2.1. Common trend test
One key assumption of the DID approach is that if the treatment group is not subject to the policy intervention, then the development trends of TFP for both treatment and control group are consistent and with no systematic differences occurring over time. To test the hypothesis, this paper retains the sample before the implementation of LCCPP, and obtains the estimated coefficient relating to LCCPP in 2008, 2009, and 2010, using 2007 as the baseline year. Column (1) of suggests that the treatment and control group do not have differences in year-to-year changes before the implementation of the low-carbon pilot policy. This satisfies the common trend assumption.
Table 3. Robustness checks
4.2.2. Placebo test
The placebo test is to test the randomness of LCCPP by artificially changing the time point and span of policy implementation to conduct a counterfactual test. In fact, the implementation of other policies and some random factors may cause differences in firm TFP, and these differences are not caused by the implementation of LCCPP. This will make previous results invalid. Therefore, we assume that the policy of LCCPP was implemented in 2008 in advance and restrict the sample covering 2008–2010. If the estimated coefficient of LCCPPD08 becomes insignificant, then except the impact of LCCPP, there is indeed no systematic differences in TFP of the treatment and control group. This in turn proves the robustness of the common trend test and the randomness of the promulgation of LCCPP. If the coefficient is instead significant, then other random factors except LCCPP do affect the level of TFP. This shows an invalid conclusion in the previous common trend test. Column (2) of supports the estimated results in .
4.2.3. Entry or exit of firms in the stock market
This paper covers the period over 2007 to 2016, but a large number of firms entered or exited the stock market during this period. This then results in a difference in sample size over the observed years. In order to eliminate this impact, we exclude firms that entered or exited the stock market between 2007 and 2016, and only keep those with an age of 10 years and above to obtain a balanced panel regression. The results are contained in column (3) of . The estimated coefficient relating to the policy remains negative, and statistically significant at the level of 5%, which manifests that the implementation of LCCPP significantly lowers the level of TFP.
Compared with the average effect of all firms (the estimated coefficient of LCCPP is −0.022), only considering those aged 10 and above (−0.031) implies that TFP is more affected by LCCPP. Older firms have more fixed assets accumulation, and they are more likely to form a path dependence on the production and operation. When implementing a LCCPP, they will face greater transformation pressure, higher adjustment cost, and longer adjustment time period. This might be worse in dealing with environmental regulation. Therefore, the LCCPP has a greater impact on TFP of firms that have been established for a longer period.
4.2.4. Randomized placebo test
Another concern is that other unobservable characteristics of firms change over time or other policies, such as the Energy Saving Quota Policy, during the same period, may also function. Thus, we construct a randomized placebo test (Chetty, Looney, & Kroft, Citation2009; La Ferrara, Chong, & Duryea, Citation2012). Precisely, this paper randomly generates a list of low-carbon cities, and therefore obtains a falsification estimation. We then repeat this process 500 times, thereby generating 500 estimates accordingly. depicts the distribution of the estimated coefficients obtained from the 500 placebo tests. It is clear that the vertical solid line, showing the actual treatment effect, is out of the distribution of the counterfactual effect. The results are consistent with the expectation of a placebo test, in support of our argument.
Figure 4. Randomized placebo test
4.3. Mechanism analysis
The empirical analysis shown above establishes a robust negative statistical association between the low-carbon policy and firm productivity, in contrast with the strong Porter hypothesis. We verify this relationship through the research and development investment channel and total operating cost channel. The results are contained in .
Table 4. Mechanism
In terms of research and development investment by firms, the estimated coefficient related to the policy variable, LCCPP, in column (1) of is positive and statistically significant at the 1% level. This indicates that environmental regulation brings about an increase in research and development input by firms, and promotes technological innovation. Further, the number of patents can to some extent measure the innovation ability of firms. The coefficient of the policy variable in column (2) remains positive, demonstrating that the LCCPP enhances the number of patents by increasing firm investment in research and development. To verify whether the funds of research and development caused by LCCPP lead to an increase in TFP, we regress TFP on research and development expenditures. Column (3) shows a positive relationship between TFP and research and development expenditures. This suggests that the research and development capability is a partial mediation. The LCCPP urges firms to pay more attention to the improvement in research and development capability that leads to a rise in TFP, consistent with the weak Porter hypothesis.
From the perspective of the cost in business channel, the policy variable in column (4) of is found to be positively associated with the compliance cost. This indicates that the LCCPP increases the cost in business which is harmful for TFP. In addition, in column (5) we find a positive association between the environmental policy and the level of subsidy, thereby suppressing the negative impact of rising compliance cost on firm productivity. However, this depends on whether firms use the subsidy to increase their productivity.
In short, the policy increases firm TFP through the research and development channel, but meantime curbs their productivity through the compliance cost channel. As we can see, the offset effect of innovation generated by the research and development channel is still less than that of regulation compliance cost. Consequently, this ultimately results in a decline in firm TFP, which challenges the strong Porter hypothesis.
4.4. Heterogeneity
investigates the heterogeneity and employs the same specification as column (3) of . Therefore, we present a further analysis of heterogeneous effects of LCCPP in terms of firm size and geographical location.
Table 5. Heterogeneity
4.4.1. Size heterogeneity
There are differences in fixed assets, financial status, technological upgrading capability, R&D and innovation capability, and management level among firms of different size. Therefore, we split the sample into small and large firms (according to the median value of total assets) to examine whether the results change with their size.
According to column (1) of , the policy, LCCPP, significantly reduces the level of TFP in the subsample with larger firms. The negative impact also survives in the small-firm subsample while the significance level declines. Energy-saving and emission reduction regulation lead to a shortage of corporate funds. For those relatively smaller firms, limited government financial resources hardly fully alleviate the shortage of innovation funds, and as a consequence, the effect of innovation channel has to take a longer time to manifest. In addition, smaller firms are also under greater pressure to survive, and seldomly obey the low-carbon policy implemented. Therefore, the impact of LCCPP on smaller firm TFP is relatively weak.
In contrast, although larger firms can obtain more financial funds, they also need a higher level of management to implement related regulations. In the short run, larger firms require more time and higher cost to conduct technological transformation as they have accumulated more fixed assets. Coupled with insufficient funds for R&D and innovation, the innovation compensation effect takes a longer time to appear, resulting in a smaller offset for the cost channel effect. Ultimately, TFP of larger firms is reduced by LCCPP. Moreover, larger firms attract more attention from the government and society during the implementation of low-carbon policy. Therefore, the impact of LCCPP on larger firms is more stringent, which leads to an increase in their compliance cost, and a sizable effect on TFP compared with the average treatment effect.
4.4.2. Location heterogeneity
Cities located in different regions are endowed with different energy structure, industrial structure, carbon emissions and economic development. As a result, both the standard and the intensity of the implementation of low-carbon policy vary. We incorporate the spatial location factor, and split the sample into the eastern region, and the central and western region.
In the eastern region, the LCCPP significantly inhibits firm TFP as shown in column (3) of . On the one hand, the eastern region has a higher level of economic development attached to greater importance of the quality of development. This region also has a higher level of urban management and a stronger sense of low-carbon society, which leads to a strict and orderly policy implementation and a stronger influence on TFP compared with the average treatment effect. On the other hand, although the implementation of low-carbon policy in the eastern region is more stringent than the rest region, the intensity of the policy is still far from the level of the strong Porter hypothesis. From the technical approach, the low-carbon policy increases firms’ research and development investment occurring in eastern cities, but the conversion from technological innovation into productivity requires a long period. Thus, in the short term, the effect of innovation can hardly compensate the inhibitory effect due to increased compliance cost, resulting in a fall in firm TFP.
However, the LCCPP in the central and western region shows an insignificant inhibitory effect on firm TFP as reported in column (4) of . First, economic growth is a priority in the local government, as their level of economic development is lower than that in the eastern region. Second, the management level and public awareness of low-carbon in the central and western region are also lower. As a result, the central and western region has greater difficulties in implementing policy, and the effect of policy implementation is weaker. Further, the external environment for technological innovation in this region is also unsatisfactory. In particular, under the guidance of the state policy on the inter-regional industrial gradient transition, the central and western region tends to become the destination for the high energy-consuming and polluting firms transferred from the eastern region. The grim reality of resource depletion and ecological fragility seriously hinders the improvement of their technological innovation. In this situation, firms can hardly obtain more funds for technological innovation to meet the low-carbon requirement.
5. Conclusion
This paper investigates the effect of low-carbon city pilot policy on firm productivity in China, in order to test the Porter hypothesis. Focusing on the low-carbon policy allows us to use a difference-in-differences approach to identify the causal impact of environmental regulation on productivity.
We have three main findings. First, the decline in productivity is significantly larger in cities exposed to the low-carbon policy than in cities not subject to this policy. The negative relationship holds across various econometric specifications employed. Second, we find evidence that improvements in environmental regulation standards significantly promote the incentives of firms to innovate, while the regulation meantime significantly increases the compliance cost of firms. This is consistent with the weak Porter hypothesis but fails to fulfill the strong Porter hypothesis, since the innovative effect generated by the research and development channel is smaller than the cost of compliance in the short run. Third, the negative relationship between the LCCPP and TFP is stronger for both larger firms and those located in the eastern region.
Our results contribute to the literature in the policy implication. The insights obtained in this paper are also valuable for developing countries aiming at win-win situations between low-carbon transition and high-quality growth.
Acknowledgments
We are grateful for the helpful comments and suggestions provided to us by Mariana Conte Grand (editor) and the anonymous referee.
Disclosure statement
No potential conflict of interest was reported by the authors.
Additional information
Notes on contributors
Weiping Shen
Weiping Shen is a Ph.D. student in sustainable development economics in the Department of Urban Development and Environmental Studies, University of Chinese Academy of Social Sciences. Her current research interests are in resource and environmental economics, energy and climate policy, and global environmental governance.
Yong Wang
Yong Wang is an assistant research fellow in the Institute of Finance & Banking, Chinese Academy of Social Sciences. He received his Ph.D. degree at the Graduate School of Chinese Academy of Social Sciences in 2015. His current research interests are in fintech, macro-finance, innovation, and public policy evaluation.
Weijie Luo
Dr. Weijie Luo is an assistant professor in economics at the Central University of Finance and Economics (CUFE). Prior to joining CUFE, Dr. Luo was a visiting researcher in economics at the University of Cambridge, and worked as an associate lecturer in economics at the University of York, where he completed his PhD in economics. His research interests are in macroeconomics, public economics, and economic policy. His research work has been published (or accepted for publication) in journals such as Economics Letters, Journal of Chinese Political Science, Applied Economics Letters, etc. He is currently serving as an anonymous referee in journals such as Journal of Applied Economics, Public Finance Review, etc.
Notes
1 However, due to the impact of COVID-19, the evolution of emissions has undergone some changes. According to Le Quéré, Jackson, Jones, Smith, Abernethy, Andrew, De-Gol, Willis, Shan, Canadell, Friedlingstein, Creutzig, & Peters, (Citation2020), daily global CO2 emissions decreased by 17% by early April 2020 compared with the average level in 2019, and the emissions in individual countries decreased by 26% on average at their peak. In short, the impact of COVID-19 on global carbon emissions trends depends on its duration. Both government actions and post-crisis economic incentives are also likely to influence the global CO2 emissions path for decades.
2 High-quality development is complicated and inclusive. The 19th National Congress of the Communist Party of China and the Central Economic Work Conference proposed that China’s economic development has entered a new era. The basic feature of China’s economic development in the new era is to shift from a stage of rapid growth to a stage of high-quality development. High-quality development is an economic development pattern, structure, and dynamic state that can meet the growing real needs of people via various more effective and more sustainable ways. At the micro level, high-quality development refers to the improvement of production factors, productivity, and total factor productivity, rather than the continuous expansion of factor inputs. From a meso and macro perspective, high-quality development refers to the upgrade of national economic structure, including energy, industrial, market, and regional structures, in order to allocate the resources more effectively, thereby promoting a more balanced, green, low-carbon and sustainable economy.
3 The measurement of TFP in this paper is different from others working on the case of China (i.e., Bosworth & Collins, Citation2008; Chow & Li, Citation2002) in two ways. First, our TFP refers to the research by Schoar (Citation2002), Giannetti, Liao, and Yu (Citation2015), and Fang, Lerner, Wu, and Zhang (Citation2018), which is based on the total output and three elements (capital, labor, and intermediate input). They (Bosworth & Collins, Citation2008; Chow & Li, Citation2002) use the method on account of the added value to measure the TFP without considering the intermediate input. Second, we use the data on Chinese listed companies, commonly regarded as relatively higher quality, and their TFP levels are higher than the average level in the country. However, Bosworth and Collins (Citation2008) and Chow and Li (Citation2002) use the macro data, calculating the average level of TFP among companies in the country. In this sense, the average TFP level calculated in this paper may be higher than their estimation.
References
- Albrizio, S., Kozluk, T., & Zipperer, V. (2017). Environmental policies and productivity growth: Evidence across industries and firms. Journal of Environmental Economics and Management, 81, 209–226.
- Anger, N., & Oberndorfer, U. (2008). Firm performance and employment in the EU emissions trading scheme: An empirical assessment for Germany. Energy Policy, 36(1), 12–22.
- Baumol, W. J., & Oates, W. E. (1988). The Theory of Environmental Policy. Cambridge University Press.
- Berman, E., & Bui, L. T. M. (2001). Environmental regulation and productivity: Evidence from oil refineries. Review of Economics and Statistics, 83(3), 498–510.
- Bosworth, B., & Collins, S. M. (2008). Accounting for growth: Comparing China and India. Journal of Economic Perspectives, 22(1), 45–66.
- Cao, X., Lemmon, M., Pan, X., Qian, M., & Tian, G. (2019). Political promotion, CEO incentives, and the relationship between pay and performance. Management Science, 65(7), 2947–2965.
- Cheng, J., Yi, J., Dai, S., & Xiong, Y. (2019). Can low-carbon city construction facilitate green growth? Evidence from China’s pilot low-carbon city initiative. Journal of Cleaner Production, 231, 1158–1170.
- Chetty, R., Looney, A., & Kroft, K. (2009). Salience and taxation: Theory and evidence. The American Economic Review, 99(4), 1145–1177.
- Chow, G. C., & Li, K.-W. (2002). China’s economic growth: 1952-2010. Economic Development and Cultural Change, 51(1), 247–256.
- Christainsen, G. B., & Haveman, R. H. (1981). The contribution of environmental regulations to the slowdown in productivity growth. Journal of Environmental Economics and Management, 8(4), 381–390.
- Cole, M. A., Elliott, R. J. R., & Okubo, T. (2010). Trade, environmental regulations and industrial mobility: An industry-level study of Japan. Ecological Economics, 69(10), 1995–2002.
- Cole, M. A., Elliott, R. J. R., & Shimamoto, K. (2005). Industrial characteristics, environmental regulations and air pollution: An analysis of the UK manufacturing sector. Journal of Environmental Economics and Management, 50(1), 121–143.
- Costantini, V., & Mazzanti, M. (2012). On the green and innovative side of trade competitiveness? The impact of environmental policies and innovation on EU exports. Research Policy, 41(1), 132–153.
- Fang, L. H., Lerner, J., Wu, C., & Zhang, Q. (2018). Corruption, government subsidies, and innovation: Evidence from China (No. w25098). National Bureau of Economic Research.
- Gehrsitz, M. (2017). The effect of low emission zones on air pollution and infant health. Journal of Environmental Economics and Management, 83, 121–144.
- Giannetti, M., Liao, G., & Yu, X. (2015). The brain gain of corporate boards: Evidence from China. The Journal of Finance, 70(4), 1629–1682.
- Gray, W. B., & Shadbegian, R. J. (1993). Environmental regulation and manufacturing productivity at the plant level (No. w4321). National Bureau of Economic Research.
- Greenstone, M. (2002). The impacts of environmental regulations on industrial activity: Evidence from the 1970 and 1977 Clean Air Act Amendments and the census of manufactures. Journal of Political Economy, 110(6), 1175–1219.
- Greenstone, M., List, J. A., & Syverson, C. (2012). The effects of environmental regulation on the competitiveness of U.S. manufacturing (No. w18392), National Bureau of Economic Research.
- Hamamoto, M. (2006). Environmental regulation and the productivity of Japanese manufacturing industries. Resource and Energy Economics, 28(4), 299–312.
- Jaffe, A. B., & Palmer, K. (1997). Environmental regulation and innovation: A panel data study. Review of Economics and Statistics, 79(4), 610–619.
- Jaffe, A. B., Peterson, S. R., Portney, P. R., & Stavins, R. N. (1995). Environmental regulation and the competitiveness of U.S. manufacturing: What does the evidence tell us?. Journal of Economic Literature, 33(1), 132–163.
- Jefferson, G. H., Tanaka, S., & Yin, W. (2013). Environmental regulation and industrial performance: Evidence from unexpected externalities in China. Available at SSRN 2216220. Retrieved from https://ssrn.com/abstract=2216220
- Jiang, W. (2015). Could a less developed city solve its CO2 emission dilemma? Evidence from a low carbon pilot city. Chinese Journal of Urban and Environmental Studies, 3(1), 1550007.
- Jiang, W., Wan, H., & Zhao, S. (2013). The two-sided career concerns of independent directors: Evidence from director voting. Working paper. Columbia University.
- Jin, Y., & Lin, L. (2014). China’s provincial industrial pollution: The role of technical efficiency, pollution levy and pollution quantity control. Environment and Development Economics, 19(1), 111–132.
- La Ferrara, E., Chong, A., & Duryea, S. (2012). Soap operas and fertility: Evidence from Brazil. American Economic Journal: Applied Economics, 4(4), 1–31.
- Lanoie, P., Laurent-Lucchetti, J., Johnstone, N., & Ambec, S. (2011). Environmental policy, innovation and performance: New insights on the Porter hypothesis. Journal of Economics & Management Strategy, 20(3), 803–842.
- Le Quéré, C., Jackson, R. B., Jones, M. W., Smith, A. J. P., Abernethy, S., Andrew, R. M., De-Gol, A. J., Willis, D. R., Shan, Y., Canadell, J. G., Friedlingstein, P., Creutzig F., & Peters, G. P. (2020). Temporary reduction in daily global CO2 emissions during the COVID-19 forced confinement. Nature Climate Change, 10, 647–653.
- Liu, W., & Qin, B. (2016). Low-carbon city initiatives in China: A review from the policy paradigm perspective. Cities, 51, 131–138.
- Naso, P., Huang, Y., & Swanson, T. (2020). The impact of environmental regulation on Chinese spatial development. Economics of Transition and Institutional Change, 28(1), 161–194.
- Olivier, J. G. J., & Peters, J. A. H. W. (2019). Trends in global CO2 and total greenhouse gas emissions: 2019 report. The Hague: PBL Netherlands Environmental Assessment Agency. Retrieved from https://www.pbl.nl/en/publications/trends-in-global-co2-and-total-greenhouse-gas-emissions-2019-report
- Ollivier, H. (2016). North-South trade and heterogeneous damages from local and global pollution. Environmental and Resource Economics, 65(2), 337–355.
- Palmer, K., Oates, W. E., & Portney, P. R. (1995). Tightening environmental standards: The benefit-cost or the no-cost paradigm?. Journal of Economic Perspectives, 9(4), 119–132.
- Peuckert, J. (2014). What shapes the impact of environmental regulation on competitiveness? Evidence from executive opinion surveys. Environmental Innovation and Societal Transitions, 10, 77–94.
- Porter, M. E., & Van der Linde, C. (1995). Toward a new conception of the environment-competitiveness relationship. Journal of Economic Perspectives, 9(4), 97–118.
- Rassier, D. G., & Earnhart, D. (2010). The effect of clean water regulation on profitability: Testing the Porter hypothesis. Land Economics, 86(2), 329–344.
- Rubashkina, Y., Galeotti, M., & Verdolini, E. (2015). Environmental regulation and competitiveness: Empirical evidence on the Porter hypothesis from European manufacturing sectors. Energy Policy, 83, 288–300.
- Schoar, A. (2002). Effects of corporate diversification on productivity. The Journal of Finance, 57(6), 2379–2403.
- Shen, L., Wu, Y., Shuai, C., Lu, W., Chau, K. W., & Chen, X. (2018). Analysis on the evolution of low carbon city from process characteristic perspective. Journal of Cleaner Production, 187, 348–360.
- Su, M., Liang, C., Chen, B., Chen, S., & Yang, Z. (2012). Low-carbon development patterns: Observations of typical Chinese cities. Energies, 5(2), 291–304.
- Telle, K., & Larsson, J. (2007). Do environmental regulations hamper productivity growth? How accounting for improvements of plants’ environmental performance can change the conclusion. Ecological Economics, 61(2–3), 438–445.
- United Nations Environment Programme. (2019). Emissions Gap Report 2019. Retrieved from https://www.unenvironment.org/resources/emissions-gap-report-2019
- Wang, J., & Liu, B. (2014). Environmental regulation and enterprises’ TFP——An empirical analysis based on China’s industrial enterprises data. China Industrial Economics, 3, 44–56. (In Chinese).
- Wang, Y., Song, Q., He, J., & Qi, Y. (2015). Developing low-carbon cities through pilots. Climate Policy, 15(sup1), S81–S103.
- Yang, C. H., Tseng, Y. H., & Chen, C. P. (2012). Environmental regulations, induced R&D, and productivity: Evidence from Taiwan’s manufacturing industries. Resource and Energy Economics, 34(4), 514–532.
- Yang, D., Liu, B., Ma, W., Guo, Q., Li, F., & Yang, D. (2017). Sectoral energy-carbon nexus and low-carbon policy alternatives: A case study of Ningbo, China. Journal of Cleaner Production, 156, 480–490.
- Yung, E. H., & Chan, E. H. (2012). Implementation challenges to the adaptive reuse of heritage buildings: Towards the goals of sustainable, low carbon cities. Habitat International, 36(3), 352–361.
- Zhao, X., & Sun, B. (2016). The influence of Chinese environmental regulation on corporation innovation and competitiveness. Journal of Cleaner Production, 112, 1528–1536.