
 ?Mathematical formulae have been encoded as MathML and are displayed in this HTML version using MathJax in order to improve their display. Uncheck the box to turn MathJax off. This feature requires Javascript. Click on a formula to zoom.
ABSTRACT
While Carbon Dioxide based Enhanced Oil Recovery (CO2 -EOR) is often regarded as one of the most economically viable methods of carbon capture, utilization and storage (CCUS), little is known about the existing CO2 supply contracts in the CO2 -EOR industry. By studying a sample of 103 CO2 sales contracts in the U.S. in the 1980s and 1990s, this paper aims to find out what drives the key terms in these contracts. In particular, a special price adjustment clause is included to peg the CO2 price to the oil price. Our analyses suggest that the probability that the pegging term is used is positively associated with the contract length. Besides, initial oil prices, volatile historical oil prices, and the net CO2 utilization also positively impacts the adoption of the price-pegging adjustment mechanism.
1. Introduction
Engineering and economics studies of carbon sequestration through Carbon Dioxide based Enhanced Oil Recovery (CO2 -EOR) have primarily focused on the co-optimization of oil production and CO2 sequestration by choosing the optimal CO2 fraction of the injection stream and other management decisions.Footnote1 These studies are important in determining the optimal micro-level operational and management decisions, given exogenous market conditions such as the prices of oil and CO2 . This article investigates the vertical relation between the CO2 seller and the buyer by examining a sample of 103 CO2 sales contracts. We focus on the contract structure and price adjustments, and provide empirical evidence on the determination of CO2 prices.
In our sample of 103 contracts, more than half have duration terms longer than five years, and about three quarters have price adjustment clauses included. Unlike price adjustment clauses found in numerous other industries and markets (Arnold, Harmon, Rose, & Whitley, Citation2013; Goldberg & Erickson, Citation1987; Joskow, Citation1988; Skolnik, Citation2011), where the contract price is adjusted based on changes in the supplier’s input costs, the contracted CO2 price is pegged to the price of the buyer’s output, oil. Specifically, a sample contract clause that specifies the delivered CO2 price states “Delivered Price: The price to be paid by Buyer for all volumes purchased shall be calculated monthly, and shall be a percentage of the average of West Texas Intermediate Crude (the average of the first posting of the Month as posted by ExxonMobil, Chevron, and Conoco Phillips) for such Month.” Note that the sample contract leaves the percentage unspecified.
This article provides an empirical analysis of the contract structure and price adjustments of the CO2 sales contracts. Our analyses show that longer contract duration increases the probability of price-pegging being used. The pegging coefficients also show that higher initial oil prices, more volatile historical oil prices, and smaller net CO2 utilization are associated with high pegging coefficients. In addition, contracts signed at the early stages of CO2 -EOR projects tend to have lower pegging coefficients.
This article contributes to the literature in several ways. First, it relates to studies on the economics of CO2 -EOR and its potential in CCUS through careful examinations of actual CO2 purchasing contracts. Studies based on extensive interviews with companies, government agencies, and NGOs show that CO2 -EOR is a technologically and commercially viable approach for CCUS (Bloomberg, Citation2012; Taylor, Citation2012). However, one important factor that has long been overlooked is the vertical relation within the CO2 -EOR industry, which has important implications since it largely determines how the profits from enhanced production are distributed. Leach, Mason, and van ’t Veld (Citation2011) and Wang, Van ’t Veld, Marcy, Huzurbazar, and Alvarado (Citation2018) show that CO2 sequestration does not respond much to the sequestration subsidy, which provides us a valuable lesson on how to use policies to promote CO2 utilization effectively. We find that the CO2 -EOR industry is highly concentrated on the supply side. The market power of the dominant player likely comes from its control of large natural CO2 deposits and pipeline networks. Therefore, promoting CO2 -EOR by expanding CO2 supply or building required infrastructure as suggested by Wang et al. (Citation2018) could be a viable option.
Second, this paper contributes to the literature that examines price adjustment in long-term contracts. Researchers have discovered that the CO2 -EOR industry often includes a unique price adjustment clause in their CO2 purchasing contracts that pegs the CO2 price to the oil price (Cook, Citation2013; Martin & Taber, Citation1992). Theoretical studies by Agarwal (Citation2014), Van ’t Veld and Phillips (Citation2009), and Gao and van ’t Veld (Citation2021) show that a “price-pegging”CO2 contract outperforms a fixed price CO2 contract in terms of reducing the contracting risks, decreasing the sensitivity of supply and demand to small oil-price changes, and increasing efficiency. Our empirical analyses of actual CO2 contracts shed light on how the “price-pegging” clause responds to changes in market conditions and provides valuable information about how “reasonably clever businessmen and lawyers cope with problems scholars might consider intractable” (Goldberg & Erickson, Citation1987).
Third, this paper is closely related to studies examining the cost of CO2 purchase. Two significant costs hold back the advancement of CO2 -EOR, the high purchasing cost of CO2 and the large up-front investment costs associated with CO2 -EOR projects.Footnote2 These two costs have important economic implications. The large up-front investment gives the CO2 seller some ex-post bargaining power,Footnote3 resulting in the classic “hold-up” problem (Klein, Crawford, & Alchian, Citation1978; Williamson, Citation1979, Citation1985), where inefficiently low investment or “opportunistic behavoir” seeking to force renegotiation of the contract price may occur.Footnote4 One solution to the “hold-up” problem, is to adopt a long-term contract that specifies the terms and conditions for future transactions ex-ante (Joskow, Citation1987). Of all the terms and conditions, the pegging price adjustment clause studied in this paper, which allows for adjustment of the contract price when certain conditions are met, is plausible.
The rest of this paper is organized as follows. Sections 2 provides a summary of the contracts and analyzes the structure of the contracts, emphasizing the duration, quantity, and price. Section 3 examines how the pegging coefficients in the contracts are determined, and Section 4 concludes.
2. The structure of long-term CO2 contracts
CO2 -EOR has been widely regarded as one of the most economically viable approaches for carbon capture, utilization, and storage (CCUS). The technique of CO2 -EOR injects CO2 into the reservoir to make the oil swell and reduce its viscosity. The result is increased reservoir pressure and easier movement of the oil through the reservoir rock to the well. The CO2 injected gets either sequestered in the reservoir or recycled and re-injected. The injected CO2 can be permanently contained within the depleted reservoir with proper sealing and maintenance. Specifically, Faltinson & Gunter (Citation2011) have shown that for the majority of the CO2-EOR projects in North America, more than half of the injected CO2 is stored in the reservoir.
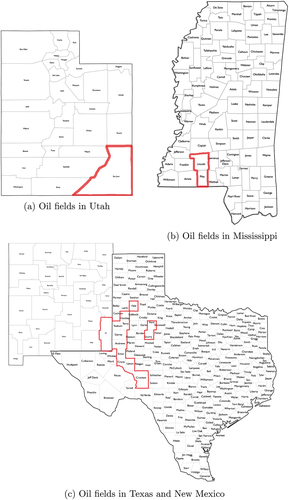
The technical CO2 storage capacity offered by CO2 -EOR in the U.S. is estimated to be 51 billion metric tons. Using the “next generation” CO2 -EOR technology, 100 billion barrels of oil are estimated to be economically recoverable,Footnote5 with associated demand for and potential storage of 30 billion metric tons of CO2 (Kuuskraa, Godec, & Dipietro, Citation2013). Within the foreseeable future, the U.S. government is likely to adopt some form of regulation of CO2 emissions, whether in the form of a carbon tax or a cap-and-trade program. The importance of the CO2 -EOR market, in terms of oil production and carbon sequestration, is likely to keep growing in the coming years. shows the locations of the CO2 -EOR projects in the U.S., along with the natural CO2 sources and the pipeline infrastructures that transport CO2 to the oil fields. We can see that most of the active CO2 -EOR projects are located in the Permian Basin area. The rest are scattered in Wyoming, Utah, Kansas, Oklahoma, Louisiana, and Mississippi. Most of the CO2 supplied to the Permian Basin is from three natural CO2 sources: McElmo Dome, Bravo Dome, and Sheep Mountain. Three pipelines connect the sources to the basin: Cortez Pipeline, Bravo Pipeline, and Sheep Mountain Pipeline. shows the locations of the oil fields from the CO2 sales contracts. Of the 103 CO2 sales contracts we are able to obtain, 95 are buying CO2 for EOR projects in the Permian Basin, 4 for projects in Utah, and 4 for projects in Mississippi. Therefore the sample contracts cover not only most of the CO2 -EOR fields in the Permian Basin but also some of the fields in other states.
Figure 1. Location of current CO2 EOR projects and pipeline infrastructure in the U.S.
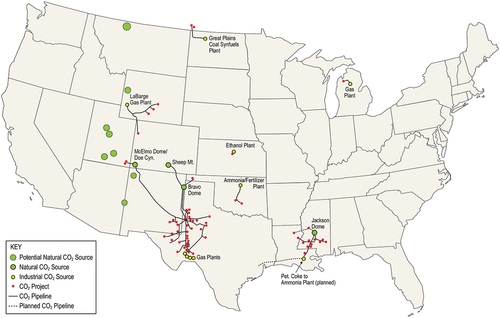
Figure 2. Oil fields in Utah.
The 103 CO2 sales contracts we investigate are provided by the Department of Economics at the University of Wyoming. The contracts remain proprietary to this day, so details about any specific contract cannot be revealed. Overall, there are six unique sellers and 34 unique buyers. The contract effective dates range from 1982 to 2001.Footnote6 shows a summary of the number of contracts and the total quantity supplied from each supplier. In terms of both contract number and total quantity supplied, Company C is, without a doubt the largest supplier in this dataset. The total amount of CO2 supplied in the 103 contracts is 4545.61 Bcf. Company C alone supplies 3402.74 Bcf of CO2, which is 75% of the total CO2 supplied in all contracts.
Table 1. Summary of number of contracts and total quantity from each supplier
It is also useful to look at the contracts that supply CO2 to the Permian Basin. Three pipelines connect three natural CO2 sources to the oil fields. This gives the oil fields in the Permian Basin a large advantage over fields in other areas, where there is only one pipeline transporting CO2 from a single source. shows a summary of the number of contracts and the total quantity supplied from each supplier in the Permian Basin. Company C is still the largest supplier with the largest number of contracts and the largest quantity supplied, indicating that the CO2 market in the Permian Basin is also highly concentrated.
Table 2. Summary of number of contracts and total quantity from suppliers in the Permian Basin
and indicate that Company C is the dominant player in our sample contracts. Even though our sample does not possibly include all CO2 sales contracts in the 1980s and 1990s, the dominant position of Company C in our sample generally reflects its actual market position in the Permian Basin and the overall CO2 -EOR market in the US.Footnote7
shows the summary of three important contract terms, contract duration, total contracted quantity, and the initial contracted CO2 price. All three terms vary a lot. For total contracted quantity, the smallest value is 0.02 Bcf, while the largest is 720 Bcf. shows the distribution of the total contracted quantity of all contracts. We can see that the majority of contracts have a total contracted quantity of less than 100 Bcf. For the initial CO2 price, the lowest price is only $0.2/Mcf, while the highest is $1.65/Mcf. shows the distribution of the initial CO2 price of all contracts. Most contracts have an initial CO2 price between $0.5 and $0.8 per Mcf. The shortest contract lasts only 16 days for contract duration, while the longest one lasts 24 years. shows the distribution of the contract duration of all contracts. shows a summary of contract types in terms of contract duration. Short-term contracts (one year or shorter) comprise only 24% of all contracts, while long-term contracts (longer than five years) comprise 55% of all contracts. This suggests that long-term contracts might be more prevalent than short-term contracts in the CO2 -EOR industry.
Figure 3. Oil fields in Mississippi.
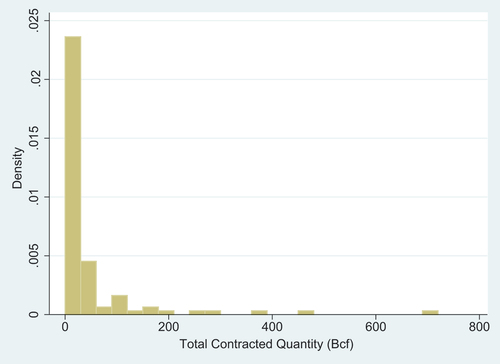
Figure 4. Oil fields in Texas and New Mexico.
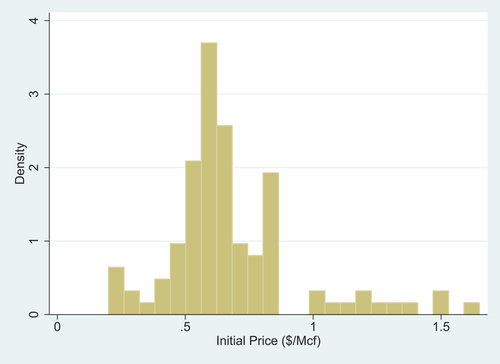
Figure 5. Location of the oil fields from the CO2 sales contracts.
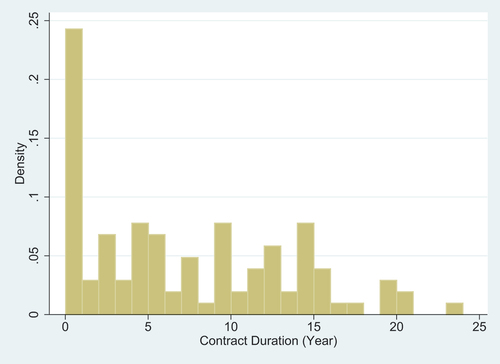
Table 3. Summary of contract duration, total contracted quantity and initial CO2 price
Table 4. Summary of different contract types in terms of duration
Other than the prevalence of long-term contracts, we also notice the frequent usage of price-pegging in the CO2 sales contracts. The contracted CO2 price consists of two elements: a commodity price and a transportation cost. The transportation cost can be bid on flat and escalated but is usually not pegged to a specific index. On the other hand, the commodity price is commonly pegged to an index and adjusted based on the changes of the index. Of the 103 contracts, 69 contracts use one or more indexes to auto-adjust the CO2 prices. That is about two-thirds of all the contracts. The indexes used include the West Texas Intermediate (WTI) price, the Producer Price Index (PPI)Footnote8 for industrial commodities and the natural gas price. shows a summary of the indexes used. Note that there are a few contracts that utilize both the WTI and PPI indexes. In this case, the two indexes are used separately when calculating the adjusted CO2 price, and the higher adjusted price is used. Knowing there are three different possible indexes, an interesting question is how an index is chosen. Unfortunately, we have no concrete answer to this question. It may just come down to the preferences of the parties involved.Footnote9 Lastly, there is a possible positive correlation between the contract duration and the probability of using price-pegging. As is shown in , as the contract duration increases, the proportion of indexed contracts within each category increases significantly. For the 57 long-term contracts, 52 contracts peg their CO2 price to some index types.
Figure 6. Different contracts by duration and indexing.
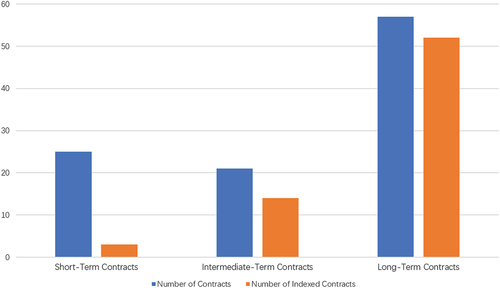
Table 5. Summary of indexes used in contracts
3. Analyses on the Price-pegging Mechanism
Theoretical studies have shown that it is optimal to use a pegged CO2 price instead of a fixed one, regardless of the contract duration (Agarwal, Citation2014; Gao & van ’t Veld, Citation2021). However, shows that while the price-pegging mechanism is widely used in intermediate and long-term contracts, it is rarely used in short-term contracts. One possible explanation is that although theoretically, the seller earns a higher expected profit by using a pegged price instead of a fixed one, in reality, this profit gain is rather small in a short period. The pegged CO2 price could be almost identical to the fixed price because the change in the oil price is very small. Additionally, writing a price-pegging contract can be more costly to the parties involved.Footnote10
To estimate what variables could affect the decision to include price-pegging in the contract, we run a Probit regression of the contract type (1 = price-pegging contract, 0 = fixed-price contract) against some key contract terms. The estimation results are given in . The “Affiliation” and “Area” variables are two dummy variables controlling for whether the buyer and seller are affiliated and whether the contracted oil field is located in the Permian Basin or not. Although not statistically significant, the result suggests that being affiliated increases the probability of price-pegging being used, while the contracted oil field in the Permian Basin reduces the probability. The contract duration has a statistically significant positive effect on the decision to use price-pegging. The other two variables, “Initial Oil Price” (the average oil price of the month before the contract effective date) and “Total Contracted Quantity”, both positively affect the probability of price-pegging being used. However, the coefficients of these two estimators are not statistically significant, so not too much should be read into it. The coefficient of the initial oil price may seem weakly statistically significant. Nevertheless, this significance goes away when we replace it with the average oil price of two months or three months prior to the contract effective date.
Table 6. Probit regression of the contract type ()
We further investigate the determinants of the price-pegging coefficient. Our analysis directly follows the theoretical work by Gao and van ’t Veld (Citation2021). For contracts that use crude oil prices as the index, the CO2 price is calculated as the product of the pegging coefficient and the oil price. The theoretical model implies that the pegging coefficient is affected by a number of variables, namely the discounted cumulative incremental oil production,Footnote11 the discounted cumulative added cost,Footnote12 net CO2 utilization,Footnote13 up-front investment, the initial oil price, and the oil price volatility. We confront the implications of the theoretical model with the data. Of all the contracts that peg the CO2 price to the oil price, 46 contracts have well-defined pegging coefficients. These 46 contracts have CO2 supplied to 19 different fields. Although we do not know how each contract was negotiated, there are patterns of contract features, which suggest that each seller is offering a standardized contract as a starting point in the negotiations. Those standardized contracts tend to include a provision for pegging. This fact allows us to focus on key contract terms such as the pegging coefficient without worrying about the differences between the sellers. Because the incremental oil production, added cost (including added transportation cost and added operating cost), net CO2 utilization, and up-front investment all vary greatly for different fields, having data on these variables is crucial to the empirical analysis. Unfortunately, we are not able to locate usable data regarding these variables. Based on the data at hand, there are still a few implications of the model that can be tested.
First of all, the theoretical model predicts that a higher initial oil price leads to a higher pegging coefficient. To test this prediction, we define three different initial oil prices as the average oil price for the past one, two, or three months before the contract effective date, respectively. Secondly, simulation based on the theoretical model suggests that the optimal pegging coefficient is not sensitive to changes in the oil price volatility. Assuming that the oil price follows a random walk described by Geometric Brownian motion, for a year contract, the oil price volatility is the product of an annualized log oil price standard deviation and the square root of the contract duration,
. Therefore, we must first calculate the annualized log oil price standard deviation to test whether the pegging coefficient is insensitive to the oil price volatility. Based on “adaptive expectations,” we calculate the log oil price standard deviation using monthly log oil prices for the past one year prior to the contract effective date. Since we do not know how “backward-looking” the sellers are, we also calculate the standard deviation using monthly log oil prices for the past two and three years.Footnote14
Thirdly, the theoretical model predicts that a higher net CO2 utilization leads to a lower pegging coefficient. We calculate the net CO2 utilization by dividing the daily contracted CO2 volume by the daily enhanced oil production based on the EOR surveys published by the Oil & Gas Journal.Footnote15
Fourthly, the theoretical model assumes a monopolistic seller. This implies that the timing of the contracts may have important effects on the pegging coefficients. Intuitively, the buyer’s expected profits from the CO2 -EOR project must at least cover the up-front investment cost. Once the project has started, the up-front investment becomes a sunk cost. As a result, the initial contract needs to be attractive enough for the buyer to participate in the CO2 -EOR project. However, once the project has started, any follow-up contract only needs to guarantee a positive profit stream for the buyer to continue the EOR project. We construct a “Contract Timing” variable for the empirical analysis to indicate the lag between the initial injection date and the contract effective date for the same field. Last but not least, it is necessary to control the buyer-seller relation and the general areas where the oil fields are located. To do so, two dummy variables are introduced. One is the “Affiliation” dummy variable, used to indicate whether the buyer and seller are affiliated or not. Of the 46 contracts, there are 22 contracts whose buyer and seller are affiliated. The other is the “Area” dummy variable, used to indicate whether the oil fields are located in the Permian Basin or not. Of the 46 contracts, only one contract has CO2 supplied to an area other than the Permian Basin. shows a summary of the variables.
Table 7. Summary of the price-pegging contracts
It is important to note that the theoretical model assumes that the seller has full information about the oil field’s net CO2 utilization and the oil price distribution for the contract duration. Realistically speaking, since the seller at best has limited knowledge about this information, it may lead to some discrepancy when testing the predictions of the theoretical model using real-world contract data.
In general terms, the model we estimate can be written as
where is the pegging coefficient specified in the contracts, “Affiliation” is a dummy variable indicating whether the buyer and seller are affiliated, “Area” is a dummy variable indicating whether the CO2 is supplied to the Permian Basin or not,
is the initial oil price and
is the oil price volatility,Footnote16
is the time difference between the contract effective date and the initial injection date for the contracted field, and
is the net CO2 utilization of the oil field associated with any specific contract.
and report the results of the OLS estimation of Equationequation (1)(1)
(1) with different initial oil prices and different oil price volatility. In both tables, the signs of the coefficients on the “Initial Oil Price” variable are consistent with the theoretical prediction that an increase in the initial oil price will result in a higher pegging coefficient. Specifically, when the oil price goes up by one dollar per barrel, the pegging coefficient increases by approximately 0.001. Considering that the average pegging coefficient is only 0.0189, this is a rather significant impact. If the real oil price goes up by 10 dollars per barrel, the regression result suggests that the pegging coefficient could go from 2% to almost 3% of the oil price. The significant impact of the initial oil price is also consistent with the theoretical study.
Table 8. OLS regression of the pegging coefficient, against different initial oil prices
Table 9. OLS regression of the pegging coefficient, against different annual oil price volatility
The signs of the coefficients on the “Oil Price Volatility” variable are positive when the annual oil price volatility is calculated based on the one or two years of oil prices prior to the contract effective date. The signs become negative when the annual oil price volatility is calculated based on the past three years of oil prices before the contract effective date.(Although not shown in , the signs are the same when using average oil price calculated based on the past one or two months of the oil prices before the contract effective date.) The theoretical model predicts that higher oil price volatility should have a positive effect on the pegging coefficient. The regression result may suggest that the seller focuses more on recent oil price volatility. However, since the estimated coefficients on volatility are not statistically significant, not too much should be read into them.
The signs of the coefficients on the “Log Net CO2 Utilization” are negative, consistent with the theoretical model’s prediction. However, the estimated coefficients are not statistically significant. This may be largely due to the way the net CO2 utilization is calculated. Firstly, both the enhanced oil production given in the EOR surveys and the daily contracted CO2 is the average of the actual numbers. Secondly, as mentioned earlier, it is common for an oil field to have several active CO2 sales contracts simultaneously. Since we do not have access to all the active contracts for a certain period, this leads to an underestimated net CO2 utilization.
The signs of the coefficients on the “Contract Timing” variable are positive in most cases, suggesting that early CO2 supply contracts tend to have lower pegging coefficients. This result is consistent with the implication of the theoretical model. The coefficient to the “Affiliation” dummy variable suggests that the pegging coefficient would be marginally larger if the buyer and seller are affiliated. Although the estimated coefficient is not statistically significant, the sign does seem counter-intuitive, as one would expect affiliated firms to offer a price closer to the product’s production cost to mitigate the double marginalization problem. The coefficient to the “Area” dummy variable suggests that the pegging coefficient in the Permian Basin is significantly lower compared with other regions. However, not too much should be read since there is only one contract outside the Permian Basin region.
4. Conclusions
CO2 sales contracts used in the enhanced oil recovery industry vary greatly in various terms, such as the contracted quantity and price, contract length, effective date. Some contracts include a special price adjustment mechanism that pegs the CO2 price to the oil price. In other words, the CO2 price is defined as a percentage of the oil price. Using 103 CO2 sales contracts, this article investigates when this price-pegging price adjustment mechanism is used and how the price pegging is affected by other contract terms. A probit regression shows that contract terms’ length significantly increases the probability of price pegging being used. A shorter contract term implies that the oil price is less likely to have disruptive fluctuations. For price-pegging contracts, regression analysis of the pegging coefficients shows that higher initial oil prices, more volatile historical oil prices, and smaller net CO2 utilization are associated with high pegging coefficients. The regressions also suggest that contracts signed at the early stages of CO2 flooding tend to have lower pegging coefficients.
The CO2 -EOR industry has always been a niche market in the energy section. Nevertheless, it never stops growing over the years. Even under the shadow of the shale revolution, the number of CO2 -EOR projects in the U.S. has increased from 136 in 2014 to 150 in 2018 (EIA, Citation2018; Koottungal, Citation2014). Compared with other EOR techniques, its role in CCUS gives CO2 -EOR a special advantage. This is especially true once anthropogenic CO2 becomes a viable source for CO2 -EOR, which will likely happen given high enough oil prices or the right amount of policy support.
Currently, about 80% of the CO2 supplied to the Permian Basin is from natural sources that are rapidly depleting. The gap between the growing demand and the declining supply of natural CO2 can only be filled by anthropogenic sources (GCCSI, Citation2011; Kuuskraa & Wallace, Citation2014). There are 12 industrial CO2 sources supplying 0.7 Bcf per day or about 20% of CO2 used for EOR. Anthropogenic CO2 is expected to increase to 2.1 Bcf per day, accounting for more than 40% of CO2 used for EOR. With the huge coal reserves in the U.S. and the growing interests in clean coal energy, CO2 captured from coal-fired power plants may be the most promising anthropogenic source of CO2 for EOR.Footnote17
The transition from natural CO2 to anthropogenic CO2 has several important implications. Firstly, the increased number of CO2 sellers will reduce the market concentration and thus reduce sellers’ bargaining power. Secondly, a large up-front investment for CO2 capturing equipment is needed to produce anthropogenic CO2 . This transaction-specific investment becomes a sunk cost and weakens the CO2 seller’s ex-post bargaining power. Thirdly, anthropogenic CO2 captured from the air or biomass combustion has a significantly larger production cost per unit than CO2 extracted from natural deposits. Therefore, the break-even prices of anthropogenic CO2 sellers will be higher than those of natural CO2 sellers. All things considered, compared with sellers of CO2 from natural sources, the sellers of anthropogenic CO2 will most likely be in a much weaker position in terms of bargaining power. Consequently, long-term contracts that peg the CO2 price to the oil price should still be favored during and after this transition because of the reduced contract breaching risk and increased efficiency. However, the weaker bargaining position and the higher production cost suggest possibly lower pegging coefficients for anthropogenic CO2, complemented by a high price floor.
Disclosure statement
No potential conflict of interest was reported by the author(s).
Additional information
Funding
Notes on contributors
Shen Gao
Dr. Shen Gao is Assistant Professor at the Center for Economics, Finance and Management Studies, Hunan University. His research focuses on energy economics, environmental economics, and industrial organization.
Chenghan Hou
Dr. Chenghan Hou is Associate Professor at the Center for Economics, Finance and Management Studies, Hunan University. His research focuses on Bayesian econometrics, time series analysis, and macroeconomic forecasting.
Long Zhao
Dr. Long Zhao is Assistant Professor at the Center for Economics, Finance and Management Studies, Hunan University. His research focuses on industrial organization, innovation economics, and international economics.
Notes
1 See, for example, studies by Asghari and Al-Dliwe (Citation2004); Jessen, Kovscek, and Orr (Citation2005); Kovscek and Cakici (Citation2005); Babadagli (Citation2006); Forooghi, Hamouda, and Eilertsen (Citation2009); Pamukçu and Gumrah (Citation2009); Ghomian, Sepehrnoori, and Pope (Citation2010); Jahangiri and Zhang (Citation2011, Citation2012); Sobers, Blunt, and LaForce (Citation2013); Ettehadtavakkol, Lake, and Bryant (Citation2014); Song, Li, Wei, Lai, and Bai (Citation2014) using sophisticated reservoir models but ad hoc economics, and studies by Leach et al. (Citation2011); Van ’t Veld, Mason, and Leach (Citation2013); Wang et al. (Citation2018) for more rigorous economic analysis of the issue.
2 For the first ten years of operation, the CO2 purchasing cost could amount to as much as 68% of total costs (Jarrel, Fox, Stein, & Webb, Citation2002). In addition, investing in CO2 -EOR involves converting existing production wells to injection wells, drilling new wells, and building a recycling plant to capture, compress and re-inject some of the injected CO2 (van ’t Veld & Phillips, Citation2010).
3 Williamson (Citation1983) identifies four different types of transaction-specific investments. The up-front investment associated with CO2 -EOR should be identified as “Physical Asset Specificity” type, since the transaction-specific investment are made in equipment and machinery that are specifically designed for CO2 -EOR.
4 See Masten (Citation1988) and Hart (Citation2009) for further discussion of such “opportunistic behavoir”.
5 Assuming the cost of CO2 is at $40/metric ton and the oil price is $85/barrel.
6 The effective date of the latest contract is 1 January 2001, which means it was drafted in 2000.
7 This is not surprising as Company C is the earliest company entering the CO2 -EOR market and the biggest promoter of the CO2 -EOR technology. It also owns a large portion of the natural CO2 deposits and the pipeline network.
8 The Producer Price Index, which the Bureau of Labor Statistics publishes, measures the average change over time in the selling prices received by domestic producers for their output.
9 A possible explanation for the wide usage of WTI as the index is that the industry is following the leader. The early long-term contracts in our sample all use WTI as the index, with Company C being the seller.
10 We do find that price-pegging contracts are generally much longer than fixed-price contracts. This may imply that it is more costly to write a price-pegging contract.
11 Incremental oil production is defined as the volume of oil produced as a direct result of CO2 injected into the reservoir that would not otherwise be produced by currently available primary and secondary recovery techniques.
12 CO2 -EOR incurs both a higher transportation cost and a higher operating cost than waterflooding. The reason for the higher operating cost is the additional cost of recycling CO2.
13 Net CO2 utilization is defined as the cumulative net CO2 volume purchased divided by the incremental CO2 -EOR oil production.
14 The oil prices are adjusted for inflation, and the base month is March 2017. Moreover, if the effective date for a contract is 15th or earlier, the monthly oil prices used to calculate the standard deviation will include this month. If the effective date, however, is the 16th or later, the monthly oil prices used to calculate the standard deviation will exclude this month.
15 We use the natural logarithm of the net CO2 utilization because the untreated data are too skewed.
16 The theoretical work assume the changes of oil price can be described by Geometric Brownian motion, and is log-normally distributed (Agarwal, Citation2014; Gao & van ’t Veld, Citation2021). The volatility of oil price therefore should increase as the contract duration increases.
17 The Petra Nova project in Texas is currently the only coal-fired power plant that captures CO2 from coal combustion. According to its owners, NRG Energy and JX Nippon Oil & Gas Exploration Corp., the plant can capture over 90% of its CO2 emitted or over one million tons per year. The captured CO2 is transported to the West Ranch oil field 80 miles away, where it is used for CO2 -EOR.
References
- Agarwal, A. (2014). Risk sharing in CO delivery contracts for the CCS-EOR value chain. MIT Center for Energy and Environmental Policy Research, Working Papers.
- Arnold, S., Harmon, B., Rose, S., & Whitley, J. (2013). Valuing the cost of an economic price adjustment clause to the government. Defense Acquisition Research Journal, 20(2), 174–193.
- Asghari, K., & Al-Dliwe, A. (2004). Optimization of carbon dioxide sequestration and improved oil recovery in oil reservoirs. In Proceedings of the 7th International Conference on Greenhouse Gas Control Technologies: Amsterdam, 1: 381–389.
- Babadagli, T. (2006). Optimization of CO2 injection for sequestration/enhanced oil recovery and current status in Canada. In S. Lombardi, L. K. Altunina, & S. E. Beaubien (Eds.), Advances in the geological storage of carbon dioxide. Dordrecht: Springer. (pp. 261–270).
- Bloomberg (2012). Leading the energy transition: bringing carbon capture & storage to market. Bloomberg energy finance whitepaper.
- Cook, B. R. (2013). Wyoming’s miscible CO2 enhanced oil recovery potential from main pay zones. University of Wyoming, Enhanced Oil Recovery Institute (EORI) Working Papers & Reports.
- DOE (2010). Carbon dioxide enhanced oil recovery–untapped domestic energy supply and long term carbon storage solution. Author, March 2010. Available online at https://www.netl.doe.gov/file
- EIA. (2018). World energy outlook 2018. U.S. Energy Information Administration. 2018.
- Ettehadtavakkol, A., Lake, L., & Bryant, S. (2014). CO2-EOR and storage design optimization. International Journal of Greenhouse Gas Control, 25, 79–92.
- Faltinson, J. E., & Gunter, B. (2011). Net CO2 stored in North American EOR projects. Journal of Canadian Petroleum Technology, 50(7), 55–60.
- Forooghi, A., Hamouda, A., & Eilertsen, T. (2009). Co-optimization of CO2 eor and sequestration in a north sea chalk reservoir. Paper SPE 125550 presented at the 2009 SPE/EAGE Reservoir Characterization and Simulation Conference, Abu Dhabi, UAE, 19–21 October.
- Gao, S., & van ’t Veld, K. (2021). Pegging input prices to output prices—A special price adjustment clause in long-term CO2 sales contracts. Energy Economics, 104, 105619.
- GCCSI (2011). Bridging the commercial gap for carbon capture and storage. Global Carbon Capture and Storage Institute. Available online at https://www.globalccsinstitute.com/publications/bridging-commercial-gap-carbon-capture-and-storage.
- Ghomian, Y., Sepehrnoori, K., & Pope, G. (2010). Efficient investigation of uncertainties in flood design parameters for coupled CO2 sequestration and enhanced oil recovery. Paper SPE 139738 at the SPE International Conference on CO2 Capture, Storage, and Utilization, New Orleans, Louisiana, 10–12 November.
- Goldberg, V. P., & Erickson, J. R. (1987). Quantity and price adjustment in long-term contracts: A case study of petroleum coke. Journal of Law and Economics, 30(2), 369–398.
- Hart, O. (2009). Hold-Up, asset ownership, and reference points. The Quarterly Journal of Economics, 124(1), 267–300.
- Jahangiri, H., & Zhang, D. (2011). Optimization of the net present value of carbon dioxide sequestration and enhanced oil recovery. Paper OTC 21985 presented at the Offshore Technology Conference, Houston, Texas, 2–5 May.
- Jahangiri, H., & Zhang, D. (2012). Ensemble based co-optimization of carbon dioxide sequestration and enhanced oil recovery. International Journal of Greenhouse Gas Control, 8, 22–33.
- Jarrel, P., Fox, C., Stein, M., & Webb, S. (2002). Practical aspects of CO2 flooding — monograph volume 22. Richardson, Texas: Society of Petroleum Engineers.
- Jessen, K., Kovscek, A., & Orr, F., Jr. (2005). Increasing CO2 storage in oil recovery. energy conversion and management. Energy Conversion and Management, 45(2), 293–311.
- Joskow, P. L. (1987). Contract duration and relationship-specific investments: Empirical evidence from coal markets. American Economic Review, 77(1), 168–185.
- Joskow, P. L. (1988). Price adjustment in long-term contracts: the case of coal. Journal of Law and Economics, 31(1), 47–83.
- Klein, B., Crawford, R., & Alchian, A. (1978). Vertical integration, appropriable rents and the competitive contracting process. Journal of Law and Economics, 21(2), 297–326.
- Koottungal, L. (2014). 2014 worldwide EOR survey. Oil & Gas Journal, 112(4), 79–91.
- Kovscek, A., & Cakici, M. (2005). Geologic storage of carbon dioxide and enhanced oil recovery. II. Cooptimization of storage and recovery. Energy Conversion and Management, 46(11–12), 1941–1956.
- Kuuskraa, V., Godec, M. L., & Dipietro, P. (2013). CO2 utilization from “next generation” CO2 enhanced oil recovery technology. Energy Procedia, 37, 6854–6866.
- Kuuskraa, V., & Wallace, M. (2014). CO2-EOR set for growth as new CO2 supplies emerge. Oil & Gas Journal, 112(5), 92–92.
- Leach, A. L., Mason, C. F., & van ’t Veld, K. (2011). Co-optimization of enhanced oil recovery and carbon sequestration. Resource and Energy Economics, 33(4), 893–912.
- Martin, D., & Taber, J. (1992, April). Carbon dioxide flooding. Journal of Petroleum Technology, 44(4), 396–400.
- Masten, S. E. (1988). Equity, opportunism, and the design of contractual relations. Journal of Institutional and Theoretical Economics, 144(1), 180–195.
- Pamukçu, Y., & Gumrah, F. (2009). A numerical simulation study of carbon-dioxide sequestration into a depleted oil reservoir. Energy Sources, Part A: Recovery, Utilization, and Environmental Effects, 31(15), 1348–1367.
- Skolnik, J. (2011). Price indexing in transportation construction contracts. final report for NCHRP 20-07/Task 274, Transportation Research Board, Washington, DC.
- Sobers, L., Blunt, M., & LaForce, T. (2013, April). Design of simultaneous enhanced oil recovery and carbon dioxide storage with potential application to offshore Trinidad. SPE Journal, SPE-147241-PA(2), 345–354.
- Song, Z., Li, Z., Wei, M., Lai, F., & Bai, B. (2014). Sensitivity analysis of water-alternating-CO2 flooding for enhanced oil recovery in high water cut oil reservoirs. Computers & Fluidsl, 99, 93–103.
- Taylor, M. (2012). The current and future state of CCS and its deployment around the world. Greenhouse Gases-Science and Technology, 2(6), 399–401.
- Van ’t Veld, K., Mason, C. F., & Leach, A. L. (2013). The economics of CO2 sequestration through enhanced oil recovery. Energy Procedia, 37(4), 6909–6919.
- Van ’t Veld, K., & Phillips, O. (2009). The economics of CO2 sequestration through enhanced oil recovery. Working Paper.
- van ’t Veld, K., & Phillips, O. (2010). The economics of enhanced oil recovery: estimating incremental oil supply and CO2 demand in the powder river basin. Energy Journal, 31(4), 31–55.
- Wang, X., Van ’t Veld, K., Marcy, P., Huzurbazar, S., & Alvarado, V. (2018). Economic co-optimization of oil recovery and CO2 sequestration. Applied Energy, 222, 132–147.
- Williamson, O. E. (1979). Transaction-cost economics: The governance of contractual relations. Journal of Law and Economics, 22(2), 233–261.
- Williamson, O. E. (1983). Credible commitments: Using hostages to support exchange. American Economic Review, 73(4), 519–540.
- Williamson, O. E. (1985). The Economic Institutions of Capitalism. New York: The Free Press.