
 ?Mathematical formulae have been encoded as MathML and are displayed in this HTML version using MathJax in order to improve their display. Uncheck the box to turn MathJax off. This feature requires Javascript. Click on a formula to zoom.
ABSTRACT
This article aims to test a causal nexus between bitcoin market and economic policy uncertainty. We use the continuous wavelet analysis to investigate lead-lag relationship between bitcoin market and economic policy uncertainty in different time-frequency domains. Our findings show the negative relationship between bitcoin returns and economic policy uncertainty around the period of bitcoin’s currency recognition and COVIC-19 pandemic crisis both daily and monthly time series test. Furthermore, we find that the causality relationship between bitcoin and economic policy uncertainty is relatively indistinct around the period of bitcoin’s currency recognition, while bitcoin returns are leading economic policy uncertainty changes during COVID-19 pandemic crisis, indicating the economic policy uncertainty fluctuation trend can refer to the fluctuation of bitcoin, bitcoin can be viewed as a leading indicator, but it could not be employed as a safe-haven asset hedge against uncertainty during the period of COVID-19 pandemic.
1. Introduction
After the global financial crisis, a new digital currency named bitcoin created by Satoshi Nakamoto quickly gathered international interest and momentum because of online payments without utilizing the central ledgers of financial institutions. In 2016, bitcoin captured more than 80% of all cryptocurrency capitalization (Ethereum, Litecoin, Ripple, etc.), then attracted a lot of researchers focus on bitcoin market’s efficiency, features, predictability, security, comparison of stock, currency and commodity markets, etc. (Al-Yahyaee, Mensi, & Yoon, Citation2018; Bariviera, Citation2017; Ciaian, Kancs, & Rajcaniova, Citation2021; Gyamerah, Citation2020).
Bitcoin market displays long-memory and multifractality features (Al-Yahyaee et al., Citation2018), therefore, Bitcoin is an inefficient market (Bariviera, Citation2017). Compared with gold market, stock market and currency markets, bitcoin market is the most inefficient market (Al-Yahyaee et al., Citation2018). As the high-frequency bitcoin price series, Gyamerah (Citation2020) forecasted one-minute time interval of the price series of bitcoin. With increasing uncertainty due to the COVID-19 pandemic, economic policy uncertainty () has been paid more and more attention, some studies argue that which financial products can hedge against
(Balcilar, Gupta, & Pierdzioch, Citation2016; Bams, Blanchard, Honarvar, & Lehnert, Citation2017; Beckmann, Berger, & Czudaj, Citation2019; Bouri, Roubaud, Jammazi, & Assaf, Citation2017; Cai, Tao, Y, & Yan, Citation2020; Shehzad, Bilgili, Zaman, Kocak, & Kuskaya, Citation2021). However, no conclusive results have been reached about the form and the causal direction of the volatility linkage between cryptocurrency markets and
. So, it is important to explore the dynamic relationship between the bitcoin markets and
, and whether bitcoin can hedge against the economic policy uncertainty.
Many literatures discussed whether bitcoin can be used as a hedging asset applying different analysis (Bouri, Shahzad, Roubaud, Kristoufek, & Lucey, Citation2020; Mokni, Ajmi, Bouri, & Vinh, Citation2020; Nguyen, Nguyen, Nguyen, & Pham, Citation2019; Smales, Citation2019; Wang, Xie, Wen, & Zhao, Citation2019). Wang et al. (Citation2019) examine the risk spillover effect from economic policy uncertainty to bitcoin at different risk levels using multivariate quantile model and Granger causality risk test. Mokni et al. (Citation2020)show that an increase in the economic policy uncertainty level is associated with an increase in the optimal weight of bitcoin in the portfolio before the bitcoin crash of December, and after the bitcoin crash, there is a negative effect of economic policy uncertainty on the dynamic conditional correlations between bitcoin and the USA stock markets. Bouri et al. (Citation2020) find the least dependent between bitcoin and the stock markets among bitcoin/gold/commodities and stock markets using the wavelet coherency approach. Aslanidis, Bariviera, and López (Citation2022) indicate that there is a bidirectional flow of information between Google Trends attention and cryptocurrency returns up to 6 days, so cryptocurrencies are linked to a Google Trends attention. Other discussions about bitcoin price volatility, price discovery, information efficiency, etc., are reviewed by Bariviera and Merediz-Solà (Citation2021) for detail.
As the inconsistencies in the time series of bitcoin price (Alexander & Dakos, Citation2019), different with Dyhrberg (Citation2016), Baur, Dimpfl, and Kuck (Citation2018) and Cheikh, Zaied, and Chevallier (Citation2020) used GARCH models to test bitcoin market’ volatility, we use the continuous wavelet analysis to extend the time-frequency test between bitcoin price and economic policy uncertainty. This method does not require the two series to be stationary of cointegrated which exhibits a major advantage of widely accommodating financial series, regardless of stationary properties. Therefore, the continuous wavelet analysis can describe how the volatility linkage between two series develops over time and varies across different frequency bands in a highly intuitive way. The main advantage of continuous wavelet analysis is decomposing series by different time scale and provides information about the lead-lag relationship between two time series. It has been widely used to identify the leading indicator between two interactive factors or estimate the co-movement and causality between two time series (Aloui et al., Citation2016; Cai et al., Citation2020; Chen, Chen, & Tseng, Citation2017; Matar, Citation2020; Zaremba, Umar, & Mikutowski, Citation2019). So, we can test whether bitcoin can be viewed as a leading indicator hedge against the economic policy uncertainty across different times and frequencies using continuous wavelet analysis.
Aloui et al. (Citation2016) find a strong positive association in the short term and a negative linkage for longer time-scales between Islamic stock and bond markets among the Gulf Cooperation Council countries using wavelet approach. Zaremba et al. (Citation2019) discussed the inflation hedging properties of commodities in UK using wavelet analysis, showing that the co-movement is strong at the aggregate level and for energy, industrials or agriculturals from 13th to the 19th centuries, but it visibly weakened in the 20th century. Bahramian and Saliminezhad (Citation2020) tested a causal nexus between capacity utilization and inflation in the US using wavelet coherency and phase differences, showing that capacity utilization and inflation can be related to each other in the short term significantly and primarily, and mostly capacity utilization contains forecasting ability for inflation in the short-term frequency, whereas in the medium and long term, the causal link changes often.
This paper focus on a causal nexus between bitcoin market and economic policy uncertainty to confirm whether bitcoin can hedge against . We use the
index to quantify global economic policy uncertainty from Economic Policy Uncertainty website (www.policyuncertainty.com).
index explored by Davis (Citation2016) is a GDP-weighted average of national
indices for 16 countries that account for two-thirds of global output. Each national
index reflects the relative frequency of own-country newspaper articles that contain a trio of terms pertaining to the economy, uncertainty and policy-related matters. For the bitcoin price, we choose bitcoin close and weighted price from the Bitstamp exchange. In September 2013, the USA Senate discussed the impact and opportunities brought by bitcoin. The seminar weakened the negative role of bitcoin and encouraged the direction of scientific and technological innovation of bitcoin. Federal Reserve Chairman Ben Bernanke also expressed cautious optimism and wishes for the bitcoin,Footnote1 and this marked the recognition of bitcoin in real sense. Through the continuous wavelet analysis, we found that bitcoin returns and economic policy uncertainty are negatively correlated around the period of bitcoin’s currency recognition and COVIC-19 pandemic crisis both daily and monthly time series test. The causality relationship between bitcoin and
is relatively indistinct around the period of bitcoin’s currency recognition in 2013 by daily time series test. By monthly time series test around 2013 and both daily and monthly time series test during COVID-19 pandemic crisis, the results show that bitcoin returns are leading economic policy uncertainty changes, indicating
fluctuation trend can refer to the fluctuation of bitcoin, bitcoin can be viewed as a leading indicator, but it could not be employed as a safe-haven asset hedge against uncertainty during the period of COVID-19 pandemic.
2. Methodology
Wavelet analysis breaks empirical analysis into time-frequency components, which both time and frequency changing information of the time series can be well visualized. Wavelet analysis’ advantage is not only handling irregular data series, but also decomposing series by time scale (Daubechies, Citation1992), so that economic variables can be accommodate on different time scales simultaneously (Ramsey, Citation2002). There are two kinds of wavelet transforms: discrete wavelet and continuous wavelet transforms which can extract the local amplitudes of a time series in time and frequency domains. The continuous wavelet analysis mainly involves wavelet coherency and phase-difference. Based on a mother wavelet , a family
of “wavelet daughter” is defined as:
where is a translation parameter depicting where the mother wavelet
is centred, and
is a scaling factor determining the wavelet compressed or stretched. If
, then the mother wavelet
is compressed, if
, shows that the mother wavelet is stretched across frequencies. We choose Morlet waveletFootnote2 as the mother wavelet, which is given as:
where , and
.
Based on the mother wavelet, the continuous wavelet transform is defined as
where * denotes the complex conjugation of the Morlet wavelet. The time series is expanded into a time-frequency space depending on and
. Then, the wavelet power spectrum is given as:
Further, the cross-wavelet transform of two different time series, and
is defined as:
where and
are the continuous wavelet transforms of
and
. And the dynamic correlation in different time-frequency domain can be investigated by the wavelet coherency. The wavelet coherency is defined as follows:
which is a scaling factor. And the phase-difference is applied to reveal the positive or negative correlation and lead-lag interaction between two different financial time series. The angle
of the complex coherency is the phase-difference, which is defined as:
where and
are the imaginary part and real part, respectively. Because of the time, frequencies and the strength of the correlation between different time series are considered at the same time, wavelet coherency can provide a better measure of co-movement that exists between different variables, but it does not determine the direction (the arrow point) of the co-movement. And the phase-difference which can detect information on the phase delay between oscillation in different time series as a function of frequency (Bloomfield, Citation2004) could be used to find the direction and causal relationship between different series. Different arrows (range of angles) indicate different lead-lag relationship between two series.
3. Data
We use daily and monthly data on the bitcoin price and economic policy uncertainty variables covering January 2012 to June 2021. Alexander and Dakos (Citation2019) underlined that the choice of data is relevant in cryptocurrency studies, and according to Vidal-Tomás (Citation2021), we choose close and weightedFootnote3 data of bitcoin market which are the most active cryptocurrency markets. For economic policy uncertainty variables, we choose global explored by Davis (Citation2016) which is based on Baker, Bloom, and Davis (Citation2016). We use this sample period due to the data availability of all the data sources. The original data were derived from the Economic Policy Uncertainty website and bitcoincharts website. The daily and monthly returns of bitcoin close price
or weighted price
are defined as the logarithmic difference of the monthly close price
or weighted price
, the formulas are as follows
We set daily and monthly changes in as follows:
,
,
observations are illustrated in .
Table 1. Descriptive statistic for ,
observations.
shows the descriptive statistics for daily and monthly bitcoin return, change. Each bitcoin return of the mean value is close to zero, and its standard deviation is nearly zero except monthly
change. Each skewness is nearly zero and kurtosis are all smaller than 3, indicating no strong deviations from normality. The ADF test shows the stationarity of daily and monthly bitcoin return,
change at the 1% significance level.
4. Empirical results
4.1. The wavelet power spectrum analysis
displays the wavelet power spectrum of bitcoin return and . The color represents the strength of power, ranging from blue (low power) to yellow (high power). The cone of influence (COI) is given by a white line, which defines the regions affected by the edge effects. We mainly focus on the regions inside the COI.
Figure 1. (a.1-c.1) The volatility of daily bitcoin return (daily ) and
, (d.1-f.1) The volatility of monthly
and
, respectively. (a.2-f.2) The wavelet power spectrum of daily and monthly
,
respectively. The white line refers to the COI. The color code of power varies from blue (low power) to yellow (high power).
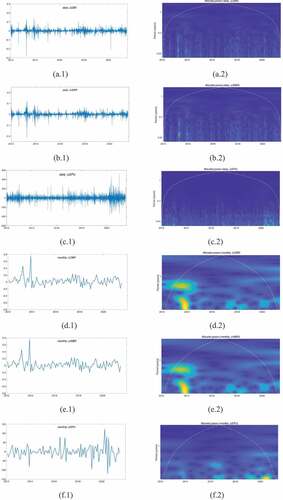
As shown in (a.2-c.2), the horizontal axis denotes the time component while the vertical axis denotes the frequency bands, from period 0.01 year (3.6 days) up to period 1 year. (a.1),(b.1) show the bitcoin return seems to present a stable pattern. We focus on the variation as shown in (a.2),(b.2), the volatilities of close and weighted bitcoin return are significant (at 5% significance level) in the 0–0.01 year frequency band during 2013–2014. This implies the significant volatilities of bitcoin return when bitcoin was regarded as a recognitory form of currency in the very short term. Due to the stimulus economic policies after the global financial crisis and various countries’ governments express their position on bitcoin, a relatively high level of bitcoin volatilities as shown in the figures during that time in the very short term. (c.2) shows significant (at 5% significance level) volatilities of daily changes in the 0–0.01 year frequency band starting in 2020. This means the high level of
changes from 2020 in the very short term. The results indicate that the impact caused by the COVID-19 is much significant than any other times. With the continuous control of the COVID-19 infection, the fluctuation of
began to alleviate.
In (d.2-e.2), the volatilities of monthly close and weighted bitcoin return are significant (at 5% significance level) in the 0–1 year frequency band during 2013–2014, 0–0.05 year frequency band around 2014. This also implies the significant volatilities of bitcoin return when bitcoin was regarded as a recognitory form of currency in the very short term. The volatilities of close and weighted bitcoin return are significant in the 0–0.05 year frequency band around 2018 and 2020 with the impact of supervision of bitcoin from 2018 and COVID-19 infection from 2020, but the impact is weaker than when it was regarded as a recognitory form of currency in 2013. (f.2) shows significant (at 5% significance level) volatilities of monthly changes in the 0–0.5 year frequency band starting in 2020. This also means the high level of
changes from 2020 in the very short term. The results also indicate that the impact caused by the COVID-19 is much significant than any other times. With the continuous control of the COVID-19 infection, the fluctuation of
changes began to reduce. The results of daily and monthly data are consistent, indicating the reliability of our conclusion.
4.2. The wavelet coherency and the phase-difference
Since the bitcoin market is an endless time series of prices, we separate the vertical axis into five frequency bands corresponding to the volatilities in the very short term, short term, medium term, long term, and very long term.
We identify causality and phase differences between bitcoin returns and changes. Arrows indicate the phase differences between bitcoin returns and
changes. For example,
and
indicate both bitcoin and
changes are in phase and out of phase, respectively. ↗ and ↙ indicate bitcoin returns are leading
changes, while ↘ and ↖ indicate bitcoin returns are lagging economic policy uncertainty changes.
As shown in ), we observe the results of these two figures are basically consistent, and the significant degree of co-movement between daily bitcoin returns and changes for 2013–2015 period across the 0.25–1 year frequency band, for 2019–2021 period across the above 1 year frequency band, around 2020 period across the 0.0625–1 year frequency band. We find the arrow point ↙ for 2013–2015 period across the 0.25–1 year frequency band, around 2020 period across the 0.0625–1 year frequency band, indicating bitcoin returns and
changes are negatively correlated, bitcoin returns are leading
changes in the long term and very long term. The arrow point
for 2019–2021 period across the above 1 year frequency band, indicating bitcoin returns and
changes are out of phase, bitcoin returns and
changes are negatively correlated in the long term. The arrow point ↖ around 2014 across the 0.25–1 year frequency band, indicating bitcoin returns and
changes are negatively correlated, bitcoin returns are lagging
changes in the long term. Since 2013, after bitcoin was regarded as a recognitory form of currency, bitcoin returns and
changes are negatively correlated, but the causality relationship between bitcoin and
is relatively indistinct. After the COVID-19 pandemic in the world, bitcoin return can lead
changes in the very long term are further affirmed. That means, in the early period of bitcoin development, bitcoin cannot be viewed as a leading indicator and cannot as a safe-haven asset hedge against economic uncertainty. In the mature period of bitcoin development, bitcoin can be viewed as a leading indicator, but it could not be employed as a safe-haven asset hedge against uncertainty from the high-frequency data, to a certain extent.
Figure 2. Wavelet coherency of daily CBR- (a), WBR-
(b), and monthly CBR-
(c), WBR-
(d) respectively. The arrows contour denotes the 5% significance level. The color code of power varies from blue (low power) to yellow (high power).
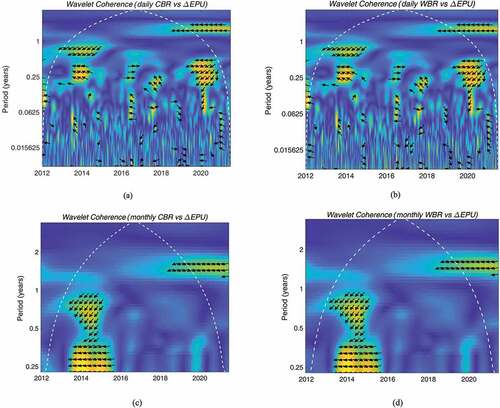
In ), for the monthly time series test, the significant degree of co-movement between bitcoin returns and is 2013–2015 period across the 0.5–1 year frequency band, for 2015–2016 year period across the 0–0.5 year frequency band, for 2018–2021 period across the 1–2 years frequency band. ↙ for 2013–2016 across the 0–1 year frequency band shows that there is a negative relationship between bitcoin return and
changes, and bitcoin returns are leading
changes in the very short term, short term and medium term. ↙ for 2018–2021 period across the 1–2 years frequency band, also indicating bitcoin returns and
changes are negatively correlated, bitcoin returns are leading
changes in the long term around COVID-19 pandemic crisis. The results of wavelet coherence and phase-difference test for daily and monthly data are basically consistent, meaning the reliability of our conclusion. Since 2013, after bitcoin was regarded as a recognitory form of currency, bitcoin returns and
changes are negatively correlated, bitcoin returns can lead
changes. After the COVID-19 pandemic crisis, bitcoin role is further confirmed. That means, in the early and mature period of bitcoin development, bitcoin can be viewed as a leading indicator, but it could not be employed as a safe-haven asset hedge against uncertainty from the data of low frequency.
4.3. Further discussion
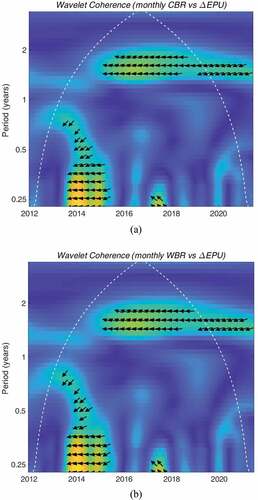
As the two major economics are the USA and China, we test whether the results are the same if we select USA or China , the causality and phase differences between bitcoin returns and USA
changes are as follows in ). As shown in ), we can see the significant degree of co-movement between bitcoin returns and USA
is 2013–2015 period across the 0–1 year frequency band, 2016–2019 period across the 1–2 year frequency band, and 2019–2021 period across the 1–2 years frequency band. ↙ for 2013–2015 across the 0–1 year frequency band shows that there is a negative relationship between bitcoin return and EPU changes, and bitcoin returns are leading EPU changes in the very short term, short term and medium term. ← for 2016–2019 period across the 1–2 years frequency band, indicating bitcoin returns and
changes are out of phase, bitcoin returns and
changes are negatively correlated in the long term. ↙ for 2019–2021 across the 1–2 years frequency band, also indicating bitcoin returns and
changes are negatively correlated, and these results are similar to ).
Figure 3. Wavelet coherency of monthly CBR-USA (a), WBR-USA
(b), respectively. The arrows contour denotes the 5% significance level. The color code of power varies from blue (low power) to yellow (high power).
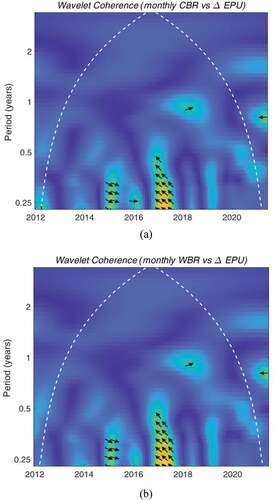
The causality and phase differences between bitcoin returns and China changes are as follows in ). As shown in ), we can see the significant degree of co-movement between bitcoin returns and China
is 2015–2016 period across the 0–0.5 year frequency band, and 2017–2018 period across the 0–0.5 years frequency band. ↘ for 2015–2016 across the 0–0.5 year frequency band shows that there is a positive relationship between bitcoin return and
changes, and bitcoin returns are lagging
changes in the very short term and short term. ↖ for 2017–2018 period across the 0–0.5 years frequency band, indicating bitcoin returns and
changes are negatively correlated. These results are not similar to the causality and phase differences between bitcoin returns and global
. The possible reasons are: first, bitcoin is a currency that is not recognized by the government in China, second, in recent years, China has been carrying out structural economic reform to expand domestic supply and demand cycle in order to deal with the Sino-US trade friction. So relationship between bitcoin and
is weak in China.
Figure 4. Wavelet coherency of monthly CBR-China (a), WBR-USA
(b), respectively. The arrows contour denotes the 5% significance level. The color code of power varies from blue (low power) to yellow (high power).
5. Conclusions
In this paper, we discuss that whether the bitcoin can play a role as a safe-haven asset to hedge against uncertainty and risk. The co-movement between bitcoin return and economic policy uncertainty changes are investigated using the continuous wavelet analysis which can provide more information on the dynamic relationship. The main findings of the study are as follows. First, the empirical results show that the daily, monthly close and weighted bitcoin returns all experienced significant volatilities since bitcoin as a recognitory form of currency, the experienced the most significant volatilities during COVID-19 pandemic crisis. Secondly, bitcoin return is negatively correlated with
changes since the period of bitcoin’s currency recognition and COVID-19 pandemic in the world, this relationship is consistent using daily and monthly time series. Finally, with the daily time series, the causality relationship between bitcoin and
is relatively indistinct around the period of bitcoin’s currency recognition, while bitcoin return can lead
changes in the very long term during COVID-19 pandemic crisis; with the monthly time series, bitcoin return can lead
changes in the very short term, short term and medium term since the period of bitcoin’s currency recognition, and bitcoin return can also lead
changes in the long term during COVID-19 pandemic crisis. In general, the bitcoin market can be viewed as a leading indicator, but it could not be employed as a safe-haven asset hedge against economic policy uncertainty. Further discussion shows the above results could be applied to the USA, but may not be applicable to China.
This paper provides empirical evidence from the perspective of lead-lag relationship using the continuous wavelet analysis. The above results provide several implications for market participants. In times of heightened , investors need to reduce the relative holding share of bitcoin, policy makers should sustain the momentum of capital performances, regulate financial market to maintain financial stability. Because of the linkage effect of various financial factors, this paper is useful to improve the stable development of the world.
Acknowledgments
We thank editors and an anonymous referee for their useful comments and suggestions.
Disclosure statement
No potential conflict of interest was reported by the authors.
Additional information
Funding
Notes
1 See SEC (Securities and Exchange Commission) Testimony before the Senate Committee on Homeland Security and Governmental Affairs. 30 August (https://www.documentcloud.org/documents/835843-virtual-currency-hearings.html). The document of virtual-currency-hearings in page 10 (also can search in Board of Governors of the Federal Reserve System website). “These types of innovations [such as Bitcoin] may pose risks related to law enforcement and supervisory matters, there are also areas in which they may hold long-term promise, particularly if the innovations promote a faster, more secure and more efficient payment system.”
2 There are different types of mother wavelets: Daubechies, Haar, Mexican hat, Morlet and so on. We choose Morlet wavelet because it provides the possibility of calculating the amplitudes and phases of continuous wavelet transforms, which can be used of the estimations of the wavelet power spectrum, wavelet coherency and the phase difference, it is the most applicable mother wavelet among the different types.
3 Weighted data is calculated with the average of the prices across the 24-hour period.
References
- Al-Yahyaee, K. H., Mensi, W., & Yoon, S.-M. (2018). Efficiency, multifractality, and the long-memory property of the bitcoin market: A comparative analysis with stock, currency, and gold markets. Finance Research Letters, 27, 228–234.
- Alexander, C., & Dakos, M. (2019). A critical investigation of cryptocurrency data and analysis. Quantitative Finance. doi:10.1080/14697688.2019.1641347
- Aloui, C., Hkiri, B., & Nguyen, D. K. (2016). Real growth co-movements and business cycle synchronization in the GCC countries: Evidence from time-frequency analysis. Economic Modelling, 52, 322–331.
- Aslanidis, N., Bariviera, A. F., & López, Ó. G. (2022). The link between cryptocurrencies and google trends attention. Finance Research Letters, 102654. doi:10.1016/j.frl.2021.102654
- Bahramian, P., & Saliminezhad, A. (2020). Does capacity utilization predict inflation? A wavelet based evidence from United States. Computational Economics, 58(4), 1103–1125.
- Baker, S., Bloom, N., & Davis, S. (2016). Measuring economic policy uncertainty. Quarterly Journal of Economics, 131(4), 1593–1636.
- Balcilar, M., Gupta, R., & Pierdzioch, C. (2016). Does uncertainty move the gold price? New evidence from a nonparametric causality-in-quantiles test. Resources Policy, 49, 74–80.
- Bams, D., Blanchard, G., Honarvar, I., & Lehnert, T. (2017). Does oil and gold price uncertainty matter for the stock market? Journal of Empirical Finance, 44, 270–285.
- Bariviera, A. F. (2017). The inefficiency of Bitcoin revisited: A dynamic approach. Economics Letters, 161, 1–4.
- Bariviera, A. F., & Merediz-Solà, I. (2021). Where do we stand in cryptocurrencies economic research? A survey based on hybrid analysis. Journal of Economic Surveys, 35(2), 377–407.
- Baur, D. G., Dimpfl, T., & Kuck, K. (2018). Bitcoin, gold and the US dollar – A replication and extension. Finance Research Letters, 25, 103–110.
- Beckmann, J., Berger, T., & Czudaj, R. (2019). Gold price dynamics and the role of uncertainty. Quantitative Finance, 19(4), 663–681.
- Bloomfield, P. (2004). Fourier analysis of time series: An introduction. New York: Wiley.
- Bouri, E., Roubaud, D., Jammazi, R., & Assaf, A. (2017). Uncovering frequency domain causality between gold and the stock markets of China and India: Evidence from implied volatility indices. Finance Research Letters, 23, 23–30.
- Bouri, E., Shahzad, S. J. H., Roubaud, D., Kristoufek, L., & Lucey, B. (2020). Bitcoin, gold, and commodities as safe havens for stocks: New insight through wavelet analysis. The Quarterly Review of Economics and Finance, 77, 156–164.
- Cai, Y., Tao, X. Y., & Yan, Z. X. (2020). Stock market trading volumes and economic policy uncertainty dependence: Before and during Sino-US trade friction. Economic Research-Ekonomska Istraživanja, 33(1), 1711–1728.
- Cheikh, N. B., Zaied, Y. B., & Chevallier, J. (2020). Asymmetric volatility in cryptocurrency markets: New evidence from smooth transition GARCH models. Finance Research Letters, 35, 101293.
- Chen, M. P., Chen, W. Y., & Tseng, T. C. (2017). Co-movements of returns in the health care sectors from the US, UK, and Germany stock markets: Evidence from the continuous wavelet analyses. International Review of Economics & Finance, 49, 484–498.
- Ciaian, P., Kancs, D., & Rajcaniova, M. (2021). The economic dependency of bitcoin security. Applied Economics, 53(49), 5738–5755.
- Daubechies, I. (1992). Ten lectures on wavelets. (Vol. 61). Philadelphia: SIAM.
- Davis, S. J. (2016). An index of global economic policy uncertainty. NBER Working Paper, No. 22740.
- Dyhrberg, A. H. (2016). Bitcoin, gold and the dollar: A GARCH volatility analysis. Finance Research Letters, 16, 85–92.
- Gyamerah, S. A. (2020). On forecasting the intraday bitcoin price using ensemble of variational mode decomposition and generalized additive model. Journal of King Saud University-Computer and Information Sciences. doi:10.1016/j.jksuci.2020.01.006
- Matar, A. (2020). Does electricity consumption impacting financial development? Wavelet analysis. Future Business Journal, 6(1), 18.
- Mokni, K., Ajmi, A. N., Bouri, E., & Vinh, V. (2020). Economic policy uncertainty and the bitcoin-US stock nexus. Journal of Multinational Financial Management, 57-58, 100656.
- Nguyen, T. V. H., Nguyen, B. T., Nguyen, K. S., & Pham, H. (2019). Asymmetric monetary policy effects on cryptocurrency markets. Research in International Business and Finance, 48, 335–339.
- Ramsey, J. B. (2002). Wavelets in economics and finance: Past and future. Studies in Nonlinear Dynamics and Econometrics, 6(3), 1–27.
- Shehzad, K., Bilgili, F., Zaman, U., Kocak, E., & Kuskaya, S. (2021). Is gold favourable than bitcoin during the COVID-19 outbreak? Comparative analysis through wavelet approach. Resources Policy, 72, 102163.
- Smales, L. (2019). Bitcoin as a safe haven: Is it even worth considering? Finance Research Letters, 30, 385–393.
- Vidal-Tomás, D. (2021). An investigation of cryptocurrency data: The market that never sleeps. Quantitative Finance, 21(12), 2007–2024.
- Wang, G. J., Xie, C., Wen, D. Y., & Zhao, L. F. (2019). When bitcoin meets economic policy uncertainty: Measuring risk spillover effect from EPU to bitcoin. Finance Research Letters, 31, 489–497.
- Zaremba, A., Umar, Z., & Mikutowski, M. (2019). Inflation hedging with commodities: A wavelet analysis of seven centuries worth of data. Economics Letters, 181, 90–94.