?Mathematical formulae have been encoded as MathML and are displayed in this HTML version using MathJax in order to improve their display. Uncheck the box to turn MathJax off. This feature requires Javascript. Click on a formula to zoom.
ABSTRACT
Previous studies on commodity price bubbles mainly focused on futures markets and ignored the performance of spot markets. Using the price data for corn and soybeans in China, this study identifies the exact bubble dates for the futures and spot markets, and finds asynchronous price bubbles between these two markets. Bubbles are more frequent for commodity spot prices, while the corresponding futures prices still dominate the process of price discovery. Further analysis reveals that, the lack of (immediate) linear transmission between the cointegrated prices may have inhibited bubble synchronization, and caused more spot price bubbles. The nonlinear transmission effects between the futures and spot prices suggest the existence of speculative storage and market power. This may further explain why spot price bubbles cannot be arbitraged away.
1. Introduction
The controversy on price bubbles in commodity futures markets is long lasting (Gutierrez, Citation2013). Price bubbles associated with rapid and persistent price increases could distort market trades since prices are the most important signals for traders (Phillips et al., Citation2012). Meanwhile, price bubbles in agricultural commodity markets could generate devastating consequences. For instance, in 2007–2008, the nominal prices of almost all food commodities increased by more than 50% and 130 million people in developing countries fell into extreme poverty (World Bank, Citation2008). The impacts of food price bubbles mainly hurt the poor, who spend large shares of their income on staple foods (Tadesse et al., Citation2014). The public and some scholars tend to think that agricultural price bubbles are caused by aggressive financialization of commodity futures markets (Basak & Pavlova, Citation2016; Master, Citation2008, Citation2009; Tang & Xiong, Citation2012). They argue that too many institutional funds have taken long positions in agricultural futures markets without considering the fundamental value of agricultural commodities, and drive agricultural commodity prices up; this further distorts price expectation by commercial traders in futures markets, who aim to hedge against price risks in spot markets.
Limited evidence has been found to support the mispricing effects on futures markets caused by over-financialization (Bohl et al., Citation2021; Boyd et al., Citation2018); however, policymakers still tend to restrain the speculative trades in commodity futures markets, when commodity prices increase rapidly (Mao et al., Citation2021). Meanwhile, much of the related literature overlooks the price bubbles taking place in spot markets, and provides no basis for the synchronization (or asynchronization) of bubbles between agricultural futures and spot markets. Are there synchronous price bubbles between agricultural futures and spot markets? If not, what may have caused price bubbles in agricultural spot markets? This study seeks to close the research gap by identifying the exact price bubble dates first, and then investigating the interaction mode between agricultural futures and spot prices during their bubble periods. We extend the existing empirical literature on agricultural commodity price bubbles by highlighting the role of nonlinear transmission effects across agricultural futures and spot markets. More importantly, from the estimates of nonlinear price transmission effects, researchers often make inferences as to the existence of market power or speculative storage controlled by some market participants (such as retailers, wholesalers or producers) (Assefa et al., Citation2017; Loy et al., Citation2018; Nakamura & Zerom, Citation2010; Sexton, Citation2013; Sexton & Zhang, Citation2001). Thus, to identify and analyze commodity price bubbles, more attention should be paid to the pricing behaviour and structure of spot markets.
Futures markets serve important functions in price discovery and hedging for agricultural commodities. The theory of storage predicts that the futures and spot prices should be cointegrated with each other (Pindyck, Citation1992; Telser, Citation1958; Working, Citation1948), which has been verified by numerous empirical studies (Crain & Lee, Citation1996; Garbade & Silber, Citation1983; Hernandez & Torero, Citation2010; Mattos & Garcia, Citation2004). Thus, when it comes to commodity price bubbles, a seemingly plausible deduction is that bubbles synchronize between the futures and spot markets.
Nevertheless, the non-linearity of price transmission within and across markets calls the synchronization of bubbles between the futures and spot prices into question. Cointegration relationship indicates a common stochastic trend between price series (Engle & Granger, Citation1987). The tight connection between commodity futures and spot prices is based on the hypothesis of linear transmission between them. However, the immediate and linear transmission between cointegrated prices has long been challenged in real markets (Loy et al., Citation2018).
Some studies have theoretically proven that a cointegration relationship between prices remains even for bubbles that occur within one of the cointegrated price series (Engsted, Citation2006; Magdalinos & Phillips, Citation2009; Nielsen, Citation2010). In the case of nonlinear convergence between cointegrated price series, prices may even experience an explosive behaviour within a band of inaction (Fan & Wei, Citation2006). Alexakis et al. (Citation2017) also doubt the direct transmission of price bubbles within the context of the hog supply chain (hog, corn and soybeans). Based on the cointegration residuals among these three commodity prices, they find that bubbles in feed prices and lack of associated bubbles in hog prices do not affect the long-run cointegration relationship and that the hog prices will even drag the other explosive price episodes back to normal. Esposti and Listorti (Citation2013) consider price bubbles as exogenous structural breaks, finding that price bubbles only have very limited effects on the cointegrated international and Italy domestic grain prices. Adämmer and Bohl (Citation2015) and Gutierrez (Citation2013) find that speculative price bubbles can affect the relationship between spot and futures prices. Li and Xiong (Citation2019) even find that the performance of price discovery in commodity futures market is better during bubble periods, compared with that of non-bubble periods.
Above all, we aim to provide new insights into the formation of price bubbles in agricultural commodity markets by highlighting the nonlinear transmission effects. We first detect the bubble dates and measure the degree of the bubble synchronization across the futures and spot markets of corn and soybeans in China. Then, we use the unit root test based on momentum-threshold autoregressive model (M-TAR), the threshold Vector Error-Correction Model (VECM) and the time-varying partially cointegrated Vector Error-Correction Model (TV-PC-VECM) to estimate the non-linear transmission effects and identify the interaction mode between the futures and spot prices that relates with frequent bubbles.
Our study is closely related to the literature on the relationship between financialization of commodities and price bubbles (Etienne et al., Citation2015, Citation2017; Irwin & Sanders, Citation2012; Mao et al., Citation2020; Sanders et al., Citation2010). In contrast, we extend the study to the commodity spot markets which have been ignored in previous research, and find that a relatively less efficient spot market may have resulted in more frequent bubbles. Our findings are also related to the literature of nonlinear price transmission along supply chain (Azzam, Citation1999; Bachmeier & Griffin, Citation2003; Bacon, Citation1991; Benzarti et al., Citation2020; Loy et al., Citation2015, Citation2016, Citation2018). We point out that speculative storage and market power suggested by nonlinear transmission effects could prevent the spot price bubbles from being arbitraged away.
The structure of the paper is as follows: Section 2 introduces the theoretical framework of this paper, including the definition of bubbles and the nonlinear transmission effect on bubbles. Section 3 introduces the bubble testing method, the unit root tests based on M-TAR model, and the TV-PC-VECM model. Section 4 describes the data. Section 5 presents the main estimation results. In section 6, we summarize the main findings and present some conclusion.
2. Theoretical framework
2.1. The definition of price bubbles
To define price bubbles, we follow the study of Blanchard and Watson (Citation1982). The price process of one asset should be:
where represents the price at time t,
represents the dividend or payoff of the asset at time t,
is the risk-free interest rate and
is the expectation based on the information set at time t. Take the convenience yields as the dividends for commodities, Equationequation (1)
(1)
(1) can also be used to explain the formation of commodity futures price (Pindyck, Citation2001). Forward iterating Equationequation (1)
(1)
(1) to infinite periods, we can get the fundamental price of the commodity:
only when the transversality condition is fulfilled, namely the price at the infinite future point is zero:
Equationequation (2)(2)
(2) is the unique solution of Equationequation (1)
(1)
(1) . However, when Equationequation (3)
(3)
(3) does not hold, Equationequation (2)
(2)
(2) will no longer be the unique solution. Consider a bubble component
with the property:
adding this into Equationequation (2)
(2)
(2) will also satisfy Equationequation (1)
(1)
(1) . That is
In this case, the bubble component grows at rate and the cross-period non-arbitrage condition still holds. Thus, the rational expectation of investors is not biased and this kind of price bubbles is called as rational price bubbles.
Moreover, under the plausible assumption that the dividends would follow a random walk with a drift .
where is a white noise process. Substituting Equationequation (6)
(6)
(6) into Equationequation (2)
(2)
(2) , we get
The first term of the right side of Equationequation (7)(7)
(7) is constant, while the second term is a random walk based on Equationequation (6)
(6)
(6) . Thus, Equationequation (7)
(7)
(7) shows that the fundamental price of the commodity should follow a random walk, while Equationequation (5)
(5)
(5) shows that the price would become an explosive process when there is a bubble component
. For more details, please refer to the study of Blanchard and Watson (Citation1982), Gürkaynak (Citation2008) and Miao (Citation2014).
2.2. Nonlinear price transmission and asynchronous price bubbles
As mentioned above, the aggressive financialization of the commodity futures markets has long been considered to induce price bubbles (Basak & Pavlova, Citation2016; Master, Citation2008, Citation2009; Tang & Xiong, Citation2012). Too many speculators enter the futures market and take long positions of the futures contracts without considering the fundamental value of the underlying commodities, which may further distort the pricing signal and generate bubbles for futures prices. These studies focus on commodity futures markets and assume that the spot price will simply follow the futures price process.
Specifically, the fundamental values of commodity futures price in Equationequation (2)(2)
(2) and (Equation7
(7)
(7) ) follow a random walk process (integrated of order one, I(1)). When assuming no arbitrage condition between the futures and spot prices of the same commodity, the theory of storage, or the cost of carry theory indicates that (Yang et al., Citation2001, Citation2021)
where and
are the (log) futures and spot prices,
is the constant term which could reflects all kinds of storage costs including transportation, warehousing, and insurance costs, and
is the slope parameter.
is the residual part and becomes the error-correction term in the VECM representation when
and
are cointegrated with each other:
where is the first difference operator,
and
are the long-run adjustment parameters which control how quickly the
and
adapt to deviations from their long-run equilibrium relationship.
is the matrix of the short-run adjustment coefficients.
and
are white noise process.
Therefore, linear transmission between and
suggested by time-invariant
and
in Equationequation (8)
(8)
(8) , or
and
in Equationequation (9)
(9)
(9) means that the spot price
would follow the process of
tightly. This further implies bubble synchronization between the futures and spot prices.
However, the assumption of linear transmission has long been in doubt. For instance, the “rockets and feathers” pricing behaviour, i.e., prices rise like rockets but fall like feathers, has been confirmed for many markets (Bacon, Citation1991; Loy et al., Citation2015; Tappata, Citation2009). The direction (sign) of price changes could lead to various dynamic price reactions with respect to the speed of adjustment and the magnitude of the long-run price equilibrium. Thus, nonlinear price transmission would complicate the relationship between the futures and spot prices of the same commodity.
Previous studies on commodity price bubbles mainly focus on the futures price bubbles and explore the relationship between bubbles and speculation (Etienne et al., Citation2015, Citation2017; Mao et al., Citation2021; Sanders & Irwin, Citation2017). This ignores the performance of commodity spot markets. However, given the possible nonlinear transmission effect, bubbles may not synchronize between the futures and spot markets. Especially, the asymmetric transmission effect between the futures and spot prices may lead to bubbles in spot markets only. One possible case can be described by the following equation:
where the error correction term is split into three regimes by two thresholds
and
.
,
and
are dummy variables.
if
and zero otherwise;
if
and zero otherwise;
if
and zero otherwise. EquationEquation (10)
(10)
(10) is commonly used to capture the asymmetric cost pass-through effect measured by the difference between
than
, where
measures the adjustment speed of the spot price toward the long run equilibrium when the futures price increases, and
measures the adjustment speed of the spot price toward the long run equilibrium when the futures price decreases (Loy et al., Citation2015, Citation2016; Tappata, Citation2009).
If the future price reflects the fundamental value of the underlying commodity and follows a random walk as in Equationequation (2)(2)
(2) and (Equation7
(7)
(7) ), the spot price may deviate from a random walk and experience bubbles due to the asymmetric transmission effect. Higher absolute value of
than
means that the spot price would adjust faster when the futures price rises compared with when it falls. This may suggest more bubbles for the spot price, because the growth of the spot price tends to last longer and deviates from the fundamental value of the underlying commodity.
From the estimates of nonlinear price transmission effects and the theory of “conjectural variations”, researchers often make inferences to the existence of market power or speculative storage controlled by some market participants (such as retailers, wholesalers or producers) (Assefa et al., Citation2017; Loy et al., Citation2018; Nakamura & Zerom, Citation2010; Sexton, Citation2013; Sexton & Zhang, Citation2001; Verreth et al., Citation2015). Specifically, focusing on the German pork supply chain with farmers, slaughterhouse, and retailers, Assefa et al. (Citation2017) find that when reacting to export prices derived from competitive markets, the market power of domestic slaughterhouse would enable themselves to increase domestic pork prices when competitive export prices increase, but avoid a large domestic price drop in times of low export prices.
This same logic could also be applied to the relationship between the futures price and local spot prices in the corn and soybeans markets in China. The futures price emerges from bidding by all kinds of traders nationwide. When there are no price bubbles, the futures price can be considered as an competitive external price for any local spot markets. Given that the inventory of corn and soybeans is to a large extent under the control of local state-owned companies (SOCs) in China (Gale, Citation2013), these local SOCs may have certain market power over the supply chain and affect the timely and effective adjustment of spot prices to the future price. This may further lead to temporary deviations of the spot prices from the long run equilibrium and make room for bubble occurrences.
3. Methodology
3.1. Bubble testing method
The definition of price bubbles above provides the basis for the right-tailed unit root test to identify bubbles. Phillips et al. (Citation2012, Citation2015). develop the Generalized Supremum-ADF (GSADF) test to date-stamp price bubbles, which has been widely accepted to detect price bubbles in various markets (Caspi & Graham, Citation2018; Engsted et al., Citation2016; Etienne et al., Citation2015; Tsvetanov et al., Citation2016). Compared with other bubble testing methods (such as the sequential Chow-test and CUSUM test), the advantages of the GSADF method are that it can identify the points of origination and termination of a bubble. Moreover, it works satisfactorily for price series with structural breaks and will not suffer from reduced power when detecting the periodically collapsing bubbles (Harvey et al., Citation2016; Homm & Breitung, Citation2012; Mao et al., Citation2021).
According to Phillips et al. (Citation2015), the GSADF test applies the ADF-test to sequential subsets (rolling windows) of the entire sample. Suppose that the rolling window runs from the fraction of the total sample (
) to the
fraction, where
and
is the fractional window size of the regression. EquationEquation (8)
(8)
(8) shows the empirical model:
where is the price series and k is the lag length. The ADF-statistic value based on this regression is denoted as
. The GSADF relies on the repeated estimation of the ADF test on the subsamples of price data. It varies the endpoint of the ADF regression
from
(the minimum window width) to 1, and it allows the starting point
to change within a feasible range, that is, from 0 to
. The GSADF-test statistic of
is then obtained as the supreme value of the corresponding ADF-statistic sequence (see EquationEquation (9)
(9)
(9) ).
The number of observations in the model is , where
is the floor function (given the integer part of the argument). The origination date of a bubble
is calculated as the first chronological observation with a GSADF-statistic above the critical value. The calculated origination date is denoted by
. The estimated termination date of a bubble
is the first chronological observation after
with a GSADF-statistic below the critical value. The bubble duration must exceed the length of
. This requirement helps to exclude short lived blips in the fitted autoregressive coefficient (Phillips et al., Citation2012). For the sample under study, we calculate
. Thus, the bubble duration should at least be 3 weeks. Gutierrez (Citation2013) and Harvey et al. (Citation2016) suggest to use the wild bootstrap method to calculate the critical values, which will consider the underlying structural break of the time series. The number of iterations of wild bootstrapping in this paper is set at 2000.
3.2. Unit root tests based on Momentum-Threshold Autoregressive Model (M-TAR)
In order to test the asymmetric adjustment effects for individual price series, we adopt the unit root tests based on Momentum-Threshold Autoregressive Model (M-TAR). According to the work of Enders and Granger (Citation1998), the model is listed as follows:
where,
As explained by Enders and Granger (Citation1998), if , the M-TAR model exhibits little decay for positive price returns (
) but substantial decay for negative price returns (
). Namely, for
, it means that price increases tend to persist but decreases tend to revert quickly toward the long run equilibrium. The opposite results appear when
.
3.3. Time-varying partially cointegrated Vector Error-Correction Model (TV-PC-VECM)
To account for possible time-varying basis between the future and spot prices (such as time-varying transportation and storage costs), we test whether there is a partial cointegration relationship between the futures price and spot price
(Clegg & Krauss, Citation2018):
where the vector [1, ] represents the partial cointegration relationship, similar to the standard cointegration. However, the residual part
contains a permanent part
and a transient part
. Compared with the constant term
in Equationequation (8)
(8)
(8) , the permanent part
follows a random walk and denotes the time-varying basis between the futures and spot prices. It may include time-varying transportation, warehousing and insurance costs. The transient part
follows a stationary autoregressive process of order 1 (AR(1) process) with coefficient
. The innovations
and
are assumed to be independent of each other and follow normally distributed white noise processes.
Clegg and Krauss (Citation2018) develop a two-step likelihood ratio test procedure for this partial cointegration relationship. The first step is to test whether follows a pure random walk (null hypothesis
: no cointegration). If the null hypothesis
is rejected, we find either a standard cointegration relationship (if
follows a pure AR(1) process) or a partial cointegration relationship (if
follows a partial AR(1) process). The second step tests whether
follows a pure AR(1) process (the null hypothesis
). If
and
are both rejected, there would be a partial cointegration relationship.
If and
are found to be partially cointegrated, we use the time-varying VECM model developed by Vollmer et al. (Citation2020) to rewrite Equationequation (9)
(9)
(9) :
Since , the error correction term of the model only contains the transient part
. The Akaike Information Criterion (AIC) is used to determine the lag length
.
To obtain time-varying estimates of the parameters, we transform Equationequation (19)(19)
(19) into the state-space form:
Observation equation:
State equation:
where is the left-hand side vector of price changes in Equationequation (19)
(19)
(19) ;
arrays the right-hand side variables of the VECM equations in block diagonal form;
is the identity matrix of dimension
, which corresponds to the column dimension of
and the row dimension of
.
and
are serially uncorrelated error terms with zero mean and covariance matrices
and
. Applying the Kalman filter produces optimal estimates of the state variables
at each time t (Adämmer & Bohl, Citation2018).
Specifically, the state variables contain both the estimated long run adjustment parameters
and short run adjustment parameters
at each time t. These time-varying parameters together reflects the interaction mode between the futures and spot prices for each commodity at time t. This enables us to measure the nonlinear transmission effect between the futures and spot prices in a more flexible way.
Moreover, we could use the logit model to account for the possible effects of various variables on price bubbles. Apart from the speculation intensity in the futures market, the time-varying adjustment parameters and
can further be introduced to the logit model to directly measure the effect of nonlinear transmission on bubbles,
where is a dummy variable and equals one if there is a spot price bubble at time t,
is the ratio between trade volume and open interest of the corresponding futures contract at time t and measures the speculative intensity in the futures market (Wellenreuther & Voelzke, Citation2019; Yang et al., Citation2021).
is the trade volume of the futures contract and measures the market liquidity at time t.
is the long run adjustment parameter for the spot price; while
and
are the short run adjustment parameters for the spot price.
,
and
together reflect the adjustment process of the spot price toward the long run equilibrium with the futures price.
For better understanding the nonlinear transmission effects on the spot price, we further calculate the orthogonal impulse response function (OIRF). Intuitively, the OIRF indicator reflects the response of one price series to the orthogonal shocks from its own or another price series. Due to that the adjustment parameters and
are time-varying, the OIRF value we estimate is also different at each time t. We replace the adjustment parameters (
,
, and
,) in the logit model with the OIRF to measure the direct response of the spot price to the orthogonal shocks from its own changes and the futures price. Compared with the time-varying long run and short run parameters, the OIRF could give a more intuitive way to measure the interaction mode between the futures and spot prices. Substitute the OIRF into the logit model, we get
where represents the response of the spot price to its orthogonal futures price shocks at time t, and
represents the response of the spot price to its own price shocks at time t. A significant and positive
suggests that price bubbles are more likely to occur when the response of the spot price to future price shocks is larger, while a significant and positive
implies that price bubbles are more likely occur when the response of the spot price to its own shocks is larger.
4. Data
The present paper concentrates on price bubbles of corn and soybeans markets in China. The rising food production and consumption from China have profound effects on the world food balance and trade patterns and are often taken as the main source of global commodity price spikes. It is important for China to maintain its food safety and stable agricultural markets.
We collect weekly price data on Mondays from two datasets. The sample period starts 4 January 2009 and ends 31 December 2017, including 460 observations. We first obtain the “National Wholesale Price Index” of each commodity as the spot price. By wholesale prices, we mean the price charged by wholesalers to the downstream manufactures or processors. The “National Wholesale Price Index” is compiled by the China Grain Reserves Group, Ltd., which collects the price data of agricultural commodities from major local markets nationwide.
Futures prices come from the Dalian Commodity Exchange (DCE).Footnote1 We use (rolling) nearby futures contract prices. Each commodity has six futures contracts every year, namely the contracts starting in January, March, May, July, September and November. Each futures contract lasts for 12 months, not including the delivery month. The price data of the last two months for each contract are used to build the nearby futures price.Footnote2 We use the logarithmic transformation of all prices, unless otherwise specified.
5. Results
5.1. Bubble testing results
presents the descriptive statistics of price returns (). The futures price returns exhibit lower mean value (though not significant) than that of spot price returns. The median value is significantly lower for corn futures price returns, whereas it is higher for soybeans futures price returns. The comparison of the maximum (minimum) values and standard deviations suggest that the futures price returns have a larger range (absolute value, |max-min|) than spot prices. The results of the skewness and the Jarque-Bera test further show that price returns do not follow a normal distribution.
Table 1. Summary statistics for daily price returns ().
We use the GSADF method to detect bubbles in each price series. The futures and spot prices indicate asynchronous bubbles shown in and . Regardless of the commodity species, spot prices have more frequent and durable bubbles than futures prices. For corn, 73 of 460 weeks (15.87 %) indicate bubble periods for spot prices, while only 7 of 460 weeks (1.52 %) show bubble periods for futures prices. The spot price has seven bubble episodes, while the corn future price shows two short bubble episodes and only one of them synchronizes with the spot price bubbles. In the case of soybeans, 54 of 460 weeks (11.73 %) show bubble periods for spot prices, while only 10 of 460 weeks (2.17 %) for future prices. The spot price of soybeans shows nine bubble episodes, while its futures price has three bubble episodes. Again, we find only one synchronous bubble episode for soybeans. Fewer and shorter bubbles for the futures prices suggest that compared with the spot markets, the futures markets timely and efficiently incorporate all the relevant market information into the futures price signals and reflect the fundamental value of the commodity.
Figure 1. Corn: price bubble periods for the futures and spot prices.
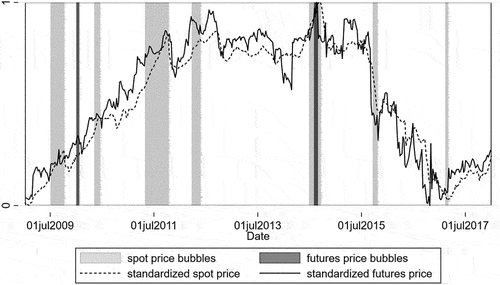
Figure 2. Soybeans: price bubble periods for the futures and spot Prices3
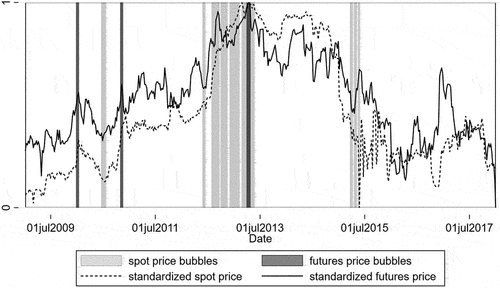
We apply another measure to quantify the degree of bubble synchronization across two price series. When estimating the degree of price synchronization and staggering among different prices, prior studies would compare the standard deviations of the actual proportion of price changes in each period with the standard deviations of perfect price synchronization or staggering (Fisher & Konieczny, Citation2000). Similarly, if the bubble periods for futures and spot prices are perfectly staggered, the proportion of bubble occurrences in any period would be equal to the average proportion of bubble periods over time. However, if the bubbles are perfectly synchronized, the proportion of bubbles in any period would be either 0 or 1. For instance, the number of corn (futures and spot) price bubbles is 76 out of 460 observations. In this case, assuming perfect synchronization, the standard deviation is computed from a series of 76 ones and 384 zeros. shows the main result of the standard deviations for these two cases. The final row of differences from perfect staggering indicates the extent of deviation from perfect staggering. When this term is below 50 %, the actual data are closer to the perfect staggering situation.Footnote4
Table 2. Comparing standard deviations of different cases.
In , even though most observations indicate no bubble periods (384 weeks, 83.5 % of the sample observations) for corn futures and spot prices, we find that the deviation from perfect staggering is below 50 %. The same applies to the case of soybeans. Bubbles for the futures and spot prices are hardly synchronized. Considering that spot prices have more frequent and persistent bubbles, this result is consistent with the evidence that cointegrated prices may show asynchronous bubble periods (Alexakis et al., Citation2017; Esposti & Listorti, Citation2013).
5.2. Nonlinear price transmission and bubbles
5.2.1. Asymmetric transmission effect within and between price series
We start with conventional tests on the concerned price series. The results of normal ADF-test and KPSS-test indicate that the price series are integrated of order one I(1) and become stationary after first differencing (see in the Appendix). Moreover, through the conventional cointegration and Granger-causality tests. The futures and spot prices are cointegrated for both commodities, indicating a long-run equilibrium relationship. The Granger-causality tests only find that the lagged values of futures price returns predict spot price returns (see in the Appendix). Based on these conventional tests, the futures market first discovers prices and then transmits the signals to the spot market.
However, these results cannot explain why there are more frequent bubbles for spot prices. Ghoshray (Citation2018) and Enders and Granger (Citation1998) point out that the standard ADF test assumes symmetric adjustments and cannot identify asymmetric features within time series data. They suggest using the unit root test based on the Momentum-Threshold Autoregressive Model (M-TAR) to measure the asymmetric adjustments for individual price series. Our results of M-TAR based unit root test are listed in . Based on the results of F-test, all price return series are stationary and the values of and
are all significantly different from zero.Footnote5 For the futures price returns of corn and soybeans (the first and third column in ), it shows that
, which means that price decreases would persist but price increases would revert quickly toward the long run equilibrium; while for the spot price returns (the second and fourth column in ), the result
means that price increases would persist but price decreases would revert quickly toward the long run equilibrium. Thus, we find asymmetric adjustment effects both for the futures and spot prices, but in different directions. The longer lasting upward movement of the spot prices may have resulted in more spot price bubbles for corn and soybeans.
Table 3. TAR based unit root test.
Moreover, through threshold estimation on Equationequation (10)(10)
(10) , we measure the asymmetric transmission effect between the futures and spot prices, based on the values of the long run adjustment parameters
at different intervals. The results are presented in . For both commodities, the absolute values of
are higher than those of
, implying that the spot price of either commodity adjusts faster when its futures price increases compare with the time when the futures price falls.
Table 4. Threshold VECM model.
Combining with the results from the M-TAR based unit root tests, the upward movement of the spot price tends to adjust faster and last longer, compared with its downward movement. If the futures price reflects the fundamental value of the underlying commodity and follows a random walk process, the asymmetric transmission effect suggests that the spot price would deviate from the futures price. This may further lead to asynchronous bubbles between them.
5.2.2. Time-varying price transmission and bubbles
Results from previous sections suggest a possible link between the more frequent bubbles for commodity spot prices and the asymmetric transmission effect (within and between price series). To test whether the nonlinear transmission effect directly relates with spot price bubbles, we continue to adopt the TV-PC-VECM model to derive the time-varying adjustment parameters and orthogonal impulse response functions (OIRF), and use the logit model to estimate the interaction mode between the futures and spot prices during the bubble periods.
We first implement the partial cointegration test on the futures and spot prices for each commodity. Based on the results listed in panel A of and , there is no partial cointegration relationship between the futures and spot prices. Thus, the permanent part between the futures and spot prices in Equationequation (15)
(15)
(15) tends to remain constant over time. This indicates that the deviations of the spot price from the long run equilibrium are unlikely to be explained by time-varying storage or transportation costs. Meanwhile, since there is no partial cointegration relationship, the
term in the TV-PC-VECM model of Equationequation (19)
(19)
(19) and (Equation20
(20)
(20) ) will become the normal error-correction term
of the VECM model.
Table 5. TV-PC-VECM model for corn.
Table 6. TV-PC-VECM model for soybeans.
Still, combining the VECM model of Equationequation (9)(9)
(9) with the state space method in equation (21), we can derive the time-varying adjustment parameters
and
. Specifically, the time-varying adjustment parameters
,
,
,
, and
for the spot prices are presented in and .Footnote6 These time-varying parameters together reflect the dynamic interaction process between the futures and spot prices. For instance, the time-varying values of
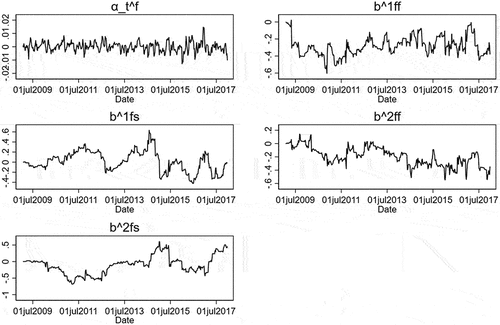
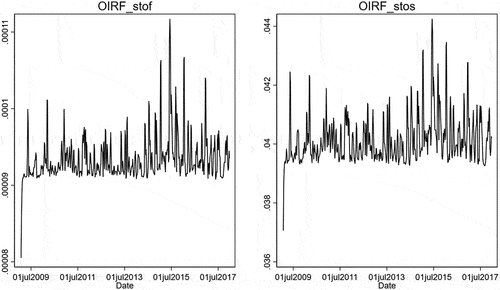
in the first graph of and indicate unsteady movement of the spot price toward the long run equilibrium. For better and intuitive understanding the response of the spot price to its own and futures price shocks, we calculate the OIRF for each time point t, see and . “OIRF_stof” refers to the response of the spot price to the futures price shocks and “OIRF_stos” refers to the response of the spot price to its own price shocks. Comparing the values between the “OIRF_stof” and “OIRF_stos”, we can easily see that the response of the spot price to its own shocks are always larger than that to its futures price shocks.
Figure 3. Corn: time-varying long run and short run adjustment parameters for the spot price.
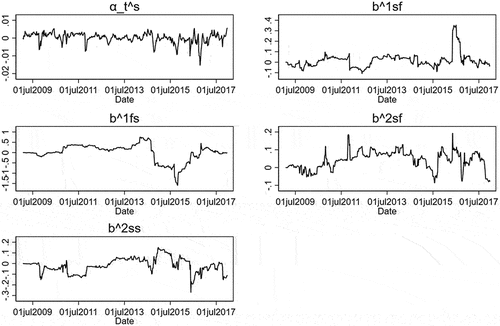
Figure 4. Soybeans: time-varying long run and short run adjustment parameters for the spot price.
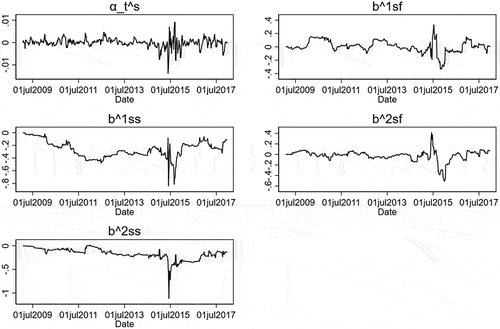
Figure 5. Corn: time-varying OIRF.
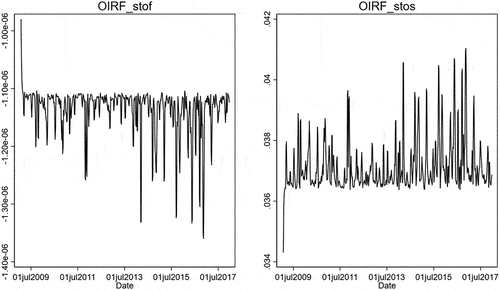
Figure 6. Soybeans: time-varying OIRF.
With these time-varying parameters, we first use the logit model to test whether the nonlinear transmission effect directly relates with the spot price bubbles. The results of the logit model are presented in panel B of and . We first find no effects of the speculation on the spot price bubbles for both commodities and higher liquidity tends to reduce price bubbles for corn. This is consistent with the evidence from experimental economics which shows that futures markets dampen, though do not eliminate price bubbles (Porter & Smith, Citation2003).
Meanwhile, the effects of these time-varying parameters are significant, but difficult to interpret. For corn, the long run adjustment parameter has a significant positive effect on its spot price bubbles, while the
for soybeans has no significant effects. The short run adjustment parameters
,
,
, and
show more complicated effects for both commodities. Thus, we replace these parameters with the OIRF, which is a more intuitive indicator of the nonlinear effects.
For corn, the results in the second and fourth column of panel B in show that the OIRF caused by futures price shocks has no significant effects on the spot price bubbles, while the OIRF caused by spot price own shocks has significant positive effects on bubbles. This suggests that the (orthogonal) futures price shocks at least don’t contribute to spot price bubbles. In other words, futures price increases alone cannot lead to more spot price bubbles, while higher response of the spot price to its own shocks contributes to more spot price bubbles. Moreover, previous results from the M-TAR based unit root tests and the threshold VECM model indicate that the spot price increases tend to adjust faster and last longer when the future price increases. Our results based on the logit model further prove the nonlinear adjustment effect is significant in explaining the origin of spot price bubbles. Thus, the spot price fails to follow with the futures price tightly. Once a upward trend or momentum is established for the spot price, it is more likely to continue in that direction than to move against the trend.
For soybeans, we find almost the same results as corn, except that the coefficients of the OIRF caused by spot price own shocks are positive, but it is only very close to the 10% significance level. Future study using more detailed or disaggregated price data may be needed to identify and analyze the reasons for soybeans price bubbles.
These results above indicate that the adjustment effect of spot prices toward the long-run equilibrium becomes weak when spot price bubbles occur. Spot prices can hardly adjust to a new market clearing price level when responding to future price changes. Our results are also consistent with previous studies, which prove a difference between the commodity spot and futures markets in the ability to incorporate relevant price information (Crain & Lee, Citation1996; Yang et al., Citation2001). The self-persistence of price returns during price increasing processes may contribute to more spot price bubbles.
Moreover, from the estimates of nonlinear price transmission effects, researchers often make inferences as to the existence of market power or speculative storage controlled by some market participants (such as retailers, wholesalers or producers) (Loy et al., Citation2018; Nakamura & Zerom, Citation2010; von Cramon-Taubadel & Goodwin, Citation2021).Footnote7 Storage by speculators can be expected to move commodity from periods of low prices to periods of high prices, thus inducing autocorrelation and asymmetry momentum of price adjustments (Deaton, Citation1999; Deaton & Laroque, Citation1996), which is consistent with our results from the M-TAR based unit root tests and threshold VECM model.
In addition, prices tend to be higher in less competitive markets and market participants with market power could keep “price going up but not coming down” (Assefa et al., Citation2017; Benzarti et al., Citation2020). Given that the inventory of corn and soybeans is to a large extent under the control of state-owned companies (SOCs) in China (Gale, Citation2013), these SOCs have a significant market power over the supply chain and could affect the timely and effective adjustment of agricultural spot prices. Though these SOCs are built to stabilize the agricultural markets, they also assume sole responsibility for their own profits or losses. It is plausible that these SOCs with significant market power may “ride the bubbles” temporarily to gain more profits. In this case, spot price bubbles cannot be fully arbitraged away in a short time (Wang & Tomek, Citation2007). Similar phenomenon of “riding the bubbles” has also been proved in the equity market (Temin & Voth, Citation2004). Compared with previous research merely focusing on the destabilizing effects of futures institutional investors, our estimation results suggest that agricultural price bubbles may also easily occur in a market where some market participants hold significant market power.
6. Conclusions
Previous studies on agricultural price bubbles have mostly ignored spot markets and agricultural futures markets have been blamed for their potentially negative effects of over-financialization. Our study aims to identify and analyze the price bubbles in agricultural commodity markets, highlighting the nonlinear transmission across futures and spot markets.
We first identify the bubble dates for the two highly traded agricultural commodities in China, corn and soybeans. Limited synchronization of bubbles across the agricultural futures and spot markets is found, and the spot price series shows more frequent and durable bubbles than the futures prices. This may imply that commodity futures markets provide a more effective price signal for traders. We use the M-TAR based unit root tests and threshold VECM model to capture the nonlinear (asymmetric) price transmission within and across the futures and spot markets. The spot price indicates a strong self-persistence of its upward process. Meanwhile, we find a significant asymmetric transmission effect between the futures and spot prices. Thus, the spot price adjusts faster to its future price increases than decreases. A quick and lasting response of the spot price to the futures and its own price increases may have resulted in more bubbles for the spot market.
We further test whether the nonlinear transmission effect directly relates with more spot price bubbles through the Time-varying Partially Cointegrated VECM model and the logit model. The time-varying (long run and short run) adjustment parameters and OIRF values estimated from the Time-varying Partially Cointegrated VECM model are used to capture the dynamic interaction mode between the futures and spot prices at each period. The results of the logit model show that these time-varying indicators have significant effects on spot price bubbles, and higher response of the spot price to its own price shocks contributes to more bubbles. Thus, consistent with the results from the M-TAR based unit root tests and the threshold VECM model, spot price bubbles are more likely to occur when the spot price adjusts quickly to its futures price and keeps this upward trend longer. Futures price increases alone cannot lead to more spot price bubbles.
Above all, though there is a cointegration relationship between the futures and spot prices, bubbles occur more frequently for the spot price series, which shows higher self-persistence of increasing returns during the upward trend. This further implies poor ability of the spot market to adjust itself to a new equilibrium. Speculative storage and imperfectly competitive (spot) market structure may account for this slow and asymmetric price adjustments and more spot price bubbles. Moreover, our conclusion is limited due to that we only have aggregated price series for spot prices and infer the existence of the market power based on the nonlinear transmission effect. Future study using disaggregated spot price data or better measures on the market power of agricultural market participants could give a more intuitive explanation on the relationship among the nonlinear transmission effect, price bubbles and market power.
Disclosure statement
No potential conflict of interest was reported by the author(s).
Additional information
Funding
Notes on contributors
Qianqian Mao
Qianqian Mao, PhD, Assistant Professor at School of Economics, Zhejiang University of Technology (China). His email is [email protected]. His research topics cover agricultural market analysis (price transmission, market power and market integration), futures markets, time series analysis, and behavioral economics.
Yanjun Ren
Yanjun Ren, PhD, Full Professor in Agricultural and Food Economics at Northwest A&F University (China). His research topics cover food (nutrition) economics, agricultural economics, causal inference, and behavioral economics.
Jens-Peter Loy
Jens-Peter Loy, PhD, correspondent author. Full Professor at Department of Agricultural Economics, Kiel University (Germany). His email is [email protected]. His research interests cover marketing, pricing and policy issues on markets along the agricultural and food value chain with a focus on retail markets. Some recent topics are vertical price transmission, the measurement of market power in the food industry, price setting in the food retail sector and economic experiments for auctions, and prediction markets.
Notes
1 We collect the “National Wholesale Price Index” and the futures price data from the Wind commercial database (https://www.wind.com.cn/).
2 Since we use the wild bootstrap method to calculate the critical values for GSADF method, the breaks generated by rolling the nearby futures contracts would not affect our bubble testing results. Similarly, the partial cointegration test we use allows for structural breaks within the cointegration relationship.
3 There are two reasons why we don’t consider the multiple bubbles in a row between 2013 and 2015 as a single price bubble. The first reason is that we use weekly price data for the futures and spot prices. The time length is relatively long between each observations. Taking the multiple bubbles in a row between 2013 and 2015 as a single price bubble would suggest that the bubbles could last a year long. This is unrealistic in real markets. The second reason is that we use the Time-varying Partially Cointegrated VECM model to measure the nonlinear effect at each time point. Thus, we need to identify the bubble periods accurately, otherwise, it may affect our estimation results in the following sections. We thank the referee for pointing out this problem.
4 When more individual price series are available, a formal test could be used to judge the significance level of the deviation from perfect staggering formally.
5 The critical values of F-test are obtained from Enders and Granger (Citation1998) and they were found to have better power than the T-test statistics. Thus, based on the F-test, the values of and
in are all significantly different from zero.
6 The lag length of the short run adjustment parameters k = 2 is determined by AIC. The time-varying adjustment parameters ,
,
,
, and
for the futures prices are presented in in the Appendix.
7 See the literature review on price transmission by von Cramon-Taubadel and Goodwin (Citation2021).
References
- Adämmer, P., & Bohl, M. T. (2015). Speculative bubbles in agricultural prices. The Quarterly Review of Economics & Finance, 55(2015), 67–27. https://doi.org/10.1016/j.qref.2014.06.003
- Adämmer, P., & Bohl, M. T. (2018). Price discovery dynamics in European agricultural markets. Journal of Futures Markets, 38(5), 549–562. https://doi.org/10.1002/fut.21891
- Alexakis, C., Bagnarosa, G., & Dowling, M. (2017). Do cointegrated commodities bubble together? The case of hog, corn, and soybean. Finance Research Letters, 23, 96–102. https://doi.org/10.1016/j.frl.2017.02.007
- Assefa, T. T., Meuwissen, M. P. M., Gardebroek, C., & Oude Lansink, A. G. J. M. (2017). Price and volatility transmission and market power in the German Fresh Pork supply chain. Journal of Agricultural Economics, 68(3), 861–880. https://doi.org/10.1111/1477-9552.12220
- Azzam, A. M. (1999). Asymmetry and rigidity in farm-retail price transmission. American Journal of Agricultural Economics, 81(3), 525–533. https://doi.org/10.2307/1244012
- Bachmeier, L. J., & Griffin, J. M. (2003). New evidence on asymmetric gasoline price responses. The Review of Economics and Statistics, 85(3), 772–776. https://doi.org/10.1162/003465303322369902
- Bacon, R. W. (1991). Rockets and feathers: The asymmetric speed of adjustment of UK retail gasoline prices to cost changes. Energy Economics, 13(3), 211–218. https://doi.org/10.1016/0140-9883(91)90022-R
- Basak, S., & Pavlova, A. (2016). A model of financialization of commodities. The Journal of Finance, 71(4), 1511–1556. https://doi.org/10.1111/jofi.12408
- Benzarti, Y., Carloni, D., Harju, J., & Kosonen, T. (2020). What goes up may not come down: Asymmetric incidence of value-added taxes. Journal of Political Economy, 128(12), 4438–4474. https://doi.org/10.1086/710558
- Blanchard, O. J., & Watson, M. W. (1982). Bubbles, rational expectations and financial markets (Working Paper 945). National Bureau of Economic Research. https://doi.org/10.3386/w0945
- Bohl, M. T., Branger, N., & Trede, M. (2021). Measurement errors in index trader positions data: Is the price pressure hypothesis still invalid? Applied Economic Perspectives and Policy, 44(3), 1534–1553. https://doi.org/10.1002/aepp.13186
- Boyd, N. E., Harris, J. H., & Li, B. (2018). An update on speculation and financialization in commodity markets. Journal of Commodity Markets, 10, 91–104. https://doi.org/10.1016/j.jcomm.2018.05.005
- Caspi, I., & Graham, M. (2018). Testing for bubbles in stock markets with irregular dividend distribution. Finance Research Letters, 26, 89–94. https://doi.org/10.1016/j.frl.2017.12.015
- Clegg, M., & Krauss, C. (2018). Pairs trading with partial cointegration. Quantitative Finance, 18(1), 121–138. https://doi.org/10.1080/14697688.2017.1370122
- Crain, S. J., & Lee, J. H. (1996). Volatility in wheat spot and futures markets, 1950–1993: Government farm programs, seasonality, and causality. The Journal of Finance, 51(1), 325–343. https://doi.org/10.1111/j.1540-6261.1996.tb05211.x
- Deaton, A. (1999). Commodity prices and growth in Africa. Journal of Economic Perspectives, 13(3), 23–40. https://doi.org/10.1257/jep.13.3.23
- Deaton, A., & Laroque, G. (1996). Competitive storage and commodity price dynamics. Journal of Political Economy, 104(5), 896–923. https://doi.org/10.1086/262046
- Enders, W., & Granger, C. W. J. (1998). Unit-root tests and asymmetric adjustment with an example using the term structure of interest rates. Journal of Business & Economic Statistics, 16(3), 304–311. https://doi.org/10.1080/07350015.1998.10524769
- Engle, R. F., & Granger, C. W. J. (1987). Co-integration and error correction: Representation, estimation, and testing. Econometrica, 55(2), 251–276. JSTOR. https://doi.org/10.2307/1913236
- Engsted, T. (2006). Explosive bubbles in the cointegrated VAR model. Finance Research Letters, 3(2), 154–162. https://doi.org/10.1016/j.frl.2006.03.004
- Engsted, T., Hviid, S. J., & Pedersen, T. Q. (2016). Explosive bubbles in house prices? Evidence from the OECD countries. Journal of International Financial Markets, Institutions and Money, 40, 14–25. https://doi.org/10.1016/j.intfin.2015.07.006
- Esposti, R., & Listorti, G. (2013). Agricultural price transmission across space and commodities during price bubbles. Agricultural Economics, 44(1), 125–139. https://doi.org/10.1111/j.1574-0862.2012.00636.x
- Etienne, X. L., Irwin, S. H., & Garcia, P. (2015). Price explosiveness, speculation, and grain futures prices. American Journal of Agricultural Economics, 97(1), 65–87. https://doi.org/10.1093/ajae/aau069
- Etienne, X. L., Irwin, S. H., & Garcia, P. (2017). New evidence that index traders did not drive bubbles in grain futures markets. Journal of Agricultural and Resource Economics, 1(23), 45–67. https://doi.org/10.22004/ag.econ.252754
- Fan, C. S., & Wei, X. (2006). The law of one price: Evidence from the transitional economy of China. The Review of Economics and Statistics, 88(4), 682–697. https://doi.org/10.1162/rest.88.4.682
- Fisher, T. C. G., & Konieczny, J. D. (2000). Synchronization of price changes by multiproduct firms: Evidence from Canadian newspaper prices. Economics Letters, 68(3), 271–277. https://doi.org/10.1016/S0165-1765(00)00231-7
- Gale, F. (2013). Growth and evolution in China’s agricultural support policies (Economic Research Report 153). United States Department of Agriculture.
- Garbade, K. D., & Silber, W. L. (1983). Price movements and price discovery in futures and cash markets. The Review of Economics and Statistics, 65(2), 289–297. https://doi.org/10.2307/1924495
- Ghoshray, A. (2018). Are shocks transitory or permanent? An inquiry into agricultural commodity prices. Journal of Agricultural Economics, 70(1), 26–43. https://doi.org/10.1111/1477-9552.12277
- Gürkaynak, R. S. (2008). Econometric tests of asset price bubbles: Taking stock*. Journal of Economic Surveys, 22(1), 166–186. https://doi.org/10.1111/j.1467-6419.2007.00530.x
- Gutierrez, L. (2013). Speculative bubbles in agricultural commodity markets. European Review of Agricultural Economics, 40(2), 217–238. https://doi.org/10.1093/erae/jbs017
- Harvey, D. I., Leybourne, S. J., Sollis, R., & Taylor, A. M. R. (2016). Tests for explosive financial bubbles in the presence of non-stationary volatility. Journal of Empirical Finance, 38, 548–574. https://doi.org/10.1016/j.jempfin.2015.09.002
- Hernandez, M. A., & Torero, M. (2010). Examining the dynamic relation between spot and futures prices of agricultural commodities. FAO Commodity Market Review, No.2009/2010, 47–86.
- Homm, U., & Breitung, J. (2012). Testing for speculative bubbles in stock markets: A comparison of alternative methods. Journal of Financial Econometrics, 10(1), 198–231. https://doi.org/10.1093/jjfinec/nbr009
- Irwin, S. H., & Sanders, D. R. (2012). Testing the masters hypothesis in commodity futures markets. Energy Economics, 34(1), 256–269. https://doi.org/10.1016/j.eneco.2011.10.008
- Li, M., & Xiong, T. (2019). Do bubbles alter contributions to price discovery? Evidence from the Chinese Soybean Futures and spot markets. Emerging Markets Finance & Trade, 55(15), 3417–3432. https://doi.org/10.1080/1540496X.2019.1608178
- Loy, J.-P., Holm, T., Steinhagen, C., & Glauben, T. (2015). Cost pass-through in differentiated product markets: A disaggregated study for milk and butter. European Review of Agricultural Economics, 42(3), 441–471. https://doi.org/10.1093/erae/jbu031
- Loy, J.-P., Steinhagen, C., Weiss, C., & Koch, B. (2018). Price transmission and local market power: Empirical evidence from the Austrian gasoline market. Applied Economics, 50(53), 5728–5746. https://doi.org/10.1080/00036846.2018.1488063
- Loy, J.-P., & Weiss, C. (2002). Staggering and synchronisation of prices in a low-inflation environment: Evidence from German food stores. Agribusiness, 18(4), 437–457. https://doi.org/10.1002/agr.10032
- Loy, J.-P., Weiss, C. R., & Glauben, T. (2016). Asymmetric cost pass-through? Empirical evidence on the role of market power, search and menu costs. Journal of Economic Behavior and Organization, 123, 184–192. https://doi.org/10.1016/j.jebo.2016.01.007
- Magdalinos, T., & Phillips, P. C. B. (2009). Limit Theory for Cointegrated Systems with Moderately Integrated and Moderately Explosive Regressors. Econometric Theory, 25(2), 482–526. https://doi.org/10.1017/S0266466608090154
- Mao, Q., Ren, Y., & Loy, J.-P. (2020). Price bubbles in agricultural commodity markets and contributing factors: Evidence for corn and soybeans in China. China Agricultural Economic Review, 13(1), 22–53. https://doi.org/10.1108/CAER-10-2019-0190
- Mao, Q., Ren, Y., & Loy, J.-P. (2021). Price bubbles in agricultural commodity markets and contributing factors: Evidence for corn and soybeans in China. China Agricultural Economic Review, 13(1), 22–53. https://doi.org/10.1108/CAER-10-2019-0190
- Master, M. W. (2008). Testimony Before the Committee on Homeland Security and Governmental Affairs. www.hsgac.senate.gov/public/_files/052008Masters.pdf
- Master, M. W. (2009). Testimony Before the Commodities Futures Trading Commission. http://www.cftc.gov/ucm/groups/public/@newsroom/documents/file/hearing080509_masters.pdf
- Mattos, F., & Garcia, P. (2004). Price discovery in thinly traded markets: Cash and futures relationships in Brazilian agricultural futures markets (19019; 2004 Conference, April 19-20, 2004, St. Louis, Missouri). NCR-134 Conference on Applied Commodity Price Analysis, Forecasting, and Market Risk Management. https://ideas.repec.org/p/ags/ncrfou/19019.html
- Miao, J. (2014). Introduction to economic theory of bubbles. Journal of Mathematical Economics, 53, 130–136. https://doi.org/10.1016/j.jmateco.2014.06.002
- Nakamura, E., & Zerom, D. (2010). Accounting for incomplete pass-through. The Review of Economic Studies, 77(3), 1192–1230. https://doi.org/10.1111/j.1467-937X.2009.589.x
- Newey, W. K., & West, K. D. (1994). Automatic lag selection in covariance matrix estimation. The Review of Economic Studies, 61(4), 631–653. https://doi.org/10.2307/2297912
- Nielsen, B. (2010). Analysis of Coexplosive Processes. Econometric Theory, 26(3), 882–915. https://doi.org/10.1017/S0266466609990144
- Phillips, P. C. B., Shi, S., & Yu, J. (2012). Testing for multiple bubbles (SSRN Scholarly Paper ID 1981976). Social Science Research Network. https://papers.ssrn.com/abstract=1981976
- Phillips, P. C. B., Shi, S., & Yu, J. (2015). Testing for multiple bubbles: Historical episodes of exuberance and collapse in the S&p 500. International Economic Review, 56(4), 1043–1078. https://doi.org/10.1111/iere.12132
- Pindyck, R. S. (1992). The present value model of rational commodity pricing (Working Paper 4083). National Bureau of Economic Research. https://doi.org/10.3386/w4083
- Pindyck, R. S. (2001). The dynamics of commodity spot and futures markets: A primer. The Energy Journal, 22(3), 1–29. https://doi.org/10.5547/ISSN0195-6574-EJ-Vol22-No3-1
- Porter, D. P., & Smith, V. L. (2003). Stock Market Bubbles in the Laboratory. Journal of Behavioral Finance, 4(1), 7–20. https://doi.org/10.1207/S15427579JPFM0401_03
- Sanders, D. R., & Irwin, S. H. (2017). Bubbles, froth and facts: Another look at the masters hypothesis in commodity futures markets. Journal of Agricultural Economics, 68(2), 345–365. https://doi.org/10.1111/1477-9552.12191
- Sanders, D. R., Irwin, S. H., & Merrin, R. P. (2010). The adequacy of speculation in agricultural futures markets: Too much of a good thing? Applied Economic Perspectives and Policy, 32(1), 77–94. https://doi.org/10.1093/aepp/ppp006
- Sexton, R. J. (2013). Market power, misconceptions, and modern agricultural markets. American Journal of Agricultural Economics, 95(2), 209–219. https://doi.org/10.1093/ajae/aas102
- Sexton, R. J., & Zhang, M. (2001). An assessment of the impact of food industry market power on U.S. consumers. Agribusiness, 17(1), 59–79. https://doi.org/10.1002/1520-6297(200124)17:1<59:AID-AGR1003>3.0.CO;2-D
- Tadesse, G., Algieri, B., Kalkuhl, M., & von Braun, J. (2014). Drivers and triggers of international food price spikes and volatility. Food Policy, 47, 117–128. https://doi.org/10.1016/j.foodpol.2013.08.014
- Tang, K., & Xiong, W. (2012). Index investment and the financialization of commodities. Financial Analysts Journal, 68(6), 54–74. https://doi.org/10.2469/faj.v68.n6.5
- Tappata, M. (2009). Rockets and feathers: Understanding asymmetric pricing. The RAND Journal of Economics, 40(4), 673–687. https://doi.org/10.1111/j.1756-2171.2009.00084.x
- Telser, L. G. (1958). Futures trading and the storage of cotton and wheat. Journal of Political Economy, 66(3), 233–255. https://doi.org/10.1086/258036
- Temin, P., & Voth, H.-J. (2004). Riding the South Sea Bubble. The American Economic Review, 94(5), 1654–1668. https://doi.org/10.1257/0002828043052268
- Tsvetanov, D., Coakley, J., & Kellard, N. (2016). Bubbling over! The behaviour of oil futures along the yield curve. Journal of Empirical Finance, 38, 516–533. https://doi.org/10.1016/j.jempfin.2015.08.009
- Verreth, D. M. I., Emvalomatis, G., Bunte, F., Kemp, R., & Oude Lansink, A. G. J. M. (2015). Price transmission, international trade, and asymmetric relationships in the Dutch Agri-Food Chain. Agribusiness, 31(4), 521–542. https://doi.org/10.1002/agr.21420
- Vollmer, T., Herwartz, H., & von Cramon-Taubadel, S. (2020). Measuring price discovery in the European wheat market using the partial cointegration approach. European Review of Agricultural Economics, 47(3), 1173–1200. https://doi.org/10.1093/erae/jbz040
- von Cramon-Taubadel, S., & Goodwin, B. K. (2021). Price transmission in agricultural markets. Annual Review of Resource Economics, 13(1), 65–84. https://doi.org/10.1146/annurev-resource-100518-093938
- Wang, D., & Tomek, W. G. (2007). Commodity prices and unit root tests. American Journal of Agricultural Economics, 89(4), 873–889. https://doi.org/10.1111/j.1467-8276.2007.01031.x
- Wellenreuther, C., & Voelzke, J. (2019). Speculation and volatility—A time-varying approach applied on Chinese commodity futures markets. Journal of Futures Markets, 39(4), 405–417. https://doi.org/10.1002/fut.21984
- Working, H. (1948). Theory of the inverse carrying charge in futures markets. Journal of Farm Economics, 30(1), 1–28. https://doi.org/10.2307/1232678
- World Bank. (2008). Global economic prospects 2008: Technology diffusion in the developing world (Vol. 42097). The World Bank. http://documents.worldbank.org/curated/en/827331468323971985/Global-economic-prospects-2008-technology-diffusion-in-the-developing-world
- Yang, J., Bessler, D. A., & Leatham, D. J. (2001). Asset storability and price discovery in commodity futures markets: A new look. Journal of Futures Markets, 21(3), 279–300. https://doi.org/10.1002/1096-9934(200103)21:3<279:AID-FUT5>3.0.CO;2-L
- Yang, J., Li, Z., & Wang, T. (2021). Price discovery in Chinese agricultural futures markets: A comprehensive look. Journal of Futures Markets, 41(4), 536–555. https://doi.org/10.1002/fut.22179
Appendix
Table A1. Unit root tests.
Table A2. Cointegration test and granger causality test.
Figure A1. Corn: time-varying long run and short run adjustment parameters for the futures price.
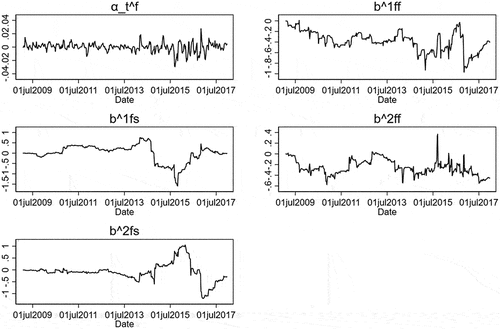
Figure A2. Soybeans: time-varying long run and short run adjustment parameters for the futures price.