
 ?Mathematical formulae have been encoded as MathML and are displayed in this HTML version using MathJax in order to improve their display. Uncheck the box to turn MathJax off. This feature requires Javascript. Click on a formula to zoom.
ABSTRACT
This study conducts a comparative analysis of the factors affecting financial inclusion in Kenya and Ethiopia at macro and micro levels. A generalized linear model is used to examine the determinants of and barriers to financial inclusion using the 2017 Global Findex Database, whereas a descriptive analysis is used to explore their macro-level differences. Kenya has a higher level of financial inclusion than Ethiopia. Differences in financial liberalization policy, gross domestic product, percentage of rural population, and mobile money service expansion are some macro-level differences that explain this variation. Differences in literacy rates and means of receiving payments such as government transfers explain some of the micro-level variations between the two countries. In addition, gender, age, employment status, and owning a mobile phone have significant and positive effects on financial inclusion. However, lack of documentation, lack of trust, and lack of money are significant barriers to financial inclusion.
1. Introduction
Many countries recognize the need for the financial inclusion of their citizens and have adopted this as a national strategy (Desalegn & Yemataw, Citation2017). Financial exclusion creates social instability and worsens income inequality (Wang & Guan, Citation2017). It has also been linked to social exclusion, which signifies economic, social, and political inequality and associated effects on human rights (Caplan, Birkenmaier, & Bae, Citation2021). Meanwhile, financial inclusion can be used to enhance economic growth and reduce poverty levels (Churchill & Marisetty, Citation2020). Studies have stated that financial inclusion enhances investment by reducing financial frictions (Ezzahid & Elouaourti, Citation2021; Odugbesan, Ike, Olowu, & Adeleye, Citation2020). Furthermore, Sanjaya and Nursechafia (Citation2016) show that financial inclusion is a potential policy tool to stimulate inclusive growth and development.
Ethiopia and Kenya have acknowledged the benefit they can reap from expanding their level of financial inclusion, and thus have integrated it as part of their national strategy (NBE, Citation2017; Van Hove & Dubus, Citation2019). According to the Global Findex report of 2017, Ethiopia is categorized as a low financial-inclusion country, whereas Kenya has a higher financial-inclusion level (Demirgüç-Kunt, Klapper, Singer, Ansar, & Hess, Citation2018). Kenya is recognized as a leader in mobile money service and a global player in financial inclusion in terms of sharing its success story with other countries (Hannig, Citation2013). Ethiopia is hence lagging behind Kenya and many people remain financially excluded (Lakew & Azadi, Citation2020).
Kenya and Ethiopia are neighboring countries with similar economic structures. Agriculture accounts for the largest share of employment in both countries, at 67% in Ethiopia and 56% in Kenya (World Bank, Citation2020). The services sector has the main share of GDP in both countries, followed by the agriculture and industry sectors (Barrientos & Soria, Citation2021). Given their similar economic structure, it is useful to examine why they have different financial inclusion levels. Furthermore, because the nature and scope of financial inclusion are affected by different factors, many scholars are still trying to identify the main determinants of financial inclusion (Akileng, Lawino, & Nzibonera, Citation2018).
It is therefore important to compare Ethiopia and Kenya and identify the factors affecting their financial inclusion levels and learn lessons from countries with higher levels of financial inclusion. This would be important for policy development in Ethiopia, which lags behind Kenya in terms of financial inclusion.
Financial inclusion is a multidimensional phenomenon that requires multidimensional measurement (Chakravarty & Pal, Citation2013). Such measurement should combine indicators that represent different dimensions of financial inclusion such as penetration, availability, and usage. Indexes of financial inclusion (IFI) capture its multidimensionality in a single number. This allows for comparison across economies and makes it easier to study its link with explanatory variables (Sarma, Citation2015). Thus, we can use IFI when comparing financial inclusion between Kenya and Ethiopia.
Studies that have assessed the factors affecting financial inclusion in different countries include (Anarfo, Abor, & Ose, Citation2020; Asuming, Osei-Agyei, & Mohammed, Citation2019; Bozkurt, Karakuş, & Yildiz, Citation2018; Irankunda & Van Bergeijk, Citation2020; Sanderson, Mutandwa, & Le Roux, Citation2018; Soumaré, Tchana Tchana, & Kengne, Citation2016; Tiwari, Schaub, & Sultana, Citation2019; Wang & Guan, Citation2017). However, most studies in Sub-Saharan African (SSA) countries fail to address the multidimensionality of financial inclusion using IFI. Even though they use various indicators to measure financial inclusion, these indicators do not represent the different dimensions of financial inclusion, nor do they simplify comparisons across economies or identify the suitability of other explanatory variables. Moreover, those studies that used IFI as a measure of financial inclusion only estimated it at the macro level. Studies that estimated IFI at the micro level are missing. In addition, although some studies conduct a comparative analysis on financial inclusion trends (Asuming et al., Citation2019; Bozkurt et al., Citation2018; Wang & Guan, Citation2017), studies that explain why countries have different levels of financial inclusion are limited. Those studies (Soumaré et al., Citation2016) that explain the difference focus only on the micro-level characteristics and ignore macro-level variables.
This paper contributes to the existing literature by analyzing the factors responsible for the difference in the financial inclusion levels of Kenya and Ethiopia using IFI at the macro and micro levels. Specifically, it addresses questions such as how Kenya and Ethiopia differ in their level of financial inclusion, what are the determining factors of and barriers to financial inclusion in both countries, what factors contribute to their difference at the macro and micro levels, and what can Ethiopia learn from Kenya to enhance its level of financial inclusion.
The remainder of this paper is structured as follows. Section 2 provides an empirical literature review. Section 3 presents the methodology used in the study. Section 4 presents the results and discussion. Section 5 concludes and provides policy recommendations.
2. Empirical literature review
In this section, we review the studies that examine the factors affecting financial inclusion in the SSA countries. Various indicators are used to measure financial inclusion. The most common one is account ownership at financial institutions (Asuming et al., Citation2019; Chikalipah, Citation2017; Irankunda & Van Bergeijk, Citation2020; Lakew & Azadi, Citation2020; Soumaré et al., Citation2016; Ulwodi & Muriu, Citation2017). Other measures include the number of automated teller machines (ATMs) and branches (Ajide, Citation2017), and saving and borrowing behavior (Asuming et al., Citation2019; Oyelami, Saibu, & Adekunle, Citation2017; Soumaré et al., Citation2016). Other studies use their own indicators to measure financial inclusion (Sanderson et al., Citation2018; Van Hove & Dubus, Citation2019). However, these studies use various indicators separately. It is valuable to have as many indicators as possible to measure financial inclusion, but when used separately, they provide incomplete information on the level of financial inclusion (Sarma, Citation2015).
At the macro level, GDP per capita is found to be a significant factor affecting financial inclusion (Asuming et al., Citation2019; Oyelami et al., Citation2017). Another important factor is literacy. Illiteracy in SSA countries has been a major factor limiting the level of financial inclusion (Chikalipah, Citation2017; Oyelami et al., Citation2017). Financial and business freedom improves a country’s financial inclusion level. Meanwhile, tight regulation limits people’s access to finance (Anarfo et al., Citation2020; Asuming et al., Citation2019).
Gender, age, education, and wealth are found to be significant micro-level determinants of financial inclusion. Women are less likely to be financially included than men. Furthermore, as age increases, so does adults’ level of financial inclusion. Moreover, adults’ likelihood of being financially included increases as their level of education and wealth increases (Asuming et al., Citation2019; Irankunda & Van Bergeijk, Citation2020; Sanderson et al., Citation2018). Lack of money, distance, cost, and lack of documentation are major barriers that limit adults’ inclusion in financial sectors (Lakew & Azadi, Citation2020; Ulwodi & Muriu, Citation2017).
3. Methodology
3.1. Data
Cross-sectional micro-level data from the 2017 Global Findex Database are used. The database includes information on individual characteristics and financial inclusion indicators collected through nationally representative surveys. It is drawn from survey data covering almost 150,000 people in 144 countries. For this study, a sample of 2000 households from Ethiopia and Kenya (1000 per country) is used. In addition, 10-year macro-level data (from 2010 to 2019) are obtained from the National Bank of Ethiopia, Association of Ethiopian Microfinance Institutions, World Bank, International Monetary Fund (IMF), The Heritage Foundation, and The Global Economy database to determine what macro-level variables explain the difference in financial inclusion between the two countries.
3.2. Measurement of financial inclusion
Most studies estimate IFI using macro-level data. But according to Sarma (Citation2012), the index can be constructed at both the macro and micro levels depending on the purpose of the study. In this paper, because the objective is to analyze the macro- and micro-level differences in financial inclusion, the IFI is calculated at both levels following the method of Wang and Guan (Citation2017) with modifications on the dimensions and indicators. The dimensions are adopted from Sarma (Citation2015), and the indicators reflect the major services provided by banks and microfinance institutions (MFIs). However, the lack of adequate data is a limitation to this method of IFI estimation. Additional indicators that represent different financial services cannot be added because of the unavailability of data.
Three dimensions, namely penetration, availability, and usage are used to calculate the index. At the macro-level,Footnote1 the penetration dimension is measured using the number of accounts in banks and MFIs per 1000 adults as indicators. The availability dimension is measured using the number of banks and MFI branches, ATMs, mobile bank users, and agent banks per 100,000 adults. The usage dimension is measured using outstanding loans and deposits with banks and MFIs as a percentage of GDP. At the micro level,Footnote2 the penetration dimension is measured by ownership of accounts at financial institutions, whereas the availability dimension is measured by ownership of mobile money accounts, debit cards, and credit cards. The usage dimension is measured using savings and borrowings during the past 12 months as indicators.
The method follows three steps. The first step involves estimating the indicators separately as follows. This makes them lie between 0 and 1.
where,
is the estimated value of indicator
in the
dimension
is the actual value of indicator
in the
dimension
is the maximum value of indicator
in the
dimension
is the minimum value of indicator
in the
dimension
At the macro level, the minimum observed value is used as the lower limit. For the upper limit, the 90th percentile of the maximum observed value is used to avoid outliers. For those observations whose value exceeds the 90th percentile, the upper limit is used as their actual value. However, the indicators for the micro-level data are binary variables. They are assigned the value of 1 if a person’s response is yes and 0, otherwise. Therefore, the lower limit is 0 and the upper limit is 1.
In the second step, the indicators are combined to calculate IFI for the dimensions ()
where is the weight of indicator
in the
dimension. The weight is estimated using the coefficient of variation (CV), which is the standard deviation divided by the mean. The weight of each indicator (
) is defined as the ratio of its CV (
) to the sum of all indicators’ CV in a dimension (Wang & Guan, Citation2017). That is,
In the last step, the three dimensions are combined to estimate the IFI.
In the above formulas, ,
and
are the weights of the three dimensions calculated using the CV method. The IFI ranges between 0 and 1. An IFI closer to one represents a higher level of financial inclusion, whereas an IFI closer to zero represents a lower level of financial inclusion.
3.3. Method of data analysis
3.3.1. Macro-level determinants
Descriptive analysis is used to examine the relationship between the macro-level variables and financial inclusion as measured by IFI. The following variables are chosen to study the macro-level difference in financial inclusion between Kenya and Ethiopia.
The financial freedom index (FFI) measures the level of government intervention in the financial sector. The index is comprised of five broad areas: (i) the extent of government regulation of financial services, (ii) the degree of state intervention in financial sectors, (iii) government influence on the allocation of credit, (iv) the extent of financial and capital market development, and (v) openness to foreign competition (The Heritage Foundation, Citation2021). Using the index makes it easier to study the relationship between financial freedom and financial inclusion.
According to institutional theory, financial freedom creates a competitive environment for financial sectors. Competitive pressures drive the financial system to focus on market competition. This creates more efficient and effective financial products that contribute to a higher level of financial inclusion (Seman, Citation2016).
GDP per capita is gross domestic product divided by midyear population (The Global Economy, Citation2021). According to the neoclassical economic theory of poverty, financial inclusion is closely related to and moves together with GDP. There is no causality among these variables, but they are closely related and move together (Buckland, Citation2012). Thus, a higher level of GDP is associated with a higher level of financial inclusion.
Percentage of rural population is the proportion of people living in rural areas. Rural areas tend to have high transaction costs. According to transaction cost theory, high transaction costs discourage the expansion of the financial sector, thus lowering financial inclusion (Obińska-Wajda, Citation2016).
Mobile money services involve the use of mobile phones to receive and send money as well as make payments (Demirgüç-Kunt et al., Citation2018). It reduces transaction costs and thus increases the financial inclusion level (Van Hove & Dubus, Citation2019)
3.3.2. Micro-level determinants
Data on individual demographic and socioeconomic variables are used to study their effect on financial inclusion at the micro level. Two regressions are estimated. The first identifies the factors that determine financial inclusion and the second investigates the barriers. The dependent variable in both regressions is IFI.
The generalized linear model (GLM) developed by McCullagh and Nelder (Citation1989) is adopted to analyze the determinants of and barriers to financial inclusion. Because IFI lies between 0 and 1, it is difficult to estimate an ordinary least squares (OLS) regression. If the transformed value of IFI is used, i.e. transforming it using logarithms so that it lies between – ∞ and ∞, using OLS can yield an inconsistent result when the log of zero values is taken. This is the case in IFI because it has several zero values. Moreover, the transformed equation can be a biased estimator of the original equation (Pena, Hoyo, & Tuesta, Citation2014). Thus, GLM is used.
GLM is estimated by the maximum likelihood estimation method, which makes it appropriate for variables with values between 0 and 1. GLM has two features, namely, the link function and the error structure. The link function can be log, logistic, power, negative binomial, or probit, whereas the error structure can be Gaussian, Poisson, binomial, negative binomial, or gamma (Pena et al., Citation2014). For this study, a binomial (Bernoulli) error structure with a logit link function is used. Its appropriateness for variables with values between 0 and 1 with most values centered around 0 makes this structure a better fit for this study because many people are financially excluded.
The basic functional form of GLM is given as where
is the linear predictor,
is the population average and
is the link function. Given the binomial error structure with a logit link function, the model can be defined as:
can also be defined as the linear sum of effects of the explanatory variable set
, thus,
.
indicates the regressor variables,
is the parameter to be estimated from the data, and
is the error term. The transformed variable
is a monotonically increasing function of IFI, and hence it preserves the same ordering as IFI (Sarma, Citation2008).
The following are explanatory variables for the determinants of financial inclusion.
Gender is a discrete variable with two categories, namely, men and women. Women are believed to be less financially included than men (Izquierdo & Tuesta, Citation2015).
Age is a continuous variable. Age is positively related to financial inclusion. However, after a certain age, the level of financial inclusion declines (Pena et al., Citation2014).
Education is a categorical variable with three categories: completed primary or less, secondary, and completed tertiary or more. Education is used as a proxy for literacy (Wang & Guan, Citation2017). According to the financial literacy theory of financial inclusion, literacy increases people’s willingness to use financial services, which increases their financial inclusion level. Moreover, governments with limited ability to increase financial inclusion use literacy as a major policy tool (Atkinson & Messy, Citation2013).
Employment is a binary variable that is set equal to 1 if the person is employed and 0 otherwise. Employment increases the likelihood of being financially included (Llanto & Rosellon, Citation2017).
Government transfer is a binary variable equal to 1 if the person receives government transfers and 0 otherwise. It is assumed to have a positive effect on financial inclusion (Yangdol & Sarma, Citation2019).
Ownership of a mobile phone is a binary variable equal to 1 if the person owns a mobile phone and 0 otherwise. According to Demirgüç-Kunt et al. (Citation2018), it increases the likelihood of being financially included by enabling mobile money services at a reduced cost.
The following are explanatory variables for barriers to financial inclusion. These variables are binary and equal to 1 if the response is yes and 0 otherwise.
Distance from financial institutions is an important barrier. The farther away financial sectors are located, the higher is the cost of travel and time (Demirgüç-Kunt et al., Citation2018). According to the transaction cost theory, this reduces the financial inclusion level (Obińska-Wajda, Citation2016).
Cost of opening an account is reported as a barrier to financial inclusion. The probability of opening an account is lower in areas where the cost is high (Allen, Demirgüç-Kunt, Klapper, & Peria, Citation2016).
Lack of documentation hinders account ownership. Documentation, particularly local documentation, can be difficult to obtain, thus restricting people from opening an account (Demirgüç-Kunt et al., Citation2018).
Lack of trust in financial institutions is a barrier that is difficult to overcome. Lack of information triggers a lack of trust, which hinders people from using formal financial services (Kumar, Citation2011).
Religion is a voluntary reason for financial exclusion. It instigates people’s choice not to own an account or use other financial services (Allen et al., Citation2016).
Lack of money is the most cited reason for financial exclusion. According to the neoclassical economic theory of poverty, the poor have less ability to save and are more likely to be without a bank account. They also face discrimination in financial markets (Davis & Sanchez-Martinez, Citation2014). These factors contribute to their financial exclusion.
Moreover, the variables are interacted with a residence variable that equals 1 if the person is Kenyan and 0 if the person is Ethiopian. The interaction term is useful to investigate how each variable varies between the two countries and allows a comparative analysis.
4. Results and discussion
4.1. Descriptive analysis
In , the macro-level indicators of financial inclusion for Kenya and Ethiopia from 2010 to 2019 are presented. Kenya outperforms Ethiopia in all indicators of financial inclusion. The difference between the two countries is large for mobile money accounts and agent banking. The average mobile money account per 100,000 adults is 65,825 in Kenya, whereas it is 1,063 in Ethiopia. Similarly, the average number of agents per 100,000 adults is 462 in Kenya and three in Ethiopia. In contrast, their difference in the number of branches and outstanding deposits (% of GDP) is small.
Table 1. Indicators of Financial Inclusion.
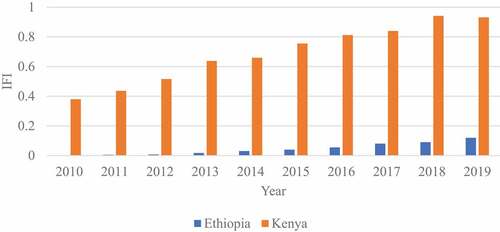
The result also clearly shows that Kenya has a higher level of financial inclusion than Ethiopia. At the macro-level, Kenya’s IFI is 64.7 percentage points higher than Ethiopia’s, i.e. the average IFI in Kenya is 0.691, whereas it is 0.044 in Ethiopia. The maximum IFI in Ethiopia is 0.119, whereas in Kenya it is 0.941 which is close to full financial inclusion. Moreover, the minimum IFI is 0.0012 in Ethiopia and 0.379 in Kenya. However, Ethiopia’s financial inclusion level rises consistently throughout the study period with an average growth rate of 80.4%. Meanwhile, Kenya’s financial inclusion average growth rate is only 10.8% and declines in 2019 (see ).
Figure 1. IFI in Ethiopia and Kenya.
At the micro-level, Kenya outperforms Ethiopia in all indicators except for the savings indicator. The difference in mobile money accounts is particularly prominent. In both countries, the share of adults with accounts in financial institutions is high, whereas the share of adults with credit cards is low. This is consistent with the findings of Demirgüç-Kunt et al. (Citation2018).
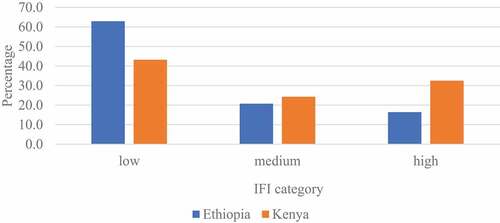
The average micro-level IFI is 0.073 and 0.133 for Ethiopia and Kenya, respectively. The highest IFI in Ethiopia is 0.749 and the lowest is 0. In Kenya, the maximum IFI is 1 and the minimum is 0. The IFI can be dividedFootnote3 into low (<0.065), medium (between 0.065 and 0.142), and high (>0.142) categories. As we can see from , the highest proportion of adults with low IFI is found in Ethiopia (62.9%), rather than Kenya (43.2%). The majority of adults in Kenya have high and medium IFI (32.5% and 24.3%, respectively), which contrasts with Ethiopian adults where 16.4% have high IFI and 20.7% have medium IFI. In addition, 53.5% of Ethiopian adults are financially excluded, but this figure is much lower in Kenya (14.5%).
Figure 2. IFI Categories in Ethiopia and Kenya.
4.2. Factors affecting financial inclusion
presents the regression result of the determinants of financial inclusion. It shows that gender is a statistically significant determinant of financial inclusion in both countries. Because of their low economic status, women are less likely to be financially included than men. This result is consistent with the findings of Asuming et al. (Citation2019). The gender gap is higher in Kenya than in Ethiopia because being a man in Kenya increases financial inclusion by 37.9%, whereas in Ethiopia, this figure is 17.6%.
Table 2. Determinants of Financial Inclusion.
Age has a positive effect on financial inclusion, whereas the coefficient of age-squared is negative implying the existence of a threshold effect. To see the overall effect of age on financial inclusion, net effects are estimated following Asongu and Odhiambo (Citation2020a, Citation2020b). Accordingly, the net effect is 0.0256 in Ethiopia and 0.0247 in Kenya, which shows that their level of financial inclusion increases with age. The effect of age is zero at an age of 43 years for Ethiopia and 42 years for Kenya. Above this age group, its increment reduces financial inclusion.
EducationFootnote4 has a positive effect on financial inclusion. Compared with completing primary education or less, secondary education increases financial inclusion by 46.8% and 81.8% in Ethiopia and Kenya, respectively, whereas completing tertiary education or more increases financial inclusion by 156.3% in Kenya. Thus, more educated people have a higher financial inclusion level than less educated people and the effect is higher in Kenya than in Ethiopia. This is consistent with financial literacy theory.
Those who are employed have a higher level of financial inclusion than the unemployed. Employment entails receipt of income and most likely they receive it via financial institutions. Thus, employed people are 33.5% in Ethiopia and 47.2% in Kenya more financially included than unemployed people. This is consistent with the findings of Llanto and Rosellon (Citation2017).
Receiving government transfers has no effect on financial inclusion in Ethiopia, whereas it has a significant and positive effect in Kenya. When the government uses the financial sector to make payments, people are forced to open accounts to receive them. Most Kenyans receive government transfers via accounts, which increases their financial inclusion level by 29.9%. This result is consistent with Yangdol and Sarma (Citation2019).
Owning a mobile phone increases financial inclusion in both countries. Its effect is higher in Kenya than in Ethiopia by 52.5%, which is a notable difference. It enables the use of mobile money services and reduces the transaction cost of using financial services. This result is consistent with the findings of Bongomin, Ntayi, Munene, and Malinga (Citation2018). Finally, the fact that a person is merely a Kenyan or Ethiopian does not have an effect on financial inclusion. The difference between the two countries arises when other variables are involved.
4.3. Barriers to financial inclusion
shows the main barriers responsible for financial inclusion. Distance is one of the barriers to financial inclusion in Ethiopia. However, it is not a significant factor in Kenya. This is mainly attributed to the advancement of mobile money services in Kenya, which reduces the use of financial sector branches. Meanwhile, the comparatively low availability of mobile money services in Ethiopia has forced people to use branches whose transaction cost increases with distance, thus reducing the financial inclusion level.
Table 3. Barriers to Financial Inclusion.
The cost of opening an account is found to be an insignificant factor in both countries. Because the financial sector encourages people to open an account free of charge, the cost is not a barrier. This is consistent with the findings of Lakew and Azadi (Citation2020).
Lack of documentation reduces financial inclusion in both countries. This result corroborates the findings of Demirgüç-Kunt et al. (Citation2018), which show that the number of people with government-issued identification is lower in SSA countries (56%) such as Ethiopia and Kenya than in developing economies in general (85%). This produces a challenge in providing documentation. Furthermore, having national identification is not always sufficient to open an account because financial sectors require local identification. This makes lack of documentation a barrier to financial inclusion.
Lack of trust in financial institutions significantly reduces financial inclusion in both countries. This result verifies the findings of previous studies, which explains how people find it difficult to entrust their money to financial institutions because they lack full information on their activities and/or are unfamiliar with new financial products (Demirgüç-Kunt et al., Citation2018; Tiwari et al., Citation2019). Therefore, a lack of trust in financial sectors and their products causes financial exclusion.
In both countries, religion has no effect on financial inclusion. In general, religion is a significant barrier in a Muslim-dominated areas (Demirgüç-Kunt et al., Citation2018). However, in Kenya, only 7% of the population is Muslim. In Ethiopia, 33.8% of the population is Muslim (PRC, Citation2011). However, the availability of sharia-compliant financial products as well as Islamic banking offsets the impact of religion on financial inclusion (Hailu & Yatoo, Citation2021) making it an insignificant factor.
Lack of money is a significant barrier to financial inclusion in both countries. This result concords to the findings of Demirgüç-Kunt et al. (Citation2018), where lack of money is found to be a major barrier to financial inclusion globally. Furthermore, it is consistent with the neoclassical theory of poverty, which states that people with limited money are unable to open an account or save, thus forcing them into financial exclusion.
Therefore, lack of documentation, lack of trust, and lack of money are the major barriers to financial inclusion in both countries, whereas distance is a barrier only in Ethiopia. Their effect is much smaller in Kenya than in Ethiopia, i.e. by 275.99% for lack of documentation, 84.18% for lack of trust, and 57.5% for lack of money.
4.4. The difference in financial inclusion between Kenya and Ethiopia
One of the main findings of this study is that there is a significant difference in financial inclusion levels between Kenya and Ethiopia, with Kenya having a higher value. Different macro- and micro-level reasons contribute to this difference.
4.4.1. Macro-level differences in financial inclusion
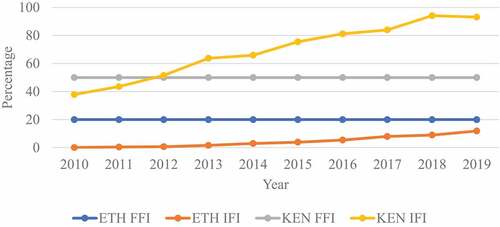
Kenya has a more liberalized financial system and more foreign financial companies. Ethiopia has a regulated financial system that is closed to foreign companies. Thus, Kenya has a higher level of FFI than Ethiopia. A higher FFI indicates higher levels of freedom from government interference and efficiencies of financial sectors. This creates a competitive environment for financial sectors encouraging them to develop different financial products for the society, which increases financial inclusion by increasing the availability of financial services. This is consistent with institutional theory. However, tight financial regulation, which results in low FFI, reduces financial inclusion. As we can see from , there is a positive relation between IFI and FFI, and Kenya has a higher value for both.
Figure 3. Correlation between IFI and FFI in Both Ethiopia (ETH) and Kenya (KEN).
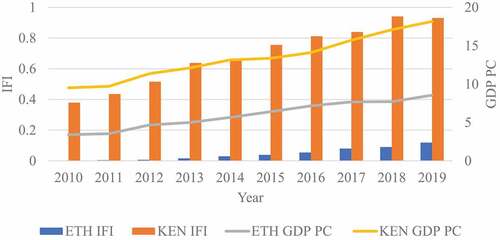
Ethiopia is a low-income country and Kenya is a lower-middle-income country (Demirgüç-Kunt et al., Citation2018). From , we can see that there is a positive relationship between GDP per capita and IFI, with Kenya having the highest score for both. This is because high-income countries tend to have high financial inclusion levels (Sarma, Citation2015). Thus, Kenya has a higher financial inclusion level than Ethiopia. This is consistent with the neoclassical economic theory of poverty, which states that there is a positive relationship between financial inclusion and GDP.
Figure 4. Relation between IFI and GDP per Capita.
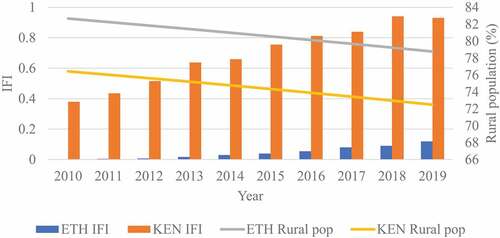
shows that the percentage of the rural population in Kenya is low compared with Ethiopia. Rural areas lack the necessary infrastructure required for financial sectors. Thus, opening a formal financial sector results in a high operating cost (Yangdol & Sarma, Citation2019). According to transaction cost theory, a high transaction cost restricts the expansion of financial sectors. As we can see from the figure, this gives Kenya an advantage in having a higher level of financial inclusion, whereas Ethiopia has a lower level.
Figure 5. IFI and Rural Population of Ethiopia and Kenya.
In addition, mobile money services are more widely available in Kenya than in Ethiopia. Kenya was the first SSA country to launch mobile money in 2007. It has the highest share of adults with mobile money accounts in the world. In 2017, the percentage of adults with mobile money accounts in Kenya was 76.9%, whereas it was only 0.8% in Ethiopia. Moreover, telecoms in Kenya are allowed to provide mobile money services (Klein & Mayer, Citation2011). However, until May 2021, Ethiopian Telecom was prohibited from participating in financial markets unless it is in cooperation with a financial institution. Only banks and MFIs had the authority to launch mobile money services in the country (Asfaw, Citation2015). In addition, there are different telecom service providers in Kenya, whereas Ethiopian Telecom is a monopoly. The absence of a monopoly in Kenya creates competition among telecoms to introduce new and convenient mobile money services. All these factors contribute to the difference in the expansion of mobile money services between the two countries. As we can see from , there is a positive relationship between the number of mobile money accounts and financial inclusion. This gives Kenya the advantage of having a higher level of financial inclusion.
Figure 6. Relation between IFI and Number of Mobile Money Accounts.
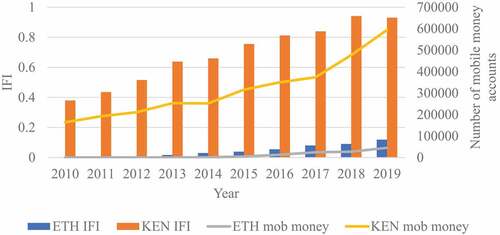
Recently, the situation in Ethiopia has been changing as it opens its telecom sector to private investors. Ethio Telecom also started a mobile money service called Tele Birr in May 2021. However, the effect of these changes on the country’s financial inclusion level remains to be seen.
4.4.2. Micro-level differences in financial inclusion
Ethiopia and Kenya also differ at the micro level. Literacy creates the awareness and ability to choose wisely and use financial services (Bongomin, Ntayi, Munene, & Nabeta, Citation2016). Thus, countries with higher education levels have the advantage of enhancing their level of financial inclusion. According to the Global Findex Database, the percentage of adults with primary education or less is 71.5% in Ethiopia, whereas it is 29.7% in Kenya. However, the percentage of adults with secondary education is 28.7% in Ethiopia and 64.2% in Kenya. Meanwhile, the proportion of adults with tertiary education is 6.1% in Kenya. In accordance with financial literacy theory, the educational gap, which stimulates financial literacy in favor of Kenya, is one of the reasons why there is a notable difference in the level of financial inclusion between the two countries.
Moreover, the difference in the method of receiving payments augments the divergence in financial inclusion between the two countries. One instance is government transfers. According to Demirgüç-Kunt et al. (Citation2018), despite the availability of financial services in Ethiopia, government transfers are usually made in cash. But in Kenya, this kind of payment is mostly done using financial services. Thus, the effect of government transfers on financial inclusion is more pronounced in Kenya than in Ethiopia (see ), creating a difference in their level of financial inclusion.
5. Conclusion and policy recommendations
Although financial inclusion plays an important role in an economy, it is affected by different economic and individual characteristics. Thus, it is crucial to determine how these factors affect the level of financial inclusion in Kenya and Ethiopia and identify the reasons for their difference. To investigate this, it is helpful to use an index that captures the multidimensionality of financial inclusion and allows for comparison. Therefore, the objectives of this study are to investigate the determinants of and barriers to financial inclusion in Kenya and Ethiopia and analyze their differences at the macro and micro levels.
Kenya has a higher level of financial inclusion than Ethiopia. The difference in financial liberalization policy, economic growth, proportion of the rural population, and expanded availability of mobile money services because of developed telecoms are some of the macro-level variables contributing to this variation. At the micro level, a higher literacy rate and receipt of payments such as government transfers via financial institutions give Kenya an advantage in achieving higher levels of financial inclusion. Meanwhile, Ethiopians incur a higher cost because they depend primarily on traditional banking services such as branches, making transaction costs a cause for financial exclusion. Furthermore, cash transactions are used widely for transfer payments, thus reducing the use of financial services. These factors contribute to the difference in financial inclusion between the two countries.
Different recommendations can be deduced from the findings. There is a positive relationship between education and financial inclusion. This effect is more prominent in Kenya than in Ethiopia, which gives it an advantage in terms of having higher awareness for the use of different financial services, especially digital banking. Thus, in accordance with financial literacy theory, Ethiopia should increase its literacy rate as a policy measure to boost its financial inclusion level.
However, the gender gap is higher in Kenya than in Ethiopia. To reduce this, Kenya should work toward increasing women’s financial inclusion level. One way is to increase the literacy level of women because literacy contributes to an increased level of financial inclusion.
The use of cash in transactions such as government transfers is noticeable in Ethiopia. Therefore, as in Kenya, more government transfers in Ethiopia should be made using financial services. When the government frequently makes any kind of payment via the financial sector, people’s awareness and habits in the use of financial services can be induced and financial inclusion can be enhanced.
Another finding is that high transaction costs reduce financial inclusion. However, the expansion of mobile money services reduces the transaction costs of using financial services. For instance, distance is one of the major causes of financial exclusion in Ethiopia, but it is not a barrier in Kenya because of the expanded availability of mobile money services. Therefore, the financial and telecom sectors in Ethiopia should learn from Kenya and further expand the availability of mobile money services, and increase people’s awareness of their use through different promotional activities.
In addition, Ethiopia should liberalize its financial system. The presence of foreign financial companies in Kenya seems to improve its financial inclusion level, especially in the expansion of mobile money services. Furthermore, as we can see from Kenya, having more telecom companies (foreign and domestic) and allowing for more mobile operators provides the opportunity for mobile money services expansion. Therefore, Ethiopia can learn from Kenya and follow a more liberalized approach to enhancing its financial inclusion level.
Finally, even though Kenya has a higher financial inclusion level than Ethiopia, there is still a large percentage of financially excluded adults. Thus, Kenya should further improve its financial inclusion level by reducing barriers such as lack of documentation and lack of trust by simplifying the documentation challenge and creating awareness to develop trust.
Disclosure statement
No potential conflict of interest was reported by the author(s).
Data availability statement
The data used in this study are available from the Global Findex Database (https://microdata.worldbank.org/index.php/catalog/global-findex), IMF Database (https://data.imf.org), The Heritage Foundation (https://www.heritage.org/), The Global Economy (https://www.theglobaleconomy.com/), and from the corresponding author upon reasonable request.
Additional information
Funding
Notes
1. The weights of the indicators are 1 for number of accounts, 0.08 for number of branches, 0.23 for number of ATMs, 0.34 for number of mobile bank users, 0.35 for number of agent banks, 0.62 for outstanding loans (% of GDP), and 0.38 for outstanding deposits (% of GDP). The weights of the dimensions are 0.22 for penetration, 0.69 for availability, and 0.09 for usage.
2. The weights of the indicators are 1 for account ownership, 0.22 for debit card ownership, 0.15 for mobile money account ownership, 0.63 for credit card ownership, 0.37 for savings, and 0.63 for borrowings. The weights of the dimensions are 0.21 for penetration, 0.38 for availability, and 0.41 for usage.
3. The division is made based on the data using quartiles.
4. The effect of tertiary education on IFI is only relevant for Kenya because there are no tertiary education graduates in Ethiopia in the 2017 Global Findex database.
References
- Ajide, K. B. (2017). Determinants of financial inclusion in Sub-Saharan Africa countries: Does institutional infrastructure matter? CBN Journal of Applied Statistics, 8(2), 69–89.
- Akileng, G., Lawino, G. M., & Nzibonera, E. (2018). Evaluation of determinants of financial inclusion in Uganda. Journal of Applied Finance and Banking, 8(4), 47–66.
- Allen, F., Demirgüç-Kunt, A., Klapper, L., & Peria, M. S. M. (2016). The foundations of financial inclusion: Understanding ownership and use of formal accounts. Journal of Financial Intermediation, 27, 1–30.
- Anarfo, E. B., Abor, J. Y., & Ose, K. A. (2020). Financial regulation and financial inclusion in Sub-Saharan Africa: Does financial stability play a moderating role? Research in International Business and Finance, 51, 101070.
- Asfaw, H. A. (2015). Financial inclusion through mobile banking: Challenges and prospects. Research Journal of Finance and Accounting, 6(5), 98–104.
- Asongu, S. A., & Odhiambo, N. M. (2020a). Insurance policy thresholds for economic growth in Africa. The European Journal of Development, 32(3), 672–689.
- Asongu, S. A., & Odhiambo, N. M. (2020b). How enhancing gender inclusion affects inequality: Thresholds of complementary policies for sustainable development. Sustainable Development, 28(1), 132–142.
- Asuming, P. O., Osei-Agyei, L. G., & Mohammed, J. I. (2019). Financial inclusion in sub-Saharan Africa: Recent trends and determinants. Journal of African Business, 20(1), 112–134.
- Atkinson, A., & Messy, F. A. (2013). Promoting financial inclusion through financial education (OECD Working Papers on Finance, Insurance and Private Pensions, (34)). Paris, France: OECD.
- Barrientos, M., & Soria, C. (2021). Ethiopia vs. Kenya Economy. Retrieved from https://www.indexmundi.com/factbook/compare/ethiopia.kenya/economy.
- Bongomin, G. O. C., Ntayi, J. M., Munene, J. C., & Nabeta, I. N. (2016). Financial inclusion in rural Uganda: Testing interaction effect of financial literacy and networks. Journal of African Business, 17(1), 106–128.
- Bongomin, G. O. C., Ntayi, J. M., Munene, J. C., & Malinga, C. A. (2018). Mobile money and financial inclusion in Sub-Saharan Africa: The moderating role of social networks. Journal of African Business, 19(3), 361–384.
- Bozkurt, İ., Karakuş, R., & Yildiz, M. (2018). Spatial determinants of financial inclusion over time. Journal of International Development, 30(8), 1474–1504.
- Buckland, J. (2012). Hard choices: Financial exclusion, fringe banks, and poverty in urban Canada. Canada: University of Toronto Press.
- Caplan, M. A., Birkenmaier, J., & Bae, J. (2021). Financial exclusion in OECD countries: A scoping review. International Journal of Social Welfare, 30(1), 58–71.
- Chakravarty, S. R., & Pal, R. (2013). Financial inclusion in India: An axiomatic approach. Journal of Policy Modeling, 35(5), 813–837.
- Chikalipah, S. (2017). What determines financial inclusion in Sub-Saharan Africa? African Journal of Economic and Management Studies, 8(1), 8–18.
- Churchill, S. A., & Marisetty, V. B. (2020). Financial inclusion and poverty: A tale of forty-five thousand households. Applied Economics, 52(16), 1777–1788.
- Davis, E. P., & Sanchez-Martinez, M. (2014). A review of the economic theories of poverty (National Institute of Economic Social Research Discussion paper, (435)). London: NIESR.
- Demirgüç-Kunt, A., Klapper, L., Singer, D., Ansar, S., & Hess, J. (2018). The Global Findex Database 2017: Measuring financial inclusion and the FinTech revolution. The World Bank.
- Desalegn, G., & Yemataw, G. (2017). Financial inclusion in Ethiopia: Using lsms (Ethiopia socioeconomic survey) data. Ethiopian Journal of Economics, 26(2), 31–58.
- Ezzahid, E., & Elouaourti, Z. (2021). Financial inclusion, financial frictions, and economic growth: Evidence from Africa. Journal of African Business, 1–26. doi:10.1080/15228916.2021.1926856
- The Global Economy (2021). Business and economic data. Retrieved from https://theGlobalEconomy.com.
- Hailu, S. M., & Yatoo, N. A. (2021). Islamic finance in Ethiopia: Current status, prospects and challenges. International Journal of Islamic Banking and Finance Research, 6(1), 1–18.
- Hannig, A. (2013, September). A high level conference on Kenya’s economic successes, prospects and challenges - making inclusive growth a reality. Paper presented at the Alliance for Financial Inclusion (AFI). Nairobi.
- The Heritage Foundation (2021). 2021 Index of Economic Freedom. Retrieved from https://www.heritage.org/index/explore?view=by-region-countryyear&u=637789272682527938.
- Irankunda, D., & Van Bergeijk, P. A. (2020). Financial inclusion of urban street vendors in Kigali. Journal of African Business, 21(4), 529–543.
- Izquierdo, N. C., & Tuesta, D. (2015). Factors that matter for financial inclusion: Evidence from Peru. Aestimatio: The IEB International Journal of Finance, 10, 10–31.
- Klein, M. U., & Mayer, C. (2011). Mobile banking and financial inclusion: The regulatory lessons (World Bank Policy Research Working Paper, (5664)). World Bank.
- Kumar, D. B. P. (2011). Financial exclusion: A theoretical approach (MPRA Paper, (89864)). Ambalapuzha: Government Arts and Science College.
- Lakew, T. B., & Azadi, H. (2020). Financial inclusion in Ethiopia: Is it on the right track? International Journal of Financial Studies, 8(2), 28.
- Llanto, G. M., & Rosellon, M. A. D. (2017). What determines financial inclusion in the Philippines? Evidence from a national baseline survey (PIDS Discussion Paper Series, (2017-38)). Philippines: Philippine Institute for Development Studies.
- McCullagh, P., & Nelder, J. A. (1989). Generalized linear models (2nd ed.). London, UK: Chapman and Hall.
- NBE (National Bank of Ethiopia). (2017). Ethiopian National Financial Inclusion Strategy. Addis Ababa, Ethiopia: Retrieved from The National Bank of Ethiopia.
- Obińska-Wajda, E. (2016). The new institutional economics - main theories. e-Finanse: Financial Internet Quarterly, 12(1), 78–85.
- Odugbesan, J. A., Ike, G., Olowu, G., & Adeleye, B. N. (2020). Investigating the causality between financial inclusion, financial development and sustainable development in Sub‐Saharan Africa economies: The mediating role of foreign direct investment. Journal of Public Affairs, e2569. doi:10.1002/pa.2569
- Oyelami, L. O., Saibu, O. M., & Adekunle, B. S. (2017). Determinants of financial inclusion in sub-Sahara African countries. Covenant Journal of Business & Social Sciences, 8(2), 104–116.
- Pena, X., Hoyo, C., & Tuesta, D. (2014). Determinants of financial inclusion in Mexico based on the 2012 National Financial Inclusion Survey (ENIF) (BBVA Working paper, (14/14)).
- PRC (Pew Research Center). (2011, January). Muslim Population by Country. Retrieved from https://www.pewforum.org/2011/01/27/table-muslim-population-by-country.
- Sanderson, A., Mutandwa, L., & Le Roux, P. (2018). A review of determinants of financial inclusion. International Journal of Economics and Financial Issues, 8(3), 1.
- Sanjaya, I. M., & Nursechafia, N. (2016). Financial inclusion and inclusive growth: A cross-province analysis in Indonesia. Buletin Ekonomi Moneter dan Perbankan, 18(3), 281–306.
- Sarma, M. (2008). Index of financial inclusion (Indian Council for Research on International Economic Relations (ICRIER) Working paper, (215)). New Delhi.
- Sarma, M. (2012). Index of financial inclusion–A measure of financial sector inclusiveness (Berlin Working Papers on Money, Finance, Trade and Development, (07/2012)).
- Sarma, M. (2015). Measuring financial inclusion. Economics Bulletin, 35(1), 604–611.
- Seman, J. A. (2016). Financial inclusion: the role of financial system and other determinants ( Unpublished doctoral dissertation). University of Salford, Salford, United Kingdom.
- Soumaré, I., Tchana Tchana, F., & Kengne, T. M. (2016). Analysis of the determinants of financial inclusion in Central and West Africa. Transnational Corporations Review, 8(4), 231–249.
- Tiwari, J., Schaub, E., & Sultana, N. (2019). Barriers to “last mile” financial inclusion: Cases from Northern Kenya. Development in Practice, 29(8), 988–1000.
- Ulwodi, D. W., & Muriu, P. W. (2017). Barriers of financial inclusion in Sub-Saharan Africa. Journal of Economics and Sustainable Development, 8(14), 66–81.
- Van Hove, L., & Dubus, A. (2019). M-PESA and financial inclusion in Kenya: Of paying comes saving? Sustainability, 11(3), 568.
- Wang, X., & Guan, J. (2017). Financial inclusion: Measurement, spatial effects and influencing factors. Applied Economics, 49(18), 1751–1762.
- World Bank. (2020). Countries and economies. Retrieved from https://data.worldbank.org/country.
- Yangdol, R., & Sarma, M. (2019). Demand-side factors for financial inclusion: A cross-country empirical analysis. International Studies, 56(2–3), 163–185.