
Abstract
For marine logistics and maintenance of extensive and expensive marine engineering projects in the coastal zone, it is essential that institutions provide the public with relevant information in an easily understandable yet comprehensive manner over the web. A perennial challenge, however, has been the development of spatio-temporal (four-dimensional (4D)) geo-visualization algorithms to enable the integration of time-varying geo-information in map-based visualizations on the Internet. In this paper, we address the challenge of visualizing marine spatial data in web-based applications through a 4D visualization concept, focusing on usability criteria, performance parameters, the required implementation effort, and delivering a breath of spatial information that supports decision-making on multiple levels. We used Web Graphic Library (WebGL) to validate our concept through a prototypical implementation. In our technology evaluation, WebGL proved highly suitable for the development of interactive, responsive, efficient, and mobile web-based Geographic Information applications, including 2D, 3D, and 4D (spatiotemporal) content. During our research, we identified a number of open research questions, including mapping graphic variables to thematic expressivity, representation of the time dimension in 4D systems, generic temporal generalization, and integration of (pseudo-)photorealistic illustrations in web-based geo-visualization systems.
Introduction
Planning for coastal development – for example, for building infrastructure, creating recreational areas, protecting the coastal zone from storms, etc. – requires careful planning and involving the public as well as planners in the decisions to be made (Few, Brown, and Tompkins Citation2007). This also presents a challenge for geoinformatics research to develop visual simulations of the projects’ operations and for institutions running simulation models to present their results to the public in a comprehensive and easily understandable manner (Kulawiak et al. Citation2010).
Because these simulations usually have three spatial and one temporal dimension, four-dimensional (4D) mapping of geospatial data on the web can significantly contribute to solving the challenge of informing decision makers as well as the public about development in coastal areas. In this context, the need for 4D web-based Geographic Information Systems (WebGIS) is rising and methods for 4D geo-data visualization are being developed for web-based geo-applications (Feng et al. Citation2011). However, 4D representation of time-varying phenomena in geo-visualization tools has not yet been thoroughly studied. This is surprising as the fast rise of Google Earth since its release in 2005 has revolutionized the Geographic Information (GI) sector, spreading the concept of Internet-based, map-centered information systems. Yet, many research challenges remain, including finding the optimal information density, not covering the orientation data in the background with other information layers, and using the “right” graphic variables to display (Bertin Citation1974). A specific issue is the integration of time-varying geo-information into map-based visualization systems on the web.
As a result, users of web-based geo-visualization systems often encounter difficulties in interacting with the systems and data presentation that is far from optimal. Systems that are not well designed are not user friendly, especially for people who do not have much experience in using map-based tools. On the other hand, too much simplification might lead to a high level of abstraction in conveying complex spatiotemporal geographic processes. The more abstract the visualization, the more disconnected from the physical world the visualization is, and the more effort is required to interpret the information presented in the digital environment.
In this paper, we address the need to present marine geo-data in web-based applications to nonexpert users by developing a web-based 4D visualization concept (see the use case description later in the paper). The concept we developed integrates usability-related criteria, performance parameters, the necessary implementation effort, and the requirement of conveying enough information to support decision-making on multiple levels. In the validation of the concept through a prototypical implementation, we used the Web Graphic Library (WebGL) (Khronos Group Citation2013), which scored best in our technology evaluation.
It shall be mentioned that the presented approach focuses mostly on explorative research rather than on an empirical evaluation of existing methods and principles. This is due to the fact that spatiotemporal visualization of marine geo-processes is not a thoroughly developed research area and thus not broadly represented in current literature – particularly usability is still an underestimated aspect in GI research.
The research presented in this paper focuses on spatiotemporal visualization of geographic processes rather than on the thematic analysis of marine geo-data. In brief, our research aims to answer the following questions:
What are the requirements for representing marine geo-data in 4D on the web?
Which usability criteria need to be particularly considered with web-based 4D visualization of spatial data?
Which existing components are best suited as underlying technologies for such a concept?
How can the developed web-based 4D geo-visualization concept be validated through a prototypical realization?
Related work
Three-dimensional visualization of multi-temporal geo-data is increasingly in the focus of academic research as it has considerable advantages compared with two-dimensional (2D) approaches in effectively conveying spatial content (Jobst and Germanichs Citation2007). We are experiencing an increased utilization of 3D representations of spatial structures and processes. However, while cartographic principles and variables (Bertin Citation1974) have been widely explored and their impact of perception has been investigated for two dimensions (e.g., Garlandini and Fabrikant et al. Citation2009), 3D/4D cases have not been thoroughly investigated. One reason for this might be that Google Earth is mainly used to view quasi-static content such as satellite imagery, which captures a variety of points of interest (PoI), or 3D city models.
The multidisciplinary field of visual analytics conducts research on visual representations and interaction techniques, data representations and techniques for the presentation, and publication of analytical results (Thomas and Cook Citation2006), which strongly relates the presented research to this field. Concepts for web-based geo-applications including 3D data representation have been examined in various research projects using different technology approaches. Shan (Citation1998) developed a 3D WebGIS based on the Virtual Reality Modeling Language (VRML). Ming (Citation2008) extended this concept by the use of the X3D language. Compared with previous 2D WebGIS developments, a livelier environment facilitating a better understanding of the landscape was created. However, the complexity of VRML, the low compatibility with other programming languages, and the need for a plug-in to display content in a browser made it virtually unusable. The successor to VRML, X3D, provides several interfaces for accessing other resources. However, its visualization capabilities for large data volumes are deficient as there is no graphics processing unit (GPU) support (Ming Citation2008).
Another approach based on VRML was developed by Zhu, Tan, and Chan (Citation2003). They focused on terrain modeling in VRML using simple longitude/latitude coordinates combined with elevation values. The authors present a web-based visualization method for 3D terrain. The 3D terrain model was constructed from a 2D contour data file of the Singapore terrain and integrated with a hybrid 2D–3D user interface. From this contour data, a Digital Elevation Model (DEM) was created in VRML, which has built-in visualization mechanisms. Every point is categorized by its position, from which the elevation values for the DEM are calculated. The data need to be preprocessed for visualization with such methods as Level of Detail before they can be presented in the Singapore Terrain Explorer. The explorer makes it possible for users to view GI by virtually flying through the terrain.
In Citation2011, Hering et al. published a 3D campus information system using WebGL. In this application, users can move freely around the virtual campus of the University of Koblenz, interact with objects, and retrieve information about buildings, persons, and objects. The application uses a highly detailed topographic polygon model created with the Blender 3D graphics software (Blender Foundation, Amsterdam, Netherlands). The main drawback of this approach is that the polygon model would need to be simplified and exported by a specially developed tool in order to be used in WebGL, thus limiting genericness.
Interaction in a 3D world became a distinct possibility in 2009 with the creation of OpenStreetMap (OpenStreetMap Foundation, Sutton Coldfield, UK) and Shuttle Radar Topography Mission (US Department of the Interior and US Geological Survey, Washington, DC, USA) using the 3D viewer XNavigator (Heidelberg University, Heidelberg, Germany) to display free geo-data (Zipf Citation2011). The application displays a terrain model, 3D buildings (over 20 million), and 3D visualization of PoI. The base data were acquired from a 3D geospatial data infrastructure (SDI) and donations. The geo-data are transmitted by a Web 3D Service to the client and displayed in a virtual globe in the XNavigator. The application is implemented as a Java plug-in for web browsers that needs to be separately installed, which does not comply with our requirement of native browser support.
Another 3D web-based geo-visualization system implemented in WebGL was developed by Feng et al. (Citation2011). The authors examine the change of geographic information system (GIS) applications from client–server models to browser–server architectures. The developed browser–server system consists of a web server, a terrain server, an image server, and a model server. The web server constitutes the user interface of the website; the terrain server supplies preprocessed DEM data. The image server provides tiled remote sensing images which serve as terrain texture; the model server supplies 3D models of buildings and other objects. To visualize the terrain and image server data, they are handed over to, and rendered by, the WebGL engine. However, due to its complex server structure, the applicability of this approach in practice is limited.
Next came the OpenWebGlobe project (Loesch, Christen, and Beniker Citation2012), which made a virtual globe in WebGL available to the open source community. Users need the OpenWebGlobe Software Development Kit to create their own customized globe by inserting new data from different data sources such as tiled orthophotos, maps, and elevation layers. This application can simultaneously display multiple layers from different data sources. In addition, external PoI objects can be integrated, and the user can retrieve more information by clicking on them. Three-dimensional objects such as cities or buildings and point clouds can also be represented. All of these different layers can be turned on and off according to the user’s needs. The main disadvantage is that the system only supports a small number of file formats.
Another open source Earth simulation tool was developed as part of the WebGL Earth project (Klokan Technologies Citation2013). This tool enables the visualization of many different data sources such as maps from OpenStreetMap or Bing, satellite imagery, and aerial photography. Furthermore, users can integrate their own data. These datasets are displayed on top of a virtual terrain where the user can move around freely. Because this application was built in WebGL, the simulation runs in most of today’s web browsers.
Like the other two projects already mentioned, Cesium (Analytical Graphics, Inc Citation2013) is a web-based software displaying geo-data on a virtual globe. It is based on WebGL and therefore it can be used across browsers and platforms. Two of the most remarkable features of Cesium are of its ability to represent data from such web services as the Open Geospatial Consortium’s Web Map Service or OpenStreetMap, and to draw vector data stored in Esri Shapefile format. One of the features of this application – which has bearing on the research described in this paper – is the possibility of visualizing data in a temporal series.
Concept for 4D visualization of marine geo-data
This section presents the developed concept for visualizing spatiotemporal marine geo-data in a web-based environment. First, we set the scene for our research by describing the specific requirements of a defined use case and by describing the data used for the development of our application. Following this, we discuss the most important cognitive aspects in 4D geo-visualization. Then, we present a thorough analysis of usability criteria that need to be considered, and end the section with specific design considerations for the development of web-based 4D applications integrating spatiotemporal geo-data.
Marine geo-data visualization use case
Marine logistics and ecologic protection are oftentimes subject to heterogeneous concerns of different interest groups. Thus, building and restructuring projects in coastal areas needs to be based on solid scientific foundations. It is for this purpose that the Federal Waterways Engineering and Research Institute of Germany (BAW) periodically develops status reports about the physical state of German estuaries. Further, surveys are conducted on engineering projects such as the construction of harbors and dikes or the deepening of fairways to decision makers. It shall be noted that members of the BAW (simulation experts, marine modelers, GIS professionals, and a number of nonexperts) accompanied the development of the use case.
The interest of citizens, media, and decision makers in such projects is high; and simulating the impact of these projects on the environment is thus essential. Due to their inherent complexity, simulations require careful preparation and documentation before they can be interpreted and fully understood by nonexperts. This complexity arises, in large part, from the fact that the input data for modeling and the results of modeling usually have three spatial dimensions and one temporal.
For a web-based visualization system designed for the public, the presentation aspect is of particular importance so as to ensure that the amount of information shown to the users at any given time, and its complexity, are reduced. For instance, the user does not need to see the development history of a single measurement point and the associated parameter settings, just the outcome. For 2D water-level data, this would mean that a zoomable diagram and statistic values to explore time series would be appropriate to get an overview and to recognize spikes of storm surges among the normal flood heights. In a 3D dataset, a virtual “flight” through the data is highly motivating. However, even nonexperts need to get the chance to understand the data presented, which requires the data to be equipped with adequate metadata.
Currently, the only web-based platform available for public use is a web browser. While simulation software is complex and oftentimes expensive, and therefore unsuitable for nonexperts, a browser is an omnipresent, easy-to-use tool. Consequently, our approach focuses on browser-based visualization for public use, where users are able to explore water levels and other marine geo-data sources in 2D, 3D, and 4D. Simple and intuitive controls (familiar to the public, e.g., through the use of such well-known applications as Google Earth) make large, multi-dimensional datasets comprehensible and help to understand complex correlations.
The data used for the validation of our concept have been obtained from “Long-term Analysis of Morphosedimentary Processes within the German Bight with Integrated Modeling” (AufMod), a research and development project conducted to analyze morpho-dynamics and sediment flux in the German Bight using different numerical modeling systems (Milbradt Citation2012). The project yielded consistent and complete bathymetric datasets of the area over 30 years, which have been created using extensive data-analysis methods. Additionally, hydrodynamic simulations produced a set of vector datasets (points) concerning, for instance, sediment flux within the German Bight. The simulation was performed on the physical grid which acted as the reference system for the simulation, regulating the granularity, that is, nodes, edges, or the center of a cell.
For the use case presented in this paper we used time-series data collected at nodes. The water level was used as our first visualization parameter because it is the central element for hydrodynamic modeling. We extracted 13 hours of data with a 20 minute measurement interval (9 January, 11:20 a.m. to 10 January, 12:00 a.m. midnight) to reflect the behavior of a complete tidal wave within the German Bight. Each dataset had a Gauss–Krueger encoded spatial reference, the bathymetric depth, a flag for a dry or a wet state, and the water level itself. For each of the 39 time steps there are 41,347 computational nodes spread over the German Bight, which sums up to about 1.6 million different computational nodes.
Cognitive aspects in 4D geo-visualization
Many cognitive processes such as understanding the content of a map are largely automatic (Jobst and Germanichs Citation2007). Yet, viewing, comprehending, and interacting with a 4D map requires considerable cognitive and perceptive capabilities. Depending on how profoundly these capabilities have been previously “learned” by a person, differences in time consumption and efficiency in understanding a map can be observed. The learning effect – and thus the efficiency in viewing a map – can be optimized by the use of dual coding methods. These comprise the variation of graphical variables such as color, shape or intensity, and more. In effect, the understanding of spatiotemporal processes can be fostered by conveying facts such as suspended sediment transport, salt concentration or temporal tidal variations via multiple channels. Our method of realizing this concept is described later.
An aspect, which needs to be thoroughly considered in the context of web-based 4D visualizations is that the efficiency of human information processing is drastically reduced if too much visual information with too many stimuli is presented at once. Information overflow prevents new knowledge creation in the human brain because any new input cannot be processed before the next stimulus arrives (Kluwe and Schulze Citation1994). As the brain discards unprocessed information, it is vitally important to include map semiotics in the design process, especially for pragmatics, and also semantics and syntactics. This particularly applies when designing 3D environments which are cognitively significantly more demanding than 2D environments.
Perception and cognition of 3D maps (readability and interpretation of spatial content) can be regarded as a psychological bridge between highly simplified abstracted two-dimensional maps and reality. Even though 2D maps may be sufficient for conveying simple matters, offering geometrically correct topographic representations, they drastically simplify reality and thus do not give credit to the highly complex capabilities of human spatial cognition (Resch et al. Citation2013).
There is an essential drawback to using 3D for virtually displaying real-world scenes in that they are by definition, distorted by such factors as spherical perspective, topographic irregularities, hidden objects, scale-dependent feature presentation, or geometric inconsistencies arising from the use of different Spatial Reference Systems. Despite these shortcomings, 3D cartographic representations are better for representing spatiotemporal phenomena than 2D representations.
Usability in web-based geo-visualization
The design of web-based geo-data visualization has not yet been standardized. Each implementation is done in a different way in terms of usability, functionality, interaction possibilities, map size, and symbologies. This heterogeneity is partly due to developers’ unique designs and partly to lack of consistent guidelines for implementing web-based mapping applications.
Currently, most developers focus on technology and the functionality of geo-visualization applications rather than on users and their needs. This technology-centered approach assumes that mature and progressive technology can compensate for deficient usability (Aditya and Kraak Citation2005). Consequently, future users are mostly not included in the design and development process. Two main reasons for this are high cost and time required to research all possible users (Watanabe, Yonemura, and Asano Citation2009).
Only a few surveys have been carried out that focus on web-mapping applications and their requirements (Nivala, Brewster, and Sarjakoski Citation2008); this is particularly true for web-based 4D geo-visualization applications. As a result, experience in assessing the specific aspects of such applications is lacking and no consistent guidelines exist. Usability is critically important for map-based visualization applications – even more so than for other web applications – because of the considerable cognitive effort required to use the applications correctly and to understand complex processes in 4D.
Usability is an indication of how simply and intuitively user interfaces can be interacted with (Nielsen Citation1993). The ISO 9241-11 standard defines usability as the “extent to which a product can be used by specified users to achieve specified goals with effectiveness, efficiency and satisfaction in a specified context of use” (International Organization for Standardization Citation2006). Nielsen’s (Citation1993) original definition included three more aspects as a subpart of system acceptability: learnability, memorability, and errors.
In the following paragraphs we describe (1) each parameter in general terms (d) and (2) how the parameter fits in our web-based 4D visualization concept (p).
Users: (d) This parameter describes users or user groups in terms of pre-knowledge, experience, usage context (physical, technical, and social), age, etc.
(p) A standard user of the 4D visualization concept presented here should be able to understand and explore the depicted data and information in a web browser. Our application is thus intended for a broad range of users interested in coastal processes. This could, for instance, be a resident interested in the heights of the last storm surge, a company developing offshore wind parks, or a decision maker who wants to gain insights in the data which their decisions are based on.
Goals: (d) This parameter defines which tasks a user performs using an application and which goals should be achieved.
(p) The goal of the use case defined was to assess the spatiotemporal variations of the water level in the German Bight and its bathymetry through the use of a 4D web-based geo-visualization application.
Context: (d) This parameter defines the usage context as composed of the physical context (physical environment, degree of mobility, etc.); the technical context (type of device, device capabilities, used software, etc.); and the social context (distractors, interaction with other persons, public or private, etc.).
(p) In our 4D geo-visualization use case, participants typically use a desktop computer and access information with a professional or a private interest and share the data or information accordingly.
Learnability: (d) Learnability indicates how easy it is for users to perform given tasks the first time they use an application.
(p) For the 4D geo-visualization use case presented in this paper it was decided to aim for an intuitive interface in order to make the application user friendly. This is crucial as the main purpose of our application is to provide easy access to information. Learnability is not a problem in this study as the typical user accesses the application several times per month and has considerable experience in using the tools. This notwithstanding, clear and comprehensive help dialog is crucial to enhancing the learning experience with the application. Among other things, finding the optimal trade-off between a comprehensive textual introduction (too much textual information can potentially overburden the user and result in fading interest) and conveying as much information as possible. Such a trade-off can be achieved by using illustrations enriched with short textual hints on how to use the application highlighting essential core functions. Additionally, the design (including the presentation of the core functionality) of the 4D interface needs to be optimized. Practical aspects supporting this optimization are presented later in this paper.
Efficiency and Effectiveness: (d) These parameters state how quickly (in terms of time and effort), and to what degree (how effectively), users can perform a given task once they have attained proficiency in using the application.
(p) Our web-based geo-visualization use case gives the user enough time to comprehend the application and its functionality. The application is intended to be used several times per month, which means that the design of the user interface can be more complex than that of other applications that are not used as frequently. This said, the interface and particularly the map have to adhere to common design guidelines with regard to optimized information density (scale-independence, adapted to digital screens, suitable number of features, zoom-level based data sub-selection, etc.), consistent color schemes, minimal eye movement in performing standard tasks, and minimum number of clicks to reach a certain goal. The optimization of the performance of web-based applications is highly desirable. It is for this reason that we use a caching mechanism in the 4D visualization application described here which preloads map data in areas around the currently viewed location (in all directions). This results in smooth navigation on the map without waiting for the next set of data to load. The same applies to high-performance rendering of time-series data.
Memorability: (d) Memorability defines how easy it is for users to reestablish their proficiency when they reuse an application after not having used it for a certain period.
(p) The criterion of memorability is of lesser importance for web-based geo-applications because the typical user as defined above accesses such applications several times a month. They usually also have some experience in using web-based applications. Thus while the learning curve for 4D geo-visualization applications may not be steep per se, memorability is without doubt enhanced when an easy-to-use and intuitive interface is used, which involves such parameters as effectiveness, efficiency, and satisfaction when portraying 4D geo-data on the web.
Errors: (d) This parameter indicates how many errors users make and how these errors affect the usage of an application, that is, how users recover from these errors.
(p) The application is designed to prevent the user from making mistakes; it does not even allow them to make errors in the input or control. This is because if many errors occur in an application, the user quickly loses interest in working with the application. Also, when an error occurs, the user must be able to resolve the problem independently.
Satisfaction: (d) This parameter describes users’ subjective experience with the application.
(p) Our application is designed to be easy to use and enable users to achieve their goals in a reasonable amount of time. Hence, users’ satisfaction is an important prerequisite for our application, furthering the goal of frequent use. To achieve the best possible user satisfaction, the interface of our application was designed based on well-established map-design guidelines (dual coding, data generalization, consistent color schemes, etc.) and such web-application design strategies as pre-caching, movable windows, hideable overlays, familiar navigation, and simple controls.
More detailed information about the criteria can be found in the ISO 9241-11 standard (International Organization for Standardization Citation2006) and in Nielsen (Citation1993). While we considered the parameters in question during the design phase of our 4D application, they have not been validated in a user study because such validation was beyond the scope of our research.
Design considerations
Apart from the usability criteria described in the previous subsection, several additional design decisions were taken into account to optimize the practicality and applicability of the concept of displaying 4D geo-data on the web.
Representing spatiotemporal, environmental phenomena by interactive 4D applications is a prevailing challenge. However, with an optimized design of the user interphase (Jobst and Germanichs Citation2007), map-based applications can offer new and more dynamic ways of presenting geospatial information. Consequently, we resolved that our application would have dynamic interaction, scale-based data sub-selection, graphical presentation of geographic features, and on-demand data visualization in a 4D web-based environment.
Another central design decision for the presented research was to aim for innovative and intuitive ways to cartographically illustrate spatiotemporal phenomena as dynamic processes. Thus, the spatiotemporal development of marine phenomena (salt concentration, sediment transport, nutrient flows, tide gauges, etc.) is presented in three spatial dimensions – including 3D navigation – to foster understanding of the natural phenomenon. This type of process illustration requires the integration of three spatial dimensions with the visualization of a temporal development. Because salt concentration or sediment transport are not equally distributed over the vertical water column, the visualization of the temporal development is important for estimating the ecologic impact of salt water along estuaries or where sediment could be dredged or deposited. In our research, point data sets for water-level measurements are represented as circles varying in size, while bathymetry is visualized using isolines. Using these symbologies together with color coding according to the legend, we tried to comply with the dual coding approach mentioned above. Like this, made it easier for the user to comprehend temporal developments in a spatial 3D context and thus understand the spatiotemporal process.
Validation – prototypical implementation
The concept of 4D visualization presented in this paper was validated through a prototypical implementation. This section contains a description of the scientific-technology evaluation and its architecture, the interface design, and the realization of the client-based visualization component using WebGL.
Technology evaluation
We decided to use WebGL as the processing and visualization technology for our prototype. This decision was taken after a thorough technology evaluation, which we conducted by considering the following criteria:
Web browser support: Is the technology natively supported in standard web browsers or are additional plug-ins required. This is an essential parameter if our technology is to be widely applicable.
Up-to-dateness: Maintenance, comprehensive documentation, and development of the software to handle future challenges are all features necessary for wide adoption and secure use.
Implementation complexity: This covers the effort required to implement an application using a particular technology and installation of additional plug-ins and software components.
Performance: Seamless operation of the technology on a standard PC, preferably with GPU-processing support.
Portability: Support for the most common browser technologies and operating systems.
Data integration capabilities: Ability to connect to and parse data sources that have different origins and formats.
Support for spatial coordinates: Ability of handling geographic coordinates including coordinate transformation and simple overlays either in native functionality or in external libraries.
3D rendering: Simplicity and native support for 3D geometries and scenes.
Costs and available licenses: Preferably, the software should be freely available to users to guarantee broad applicability.
summarizes the results of our technology evaluation which is not laid out here in great detail due to limitations to the length of the paper. We found that compared with all the other technologies considered, WebGL meets the above requirements best (in comparison with Java 3D, Silverlight, Stage3D, and Unity). The greatest advantage WebGL has is that it runs natively in the web browser without additional plug-ins. Because of this spatial analysis tasks can be performed directly in the browser using parallel computation techniques executed by a GPU instead of a traditional central processing unit, which operates in serial data handling mode. Thus, in terms of performance, WebGL (Khronos Group 2013) is eminently suitable for the development of efficient, interactive, responsive, and mobile web-based GI applications (2D, 3D, and 4D) and animated content. The complexity of WebGL is higher than that of Silverlight and Stage3D, both of which relying on specific and proprietary development environments and programming languages (Silverlight and ActionScript, respectively) that require an additional learning effort. Besides, ActionScript is continuously losing importance for web-based applications. WebGL handles geographic coordinates quite well, albeit slightly less so than Java 3D (GeoTools API, OSGeo’s Proj4J library, etc.) and Silverlight (ESRI ArcGIS Server API and external libraries). However, WebGL’s Three.JS framework and other libraries give the technology an edge over Stage3D, which does not offer native coordinate integration nor a suitable and easy-to-use ActionScript library.
Table 1. Evaluation results for web-based visualization technologies (+…well-suitable; O…conditionally suitable; −…insufficiently suitable).
As a result from our technology evaluation, the final architecture of the proposed application consists of three components: the client, the server, and the database. The web server is based on an Apache 2.0 engine with PHP 5.2 running on a SUSE Linux Enterprise Server. We use a PostgreSQL 8.3.2 database with the PostGIS 1.5.4 spatial extension. The application is hosted on a web server and the client can retrieve data through a WebGL-capable web browser.
Interface design
While developing the interface we took into account the core components of usability and various web-design principles. The intent was to help users to achieve their goals with maximum efficiency and enable intuitive use of the application. While implementing the objective of usability, we considered the following web-design principles: “make it direct”, “keep it lightweight”, “stay on the page”, “provide an invitation”, “use transitions”, and “react immediately” (Scott and Neil Citation2009).
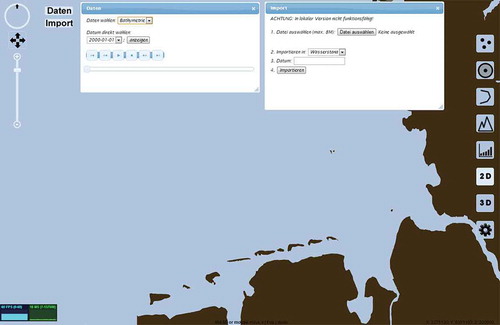
Data are displayed in the web-browser window without menu bars, tables of content, or complex toolbars. A simple navigation bar – loosely based on Google Earth’s navigation – is on the left of the window and a few essential tools for data representation are on the right. Among the tools included are a dataset selector, a time slider for 4D time-series visualization, a data import button for integrating external data sources, and a button for switching between 2D and 3D visualization. The tools can be hidden and are movable so that they do not impede the viewing of the data. shows the interface of the application.
Figure 1. The user interface for displaying marine geo-data in 4D.
Geo-data and time-series visualization
The visualization of spatial data has been implemented in WebGL in combination with the Three.js framework (Three.js Citation2013). WebGL has direct access to the computing unit of the graphics card and is therefore suitable for displaying a large number of data points. Three.js makes it easier for developers to create a scene as they can rely on such tools as cameras, shaders, and lights to draw lines, spheres, particles, or a plane and some other tools for the representation of the data. Various settings such as appearance, field of view for the scene or even the color, texture or size of objects can be easily adjusted.
The initial view displays a coastline polygon in 2D to help the user with navigation in space. The actual spatial data that are presented in the application comprise bathymetry line data, dot-shaped water-level measurements, and interpolated bathymetry data such as a 3D plane. shows the visualization of (a) bathymetry data in 2D; and (b) a time series for a measurement point – after the user has clicked onto a specific measurement point. The temporal development of a parameter can either be displayed in a space-time animation (both in two and three spatial dimensions) or in a time-series graph as shown in (b).
Figure 2. (a) 2D display of bathymetry data. (b) 2D display of water-level measurements and time-series diagram for a single measurement station.
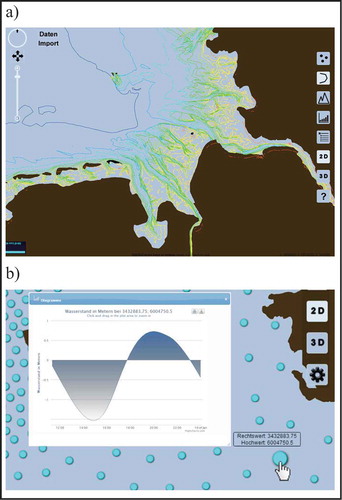
If the user clicks on a measurement point, all available water-level datasets for this particular station are displayed in a graph. With an integrated, intuitive “play bar” (see white box in ), the user can step through the available time-series datasets and follow the rising (or ebbing) tide in the North Sea, for instance.
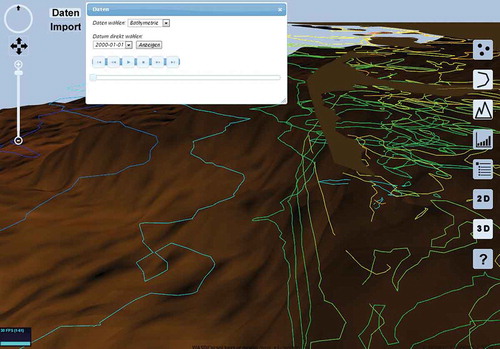
We also implemented a 3D view of the scene by integrating a height map interpolated in Portable Networks Graphics format in a terrain shader to convey a quasi-realistic landscape impression. The height map is used as a displacement map on a plane in order to represent depth of the seafloor in three dimensions. To emphasize the differences in height between the individual measurements, the z-coordinates are stretched by the factor of 1000 and shown in different colors (see ) – compare the dual coding approach mentioned above.
Figure 3. Display of the bathymetry as a 3D time series. The colored lines show shallow (shown in red) and deep (in blue) bathymetric lines near the Sylt Island.
Discussion and outlook
This section discusses the presented approach and the produced results, points out its limitations and pin-points future research avenues that need to be tackled in the area of web-based 4D visualization.
Advantages of multi-temporal geo-data in web-based environments
The distinct advantages of web-based geo-data visualization are threefold. First, users do not need expert knowledge to use GIS tools as only simple web interfaces are provided. Second, users do not need to buy expensive and resource-consuming analysis and visualization software as our 4D visualization application works with free and standard software that can be downloaded from the Internet. Third, marine geo-data can be made accessible to a far broader spectrum of users by displaying them to the web, ranging from private persons who want to know about pollutant concentration in close-by water bodies to professionals working in the marine sector and political decision-takers.
Limitations
The limitations are mostly due to a lack of fully developed technologies to support WebGL, including the necessity of a graphics-card supporting WebGL, a browser with a WebGL implementation, etc. However, we expect that WebGL support in terms of graphics cards and browsers will continue to improve.
One central issue with our particular application, but also with web-based geo-applications in general, is handling large data volumes. Just like with every browser-based application, not only loading and processing, but rendering large numbers of spatial datasets remains to be challenging. We implemented a caching mechanism to minimize the preprocessing effort in the browser, but an intelligent visualization method (generalization, integration of visibility and occlusion analysis, or scale-based data sub-selection) was not developed.
Furthermore, the our application in its present form is not capable of substituting current modeling and visualization software as used in the field of marine data analytics. Several issues need to be resolved, including the fact that complex numerical modeling systems are run on high-end supercomputers, producing massive data volumes, or integrating data via standardized service-based infrastructures (Resch Citation2013). As WebGL applications actively use a computer’s graphics card, the performance depends on local conditions, limiting the ability for processing and displaying data points.
The design of our system focuses on casual web users, but it is not restricted to them; experts can use it as well. A typical task performed by our application is the comparison of numerical results with real-world measurements. Like this, the functionality of the modeling core and the parameter settings can be validated. In turn, a visualization of the model results can support this validation process. However, experts require additional analysis tools to perform spatial calculations similar to those performed by WebGIS applications. Such tools possibly be integrated under consideration of performance issues, but this has not been done in the presented research.
Experts need to know the results of a marine modeling process for further analysis of simulation results. There are several approaches to document and disseminate descriptions of model results. Their integration into the SDI can however be difficult as the SDI metadata standards may not be applicable to model description (Wosniok and Lehfeldt Citation2013). This aspect deserves further research.
Finally, we identified a number of limitations, including different behavior in different web browsers (just like in any web application), finding an optimized and easily comprehensible color scheme, or finding the appropriate trade-off between functionality and simplicity of use.
Future research avenues in map-based 4D Visualization on the web
A fundamental challenge for future research in the area of map-based 4D visualization on the Internet is to identify reliable expressive relationships between thematic data structures and graphical depiction. Even though a number of possible graphical variations have been identified for 4D map design, a true mapping of these combinations of graphical variables to thematic expressivity is still missing. The visual variables for the original 2D context (cp. Bertin Citation1974) are a subset of all thinkable and technically modifiable graphical variables, that is, the combinations that allow reliable mappings from data to visual depiction. However, previous research initiatives often mix these concepts, which in the end dilutes both. Particularly in 3D web-based computer screen environments (as applicable for the concept presented in this paper), size, color, texture, and lighting effects need to interact to convey the illusion of spatial depth. This is due to the profound inverse optics problem as it is also encountered in traditional 2D maps (Reimer Citation2011) that severely limits to the expressive capabilities of many graphical modifications to actually achieve dual coding (Dransch Citation1997), that is, simultaneous variations of graphical variables like color, shape, intensity, or the z-value extrusion.
Another essential future research question, which arose in the course of our research, is how to represent time in 4D visualizations. While previous approaches have represented time as a compressed time axis, current concepts – including ours presented in this paper – mostly rely on temporal animations as a time series of static maps, where each map represents a single time slice as a sequence of states. Another popular representation is to indicate movements in single static maps, for instance, by using arrows, flow lines, or movement patterns (Sagl et al. Citation2012). In this area, it will be essential to find out more about the cognitive and perceptive processes that determine how humans actually perceive time in 4D processes and which opportunities web-based environments offer (transparency, dynamic placement of time slice maps, fading effects, motion, etc.). This in turn will also decide which ways can be found for alternative representations of the time dimension.
A related issue is how we can foster the user’s understanding of the temporal context in dynamic 4D maps. In other words, new methods are required to optimize a viewer’s perception of a spatiotemporal development. In case of the presented research in the area of marine geo-data, this could potentially be achieved by small 2D maps, which are lined up as a screen overlay. Another method could be the integration of diagrams (histograms, statistics, etc.) to display dynamic developments, as presented in our approach. However, even though these methods are only applicable in web-based and computer screen environments (and not in traditional maps), they might be considered non-innovative methods that rely on current state of the art and do not introduce a new paradigm of representing the temporal dimension.
A common but highly relevant question is to find methods for defining optimized temporal generalization. In previous approaches, temporal generalization has only been optimized on a per-application basis as the temporal granularity strongly depends on the displayed data, the actual application, and the goals or tasks the user wants to achieve. For example, weekly aggregation might be suitable to identify the effect of sedimentary deposition in a basin, but a 1-min aggregation interval might be necessary for detecting flood water events for an early-warning system. This problem seems to be of generic nature and needs to be parameterized to be solvable. For web-based applications, we can imagine dynamic scaling techniques for temporal generalization – evolving from methods that already exist for spatial generalization.
Finally, the related issue of the influence of the visualization complexity on the user, varying from simple abstraction to (pseudo-)photorealistic representation of the spatiotemporal phenomenon, has not been extensively studied. Most users of 4D interfaces find a pseudo-photorealistic illustration of natural phenomena that is closely related to the objects’ physical appearance more helpful because it conveys a more realistic and comprehensible view on a real-world situation. This makes communicating the actual real-world processes easier to understand and interpret. However, no generic methods and easy-to-use base technologies currently exist for web-based environments, which makes the implementation of pseudo-realistic visualizations extremely laborious.
Further open questions include the definition of graphical variables for web-based 3D and 4D visualizations; optimized, dynamic coloring strategies (cp. “dual coding” as mentioned earlier); and the development of guidelines for enhanced user experience design (Resch and Zimmer Citation2013) in 3D/4D cartographic applications.
Conclusion
Ecologic protection, energy production, transportation, or tourism constitute competing interests in European coastal zones. Thus, with the comprehensible interest from different stakeholders, scientific foundations are required for all large-scale interferences changing the current state of coastal areas. This also calls for geoinformatics-based solutions as data analysis and simulation results need to be presented to the broad public in an easily understandable, yet comprehensive manner.
Integrating time-varying geo-information into map-based visualization systems on the Internet continues to be a methodological and technological challenge. Consequently, users of web-based geo-visualization systems often suffer from a lack of well-known interaction capabilities or from non-optimal data presentation. On the one hand, this means that systems that are not thoroughly designed are often not easily usable for people without much experience in using map-based tools. On the other hand, too much simplification might result in a too high level of abstraction in conveying a complex spatiotemporal geographic process, which results in a perception of the process that is much disconnected from the physical world, that is, the transfer effort to interpret information from the virtual environment becomes overly large.
In this paper, we addressed the research questions (presented in the introduction) in the area of requirements for efficient and effective 4D visualization of spatial data on the Internet. These include the definition of usability criteria, an evaluation of applicable base technology, and a prototypical realization of the concept that we developed to portray spatial data in web-based applications. The prototype application takes into account usability-related criteria, performance parameters, implementation effort required, and the need to convey variety of information to support decision-making on multiple levels. We solved the latter by displaying time-series diagrams of environmental parameters. To validate the concept we used the WebGL (Khronos Group Citation2013). The major advancements of the presented research are the clear and use case driven definition of usability criteria, the scientific evaluation of base technologies, and the focus on specific requirements for displaying a variety of marine geo-data.
During our research, we identified a number of research questions that need to be investigated in the near future, including the mapping of graphical variables to thematic expressivity, representation of the time dimension in 4D systems, optimized and generic temporal generalization, and the possibility of integrating and creating (pseudo-)photorealistic illustrations in web-based geo-visualization systems.
Acknowledgments
The authors would like to thank all involved research groups at Harvard University’s Center for Geographical Analysis, at the University of Heidelberg and at the University of Osnabrueck for offering their valuable thoughts. Furthermore, a special thanks goes to the BAW employees who voluntarily helped in the conception, evaluation, and improvement of our research. This research has been supported by the Klaus Tschira Stiftung gGmbH. Finally, the authors would like to thank Michael Bauer from GEOkomm Verband der GEOInformationswirtschaft Berlin/Brandenburg e.V. for his support in conceiving the research questions and defining the use case.
References
- Aditya, T., and M. J. Kraak. 2005. “Reengineering the Geoportal: Applying HCI and Geovisualization Disciplines.” In Proceedings of the 11th EC-GI & GIS Workshop, Alghero, July 2005.
- Analytical Graphics, Inc. 2013. “Cesium – WebGL Virtual Globe and Map Engine.” Accessed December 15, 2013. http://cesiumjs.org
- Bertin, J. (1974) Sémiologie Graphique. Paris: Editions Gauthier-Villars. German Translation: Jensch, G., Schade, D., Scharfe, W. (1974) Graphische Semiologie.Diagramme – Netze - Karten. Berlin: Walter de Gruyter.
- Dransch, D. 1997. “Medienpsychologische Aspekte Beim Einsatz Von Multimedia in GIS.” In Kartografische Schriften, Band 2, edited by Deutsche Gesellschaft für Kartographie (DGfK), 26–30. Bonn: Kirschbaum Verlag.
- Feng, L., C. Wang, C. Li, and Z. Li. 2011. “A Research for 3D WebGIS Based on WebGL.” Proceedings of the International Conference on Computer Science and Network Technology, Harbin, December 24–26, 348–351.
- Few, R., K. Brown, and E. L. Tompkins. 2007. “Public Participation and Climate Change Adaptation: Avoiding the Illusion of Inclusion.” Climate Policy 7 (1): 46–59.
- Garlandini, S., and S. I. Fabrikant. 2009. “Evaluating the Effectiveness and Efficiency of Visual Variables for Geographic Information Visualization.” In COSIT 2009, LNCS 5756, edited by K. Stewart Hornsby and N. Li, 195–211. Berlin: Springer.
- Hering, N., M. Rünz, L. Sarnecki, and L. Priese. 2011. “3DCIS: A Real-Time Browser-Rendered 3D Campus Information System Based on Webgl.” The 2011 world congress in computer science, computer engineering and applied computing. Worldcomp 2011, Las Vegas, NV, July 18–21.
- International Organization for Standardization. 2006. Part 11 Guidance on Usability: ISO 9241 Ergonomics of Human-system Interaction. Geneva: International Organization for Standardization.
- Jobst, M., and T. Germanichs. 2007. “The Employment of 3D in Cartography – An Overview.” In Multimedia Cartography, edited by W. Cartwright, M. P. Peterson, and G. Gartner, 217–228. Heidelberg: Springer.
- Khronos Group. 2013. “WebGL – OpenGL ES 2.0 for the Web.” Accessed December 16, 2013. http://www.khronos.org/webgl
- Klokan Technologies. 2013. “WebGL Earth - open source 3D digital globe written in JavaScript.” Accessed December 18, 2013. http://www.webglearth.org
- Kluwe, R. H., and P. Schulze. 1994. “Gestaltungsgrundsätze für komplexe Informationsdarstellung. Ergonomische Studien, Report no. 37.” Bundesamt für Wehrtechnik und Beschaffung, Koblenz.
- Kulawiak, M., A. Prospathopoulos, L. Perivoliotis, M. Luba, S. Kioroglou, and A. Stepnowski. 2010. “Interactive Visualization of Marine Pollution Monitoring and Forecasting Data Via a Web-Based GIS.” Computers & Geosciences 36: 1069–1080. doi:10.1016/j.cageo.2010.02.008.
- Loesch, B., M. Christen, and S. Beniker. 2012. “Openwebglobe – An Open Source SDK for Creating Large-Scale Virtual Globes on a WebGL Basis”. International archives of the photogrammetry, remote sensing and spatial information sciences, XXII ISPRS Congress, Vol. XXXIX-B4/2012, Melbourne, August 25–September 1, 195–200.
- Milbradt, P. 2012. “Analysis of the Morphodynamics of the German North Seas Coast on the Basis of a Functional Seabed Model.” In Proceedings of the 10th International Conference on Hydroscience and Engineering (ICHE-2012), Orlando, FL, November 4–7.
- Ming, W. 2008. “A 3D Web GIS System Based on VRML and X3D.” In Proceedings of 2nd International Conference of Genetic and Evolutionarty Computing, WGEC ‘08, Hubei, September 25–26, 197–200.
- Nielsen, J. 1993. Usability Engineering. San Francisco, CA: Morgan Kaufmann.
- Nivala, A. M., S. Brewster, and L. T. Sarjakoski. 2008. “Usability Evaluation of Web Mapping Sites.” The Cartographic Journal 45 (2): 129–138.
- Reimer, A. 2011. “Squaring the Circle? Bivariate Colour Maps and Jacques Bertin’s Concept of Disassociation.” In Proceedings of the International Cartographic Conference ICC, Paris, July 3–8.
- Resch, B. 2013. “People as Sensors and Collective Sensing - Contextual Observations Complementing Geo-Sensor Network Measurements.” In Advances in Location-Based Services, edited by J. Krisp, 391–406. Berlin: Springer.
- Resch, B., F. Hillen, A. Reimer, and W. Spitzer. 2013. “Towards 4D Cartography – Four-Dimensional Dynamic Maps for Understanding Spatio-Temporal Correlations in Lightning Events.” The Cartographic Journal, 50 (3), international cartographic conference 2013, Dresden. Special Issue August 2013, 266–275.
- Resch, B., and B. Zimmer. 2013. “User Experience Design in Professional Map-Based Geo-Portals.” ISPRS International Journal of Geo-Information 2 (4): 1015–1037. doi:10.3390/ijgi2041015.
- Sagl, G., B. Resch, B. Hawelka, and E. Beinat. 2012. “From Social Sensor Data to Collective Human Behaviour Patterns: Analysing and Visualising Spatio-Temporal Dynamics in Selected Environments.” In Gi_Forum 2012: Geovisualization, Society and Learning, edited by T. Jekel, A. Car, J. Strobl, and G. Griesebner, 54–63. Berlin: VDE VERLAG GmbH.
- Scott, B., and T. Neil. 2009. Designing Web Interfaces: Principles and Patterns for Rich Interactions. Sebastopol, CA: O’Reilly Media.
- Shan, J. 1998. “Visualizing 3-D Geographical Data with VRML.” Proceedings of the Computer Graphics International 98, Hannover, June 22–24, 108–110.
- Thomas, J. J., and K. A. Cook. 2006. “A Visual Analytics Agenda.” IEEE Computer Graphics and Applications 26 (1): 10–13. doi:10.1109/MCG.2006.5.
- Three.js. 2013. “JavaScript 3D Library.” Accessed September 27, 2013. http://threejs.org
- Watanabe, M., S. Yonemura, and Y. Asano. 2009. “Investigation of Web Usability Based on the Dialogue Principles.” In Human Centered Design, Lecture Notes in Computer Science 5619. edited by M. Kurosu, 825–832. Berlin: Springer.
- Wosniok, C., and R. Lehfeldt. 2013. “A Metadata-Driven Management System for Numerical Modeling.” In Proceedings of OCEANS ’13 MTS/IEEE, San Diego, CA, September 23–26.
- Zhu, C., E. C. Tan, and K. Y. Chan. 2003. “3D Terrain Visualization for Web GIS.” In Proceedings of the Map Asia 2003 Conference, Kuala Lumpur, October 13–15.
- Zipf, A. 2011. “Crowdsourced GI - Beginn Einer Neuen Ära Freier Geodaten?” Proceedings of the FOSSGIS 2011 Conference, Heidelberg, April 5–7.