
Abstract
The design of methods and tools to build adequate representations of complex geographical phenomena in a way that spatial patterns are emphasized is one of the core objectives of GIScience. In this paper, we build on the concept of geons as a strategy to represent and analyze latent spatial phenomena across different geographical scales (local, national, regional) incorporating domain-specific expert knowledge. Focusing on two types, we illustrate and exemplify how geons are generated and explored. So-called composite geons represent functional land-use classes, required for regional planning purposes. They are created via class modeling to translate interpretation schemes from mapping keys. Integrated geons, on the other hand, address abstract, yet policy-relevant phenomena such as societal vulnerability to hazards. They are delineated by regionalizing continuous geospatial data sets representing relevant indicators in a multidimensional variable space. Using the geon approach, we create spatially exhaustive sets of units, scalable to the level of policy intervention, homogenous in their domain-specific response, and independent from any predefined boundaries. From a GIScience perspective, we discuss either type of geons in a semantic hierarchy of geographic information constructs. Despite its validity for decision-making and its transferability across scales and application fields, the delineation of geons requires further methodological research to assess their statistical and conceptual robustness.
1. Motivation
The design of strategies to adequately represent complex geographical phenomena is one of the core objectives of the GIScience discipline (Longley et al. Citation2001). The transformation of complex, continuous spatial information in a way that spatial patterns are identifiable and recognized in manageable areal aggregates (Abler, Adams, and Gould Citation1971) remains a challenge in terms of both scientific soundness and practical implementation (Wise, Haining, and Ma Citation2001). This paper investigates how regionalization as a geographic principle, enhanced with related spatial analysis techniques may support this ambition. We revisit the geon concept (Lang et al. Citation2008) as a specific regionalization strategy and highlight findings from various studies illustrating the range of applicability of this concept. Therefore, the paper aims at (1) elaborating on the components of the geon approach, how it builds upon existing regionalization methods and how it challenges them; (2) showcasing the transferability of the approach to different policy realms and geographical scales; and (3) discussing the approach from an information-based ontology perspective and reflecting on its validation.
1.1. Regionalization and geons
The main objectives of regionalization (Berry Citation1967) are to (1) organize, visualize, and synthesize the information contained in multivariate spatial data (Long, Nelson, and Wulder Citation2010), (2) reduce data dimensionality (Ng and Han Citation2002), contributing to inductive theory (Johnston Citation1970), (3) minimize the effects of outliers or inaccuracies in the data, which facilitates the visualization and interpretation of information in maps, and (4) limit the sensitivity due to data fidelity (‘salt-and-pepper’ effect) by aggregating the original units (e.g. pixels) into larger zones (Blaschke and Strobl Citation2001; Wise, Haining, and Ma Citation2001). Following these objectives, regionalization implies an intentional loss in spatial as well as attribute detail that would act as noise otherwise (Hancock Citation1993). In spatial science, regionalization is treated as a zone definition problem, (Fotheringham and Wong Citation1991), technically realized by performing spatially constrained aggregation (Duque and Suriñach Citation2006). Therefore, a synonym for regionalization is ‘spatial classification’ (Wise, Haining, and Ma Citation2001), as the definition of regions is considered a special type of classification problems (Tomanev Citation2009). A recent overview of regionalization techniques is provided by Guo (Citation2008), who categorizes regionalization methods in four different groups based on the differences how the spatial constraints are implemented: (1) nonspatial clustering followed by spatial processing; (2) nonspatial clustering with a spatially weighted dissimilarity measure; (3) trial-and-error search and optimization; (4) spatially constrained clustering and partitioning (804). Spatial contiguity is the critical criterion of a region, as opposed to type (Abler, Adams, and Gould Citation1971), with location treated as an explicit parameter (Berry Citation1968). Spatial contiguity was reported to have minor effects on the loss of detail during aggregations (Spence Citation1961). The geographic principle of spatial autocorrelation, assuming neighboring locations to bear similar properties (Tobler Citation1970), supports this observation. Region building assumes the interdependency of spatial structure and spatial variables (Berry Citation1968), so that uniform behavior alters with transitions to a different location along a certain gradient or boundary. With the approach presented and discussed in this paper, we strive to optimize the delineation of such boundaries in terms of statistical robustness and conceptual validity.
Geons were defined rather broadly as spatial units that are homogenous in terms of varying space–time phenomena under policy concern (Lang et al. Citation2008). Drawing from experiences in various application domains, we suggest to specify this generic concept as follows: A geon (derived from Greek gē (Γῆ) = land, earth and the suffix -on = something being) is a type of region, semiautomatically delineated with expert knowledge incorporated, scaled and of uniform response to a phenomenon under space-related policy concern. The aim of generating geons is thus to map policy-relevant spatial phenomena in an adaptive and expert-validated manner, commensurate to the respective scale of intervention. This helps to visualize and comprehend the spatial distribution of such phenomena and thereby to better plan, locate and evaluate intervention measures (Kienberger et al. Citation2009). The average size, composition, and internal homogeneity of geons are controllable by logical models that are fed into the regionalization process.
Terminologically, ‘geo-on’ suggests synonymy with ‘geo-atom’ (Goodchild et al. Citation1999; Goodchild, Yuan, and Cova Citation2007), or even more radical with the ‘Elementary_geoParticle’ (Voudouris Citation2010). But geons do not claim ‘atomicity’ (Masolo and Vieu Citation1999) as something undividable. In fact, a geon is not the smallest possible unit in space or time, as topons or chronons (Couclelis Citation2010), but the one that is best suited to the given application context (‘as small as necessary, as big as possible’). By generating an aggregate unit that has its own meaning and representativeness, the composition of a geon starts with a purpose-driven exercise. In the composite indicator community, it is widely acknowledged that integrating single indicators into an index better represents systemic, i.e., holistic aspects of the phenomenon addressed (Nardo Citation2005). Individual grid cells with a composite indicator value, as in multi criteria analysis (Malczewski Citation1999), which may represent an Elementary_geoParticle, would not qualify as a geon due to a cell’s fixed spatial definition. A geon is a scale-specific spatial object with stability features such as minimized inner variance and gradients toward the outside through vector encoding.
1.2. Domain-specific expert-based regionalization
According to Johnston (Citation1968), there is no ‘a priori fixed set of regions’ to be built. The spatial analytical problem that arises with the zone definition problem has been widely discussed as the modifiable areal unit problem (MAUP) (Openshaw Citation1984) with effects on both scaling and zoning (Páez and Scott Citation2004; Maclaurin, Leyk, and Hunter Citation2012). Areal units can be generated at different scales and in different (though equally plausible) categorizations (Wise, Haining, and Ma Citation2001; Guo and Bhat Citation2004). This is carried out in a way that the resulting regions are ‘conveniently related to the phenomena under examination’ (2). In this line of argument, Lang (Citation2008) uses the term ‘conditioned information’ to underline that this process entails the creation of new geographies as a flexible, yet statistically robust and (user-) validated unitization of space. As for the ‘equally plausible’, we argue that the validity of such delineations (Lang et al. Citation2010) is defined by the expert domain addressed. With respect to the level of expert interaction and obeying the definition given above, the following specifications are required to delineate geons: (1) a multidimensional set of variables representing the phenomenon under concern (e.g. spectral behavior, interpolated indicators, etc.); (2) the definition of internal homogeneity (functional composition, dimensional weights, etc.); (3) the target scale (adapted to the scale of intervention measures). The number of generated regions is a function of these aspects, but is not specified upfront, as, for example, in the regionalization with constrained clustering and partitioning tool (Guo Citation2008).
We utilize the geon approach in two ways to accomplish domain-specific (i.e., expert-based) and semi-automated regionalization. We generate composite objects using class models (Tiede et al. Citation2010) applied on multispectral image data in an analytical, taxonomic process and following an advanced mapping scheme for complex (land-use) classes (Lang et al. Citation2010). We regionalize a multiple set of indicators in a synthetic manner (Grigg Citation1967) to represent complex latent phenomena such as a society’s vulnerability to hazards (Kienberger et al. Citation2009). In the following section, we explain and exemplify specifics of either strategy.
2. Geons representing functional land-use classes
2.1. Rationale
A specific type of multicomponent regionalization (Grigg Citation1967) is region-based image segmentation, whose overarching principle is to generate image objects based on specific homogeneity criteria and spatial contiguity (Abler, Adams, and Gould Citation1971). An algorithm, widely used in object-based image analysis (OBIA) (Blaschke Citation2010), is the multi-resolution segmentation procedure (Baatz and Schäpe Citation2000). It generates homogenous image segments in a nested hierarchy of scaled representations. Spectral information is aggregated in a scale-adaptive manner, while loss of detail is minimized (Drăguţ et al. Citation2014). When aggregating the original pixel information in a stepwise manner, the higher-level objects’ internal heterogeneity is increasing, leading to more functional homogeneity in the sense of Spence (Citation1961). Using this strategy, some composite classes can be directly delineated by image segmentation, for example, forest stands with limited internal heterogeneity as composed by tree species with similar spectral behavior (Strasser et al. Citation2014). However, most often composite classes are defined by internal heterogeneity that exceeds the capability of state-of-the-art segmentation algorithms (Lang et al. Citation2010). To overcome this, we use class modeling that utilizes spatial and hierarchical relationships of neighboring homogenous building blocks to model composite real-world objects (Tiede et al. Citation2010). Class modeling is deductive in the way that image information is structured into a priori logical divisions by ontology-like rule systems that employ structural and hierarchical features. We attain taxonomic classes (e.g. an orchard, a suburban area, an informal settlement, a mixed forest stand, etc.), that are spatial constellations of a set of subunits (building blocks). We use a specific body plan to compile the targeted composite objects, whose conceptual boundaries may be perceived by experts (and intersubjectively agreed upon in reality) as functional bona fide units (Smith Citation1994).
2.2. Constructing composite geons
Class modeling can be applied to delineate aggregated spatial land-use units relevant to regional planning tasks based on satellite remote sensing data (Tiede et al. Citation2010). It implies iterative segmentation and classification steps (Tiede et al. Citation2010; Lang Citation2008). The first step is region-based segmentation and labeling of the building blocks. In this case, these are homogenous land-use units such as grassland patches or agricultural fields. A rule-based production system formalizes the spatial and hierarchical composition of the target classes, based on the constellation of subunits and auxiliary data sets as cues for particular additional features. The rule sets incorporate fuzzy rules (Zadeh Citation1965) to better represent the vagueness of class descriptions that are imposed by the mapping key (e.g. ‘fairly compact’). Altogether, the process for generating functional units is a cyclic one (see ), overcoming the limitations of direct object delineations using region-based segmentation algorithms.
Figure 1. Workflow for class modeling of composite geons (here: BTCs). The first step, generation of building blocks, is not shown. Reshaping of units within the class modeling process by manual interaction is possible (see dashed line).
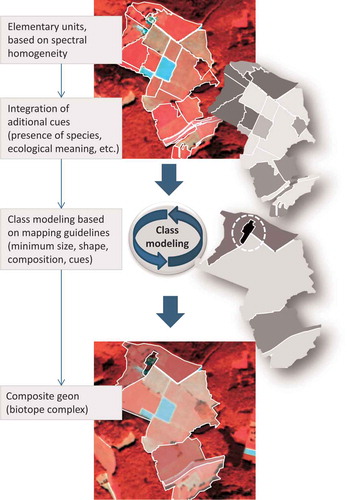
So-called biotope complexes (BTCs, see ) were modeled as functional units composed by elementary units following an existing mapping key (Landesanstalt-fuer-Umweltschutz Citation2003). The definitions of BTC were taken from guidelines for expert mapping in field campaigns, and were adapted for automated extraction from remotely sensed data. To be manageable and scaled to policy implementation, BTC, in general, are defined as (1) functionally homogenous, i.e., potentially composed by different land-use types (e.g. a mix of grassland and arable land); (2) having certain size limitations (minimum and maximum area, e.g. 2 hectares); (3) bearing a fairly compact shape.
Figure 2. Expert- and ground-validated BTCs representing the functional BTC low-structured arable land (yellow tones), and mixed arable land (green tones) with underlying SPOT-5 false-color satellite imagery. Extent of subset: approx. 5.5 km, minimum size of BTC: 2 ha, framed figures: number of building blocks [squared: low-structured arable land, round: mixed arable land]).
![Figure 2. Expert- and ground-validated BTCs representing the functional BTC low-structured arable land (yellow tones), and mixed arable land (green tones) with underlying SPOT-5 false-color satellite imagery. Extent of subset: approx. 5.5 km, minimum size of BTC: 2 ha, framed figures: number of building blocks [squared: low-structured arable land, round: mixed arable land]).](/cms/asset/a2f8756b-69a4-4c69-8b08-dbfc036d8a3f/tcag_a_902755_f0002_c.jpg)
2.3. Exploring
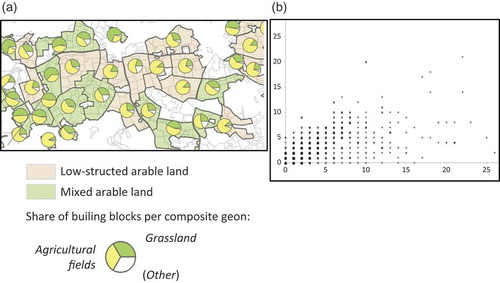
A representative, stratified sample of 15% of the total number of BTCs was taken from both composite classes, i.e., low-structured arable land and mixed arable land. We analyzed the selected 724 BTCs (473 low-structured arable, 251 mixed arable) in terms of size and composition as well as form and edge characteristics using the ArcGIS extension V-LATE (Lang and Tiede Citation2003). shows, in a small subset, the proportion of elementary units forming the different BTCs. The ratio and configuration of building blocks, ‘fields’ and ‘grassland’, are mainly taken into consideration when delineating the BTC. In addition, specific features are considered as cues for ecological significance (summarized as ‘other’). The plot in reveals the composition envelopes of the BTCs. Each dot represents a tuple [nfields) | ngrassland] for each BTC, differentiated by BTC type.
Figure 3. (a) Pie charts showing shares of building blocks, ‘fields’ and ‘grassland’. (b) Number of building blocks (horizontal axis: ‘fields’, vertical axis: ‘grassland’): ‘ + ’ represent BTCs ‘low-structure arable’, ‘x’ represents BTCs ‘mixed arable’.
summarizes the quantitative analysis of BTC composition in terms of number, size, and distribution of building blocks. In addition, some spatial metrics were calculated to characterize form, edge length, and configuration (adjacency) of BTCs.
Table 1. Characteristics of composite geons on BTC and BB level, not considering class ‘other’ (BTC = biotope complex, BB = building block, ha = hectares).
3. Geons representing multidimensional spatial phenomena
3.1. Rationale
Multidimensional complex phenomena varying in space, such as a society’s vulnerability to natural hazards or a landscape’s sensitivity to human impact, require a more inductive approach (Johnston Citation1970) to spatial classification. We consider multidimensional (latent) spatial phenomena as emerging from the specific arrangement of their constituting units. Using the geon approach, we delineate the units that are scaled, compact, and manageable from a policy perspective. The derived units – field objects (Goodchild, Yuan, and Cova Citation2007) that divide space in plenum (Yuan Citation2001) – respond uniformly to the phenomenon. A translation into objects (Cova and Goodchild Citation2002) is thinkable, but not done yet due to the lack of nominal categories. We operationalize the complex phenomenon by setting up a hierarchical conceptual model of it and approximate it by an expert-selected set of (spatialized) indicators (Kienberger et al. Citation2009). An integrated value (e.g. an index) is assigned to the generated units and acts as a spatial composite indicator (Hagenlocher et al. Citation2014) or meta-indicator (Lang et al. Citation2008). Hence, we call this type ‘integrated geons’.
3.2. Constructing integrated geons
Integrated geons are delineated using the above-mentioned multi-resolution segmentation algorithm. Regionalizing a multivariate set of indicators is done in an advanced clustering strategy called global mutual best fitting (Baatz and Schäpe Citation2000). The scale (or scales) of the generated units can be determined by parameterization, that is commonly determined by variance-based statistical evaluation (Drăguţ et al. Citation2014) and expert validation. Kienberger et al. (Citation2009) used multi-resolution segmentation generating a geon-scape for assessing place-based vulnerability to floods. The approach of ‘segmenting’ multiple indicators (instead of multiple spectral bands) was transferred to other geographical regions and other application domains such as disaster risk reduction (Kienberger Citation2012), hotspot analysis of cumulative climate change impacts (Hagenlocher et al. Citation2014), as well as landscape sensitivity analysis for strategic environmental impact assessments (Pernkopf and Lang Citation2011). shows geon-scapes generated in these four studies. A comparative characterization of them is given in .
Figure 4. Overview of four geonscapes to map latent phenomena for different policy domains at different geographical scales (see text for further explanations).
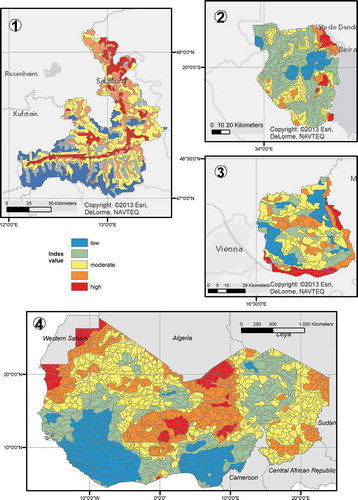
Table 2. Study area, geographic scale, dimensionality of phenomenon, and number/size of generated geons in four policy domains (AT = Austria, MZ = Mozambique, CILSS = Permanent Interstate Committee for Drought Control in the Sahel, MSI = mean shape index).
The workflow to build integrated geons comprises five major stages that can be adapted according to the specific application scenario: (1) definition of a hierarchical conceptual framework for systematizing and operationalizing the multidimensional phenomenon of interest; (2) indicator selection, data preprocessing and statistical analysis; (3) weighting and aggregation of the indicators (through regionalization); (4) robustness analysis; and finally (5) visualizing and exploring results.
The definition of the conceptual framework is an important first stage, as it specifies how the phenomenon under investigation will be approached. Such conceptual frameworks are usually based on theories from different scientific disciplines, and are developed to provide guidance how to structure and model the specific phenomenon. The same phenomenon might also be operationalized differently, depending on the scientific discipline and its theories. The ‘appropriateness’ of the framework depends on the context of the study, as well as on the complex phenomena that are approached (e.g. vulnerability, climate change impact, etc.). Within this initial stage, a first selection of indicators, which represent the different dimensions or main aspects of the theoretical framework, is carried out. Indicators should be salient, credible, legitimate (Birkmann Citation2006; Moldan and Dahl Citation2007) Next to empirical evidence, they may be selected based on a systematic review of literature or expert consultation, etc. For instance, Kienberger (Citation2012) integrated the knowledge of disaster risk experts as well as participatory local community approaches to identify a representative set of indicators for modeling vulnerability to floods. Data for the indicators are derived from available geospatial data sets, Earth observation-based proxy indicators, or ancillary data sets (e.g. census data, household surveys, etc.).
In the second stage, different statistical preprocessing routines are used to establish a final and statistically sound set of indicators. This includes the transformation of the data to continuous grids, the transformation into relative measures (if required), as well as the identification of existing multicollinearities in the data. We use normalization techniques to render the different indicator values comparable before aggregating them. If indicators need to be aggregated to subindices before regionalizing them (e.g. weighted aggregation of different age groups), traditional multi-criteria decision analysis approaches (Carver Citation1991; Malczewski Citation1999) are applied (Kienberger et al. Citation2009).
The geons as such are delineated in the third stage by regionalizing the n-dimensional variable space, where n is the number of indicators. The average size and shape of the resulting geons can be controlled via parameterization of the algorithms. It also reflects the spatial characteristics and attributes of the selected indicators, as well as weights that were assigned to them (e.g. expert opinion, weights based on factor analysis). If empirical evidence is proven for the relationships between indicators, it can be integrated as an alternative to expert knowledge, but this is merely the case (as yet). The final index value for each geon is calculated by the (weighted) magnitude of the resulting vector. Compared to existing aggregation concepts (e.g. arithmetic or geometric aggregation), the vector magnitude is a powerful method as it depicts the distance and position of each geon within the variable space (Kienberger et al. Citation2009). Vector magnitude, and specifically its change, has been applied in the field of remote sensing to improve methods for change detection (Lambin and Ehrlich Citation1997), also in neurosciences (Sharma, Angelucci, and Sur Citation2000) and document indexing (Salton, Wong, and Yang Citation1975). To ease the interpretation of the resulting index values, the output is standardized to a value range (e.g. [0 | 1] representing levels between (very) low and (very) high.
3.3. Exploring
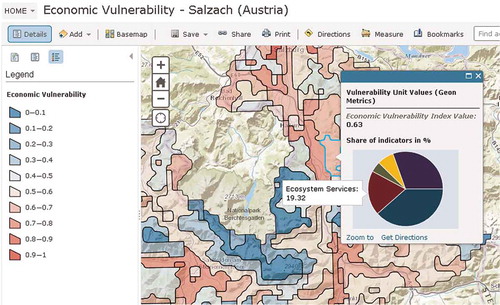
The characterization of the resulting index values in terms of its contributing indicators originates from Hancock (Citation1993) in his work on computer-aided regionalization. He analyzed units in terms of their composition using multi-frame symbols to support the understanding of the synthesis of the contributing indicators. A way to accomplish this is to use interactive web-based GIS portals that help to visualize data associated with the spatial complex phenomenon under concern (Kienberger et al. Citation2013). It enables the user to retrieve information on the contribution of the underlying indicators by means of additional charts (), as also shown by Hagenlocher et al. (Citation2014).
Figure 5. Exploring the composition of integrated geons (here: economic vulnerability to flood hazard).
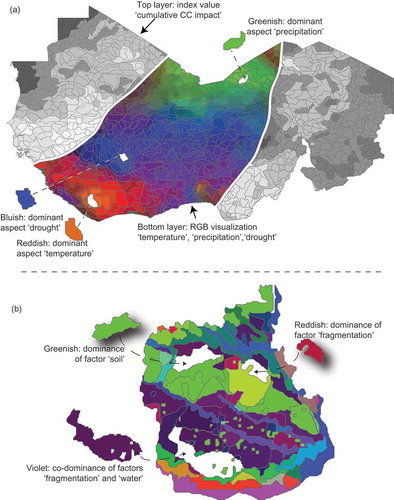
Red-green-blue (RGB) visualization, i.e., assigning three components to the RGB channels, is a means to investigate the major components of the integrated geons. RGB visualization is particularly useful if there are a few major indicators, or the presence of latent factors is likely (see ).
Figure 6. (a): two-layered geonscape obtained from a study on cumulative climate change impact in the Sahel zone (Hagenlocher et al. Citation2014). The index values are shown on the ‘top layer’ in a yellow-to-red color ramp, while ‘underneath’, the RGB visualization presents the composition of each geon. Dominance of one of three main contributing indicators is shown: ‘change in temperature’ (reddish tones), ‘change in precipitation’ (bluish tones), and ‘flood events’ (greenish tones). (b): RGB visualization of a geon-scape showing landscape sensitivity toward a highway project, dimension I – ability to resist to external disturbances (Pernkopf and Lang Citation2011). The spatial distribution of statistically derived influential factors (‘fragmentation’, ‘water’, ‘soil’, each consisting of several indicators) may provide additional information for policy intervention.
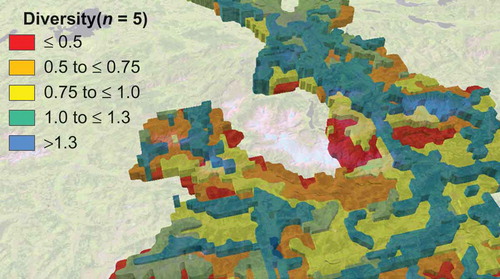
Another way to analyze the composition of integrated geons is to calculate the Shannon index (SI) (Shannon and Weaver Citation1949) as a measure of entropy (). SI indicates whether there are fewer or more indicators involved in composing a geon, and to which degree their contribution is evenly distributed.
Figure 7. Shannon index (SI) as an entropy measure for integrated geons. The number of contributing indicators is 5, SImax equals 1.69. Higher SI values indicate more indicators involved and with fairly equal contribution.
4. Discussion
4.1. Geons in information-based ontology
Spatial information is represented as a ‘correspondence between theories and the world’ (Raper Citation1999), or ‘engineered’ in the sense of Couclelis (Citation2010). For comparing the two types of geons introduced in this paper, we follow the seven-stage semantic hierarchy for geographic information constructs introduced by (Couclelis Citation2010) (see ). Such information-based (or upper-level) ontology is a strategy to deal with the overwhelming information at hand, as opposed to an entity-based ontology that is about handling real-world objects. Couclelis (Citation2010) suggests ‘semantic contraction’ as a kind of backtracking concept from rich geospatial information that, stepwise, loses purpose, function, its composition, and ultimately its space–time relations, down to a piece of information without spatial or temporal context. Vice versa, moving up from simple objects to composite objects (here: composite land-use classes) corresponds to moving from formal to constitutive aspects of the objects of discourse. Then, moving from function to purpose means moving from agentive to telic (intentional, targeted) aspects. Below the object level (field–object transition), there are three semantic resolution levels (similarities, observables, existence).
Figure 8. Placement of integrated and composite geons in information-based ontology. The stages (in capital letters and marked by *…*) are named after (Couclelis Citation2010) merging the lower three resolution levels into one (see text for further explanations).
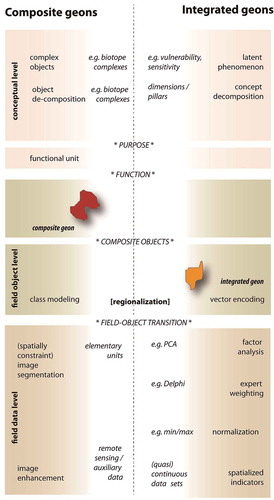
Composite geons operate in the geo-object domain (Goodchild, Yuan, and Cova Citation2007). They are generated along the hierarchical ladder of semantic contraction in a bottom-up, i.e., reconstructive, manner. Thereby, we increase the level of semantic and functional enrichment of the generated units in a stepwise manner. The aim is to arrive at intentional, purpose-driven functional units representing fully validated objects (Lang et al. Citation2010). The construction process starts from Couclelis’ level 3 (classification) with a field–object transition toward level 4 (simple objects), which is achieved in a combined way using image segmentation and labeling of elementary units. These simple objects are considered the building blocks, i.e., geo-atoms sensu Goodchild, Yuan, and Cova Citation2007) for the following uplift toward information objects (objects of discourse) (Bibby and Shepherd Citation2000). This is achieved by class modeling, which generates functional objects by translating expert-based knowledge into a rule-based production system. Under a given policy framework (e.g. a regional development policy), it entails the telic level of the hierarchy. Thus, following Couclelis, we consider these geons to reflect the purpose-driven, yet systemic relevant level of complex geographic information constructs.
Integrated geons remain in the field object domain, yet operating in granular space using a preemptive discrete field-based model (Mark Citation1999; Voudouris Citation2010). These geons are discrete field representations, and, according to Goodchild, Yuan, and Cova (Citation2007), they would be ‘objects’ (representations of discretized fields with no other meaning than representation), but not ‘geo-objects’. In the case of integrated geons, the delineation is based on aggregated homogeneity criteria, which does have a meaning, but not a nominal category (as yet). Consequently, they would not reach the field–object transition between the semantic resolution level of ‘similarities’ and ‘objects’ in the hierarchical ladder of the information-based ontology. The formal level of objects of discourse seems to be missing, i.e., the transition from mere categories to (at least conceptual) nominal entities. Even more, an intersubjective class level (Ahlqvist Citation2008) – beyond a specific domain or a narrow professional group – is absent at this point. However, they bear both function (level 6) and intention (levels 7) in the way that they are constructed, for instance, based on expert knowledge and equipped with a strong policy-related purpose. From this perspective (missing object level), they may be regarded as pure concept-related fiat entities (Smith Citation1994), thus representing phenomena which are unstable ‘accidental clusters’ (Couclelis Citation2010; Voudouris Citation2010). However, in the way they are delineated through regionalization in a multidimensional variable space, they bear stability properties that distinguish them from other conventional units, such as administrative units.
4.2. Repeatability and transferability
The semiautomated delineation of geons using expert-based production systems ensures repeatability under similar conditions. Observing and understanding the spatiotemporal behavior of geons (Peuquet Citation2002) supports monitoring (Lang et al. Citation2008) and related policy action. While the decision for a particular intervention may be based on analyzing the situation ‘as is’, assessing the impact of this intervention requires a repetitive analysis of altering conditions, e.g. an underlying trend as a result of intervention measures, e.g. reduced vulnerability to natural hazards as a result of poverty reduction measures. Here, as in any change analysis, we need to separate noise or slight modifications from ‘real’ changes. Originating from OBIA, an approach called object-fate analysis (OFA) (Schöpfer, Lang, and Albrecht Citation2008) can be used for characterizing the transitions of geons to defined critical stages.
The geon concept and the associated method for its construction are transferable to other domains. This includes the application to other spatial latent phenomena in general, which are not directly measurable, but characterized by a multidimensional nature. As such, the approach is independent from specific conceptualizations of the phenomena. It supports logical deduction from a theory toward its operationalization and therefore can also be used as a ‘spatial proof’ of the applied conceptualization. In addition, the approach is transferable to other geographical or policy scales. However, the different types of scales (e.g. input data, scale characteristics of the investigated phenomena, policy scale) need to be chosen adequately, so that the phenomena are represented in a valid manner (Kienberger, Blaschke, and Zaidi (Citation2013).
4.3. Validity, uncertainty, and MAUP
From a data model point of view, the generated geons are areal objects. The object model suggests crispness of the generated boundaries and soundness of the assigned label. If units are not a priori, can they be objective, i.e., intersubjectively acceptable? While Johnston (Citation1968) already stated that ‘all approaches to classification are actually subjective’, the question arises: do such units have some validity beyond a narrow thematic domain? Statistical, quantitative measures such as accuracy assessments (Foody Citation2002) can evaluate a part of the validity aspects, but there is always a remaining subjectivity in the appropriateness in results when any aggregation is involved. The term ‘object validity’ (Lang et al. Citation2010) reflects the limited power of binary assessments. The construction of composite geons following a ‘body plan’ implies some arbitrariness in the sense of the scaling effects on site-specific classification accuracy (Lang et al. Citation2010; Foody Citation2002). A binary assessment (true/false) may not be sufficient: mapping guidelines that contain class exemplars may support expert-based judgments of ‘appropriate’ delineations (Lang et al. Citation2010). This duality in expert-based delineations of being likewise subjective (‘arbitrary’) but (on an expert level) intersubjectively comprehensible, makes up the notion of geons. The (semi-)automated generation of composite geons does not intend to be ubiquitous, or general. However, within its domain validity, it should be transferable and robust. Object validity addresses a purpose-oriented judgment whether the product meets the users’ demand (see, for example, the extended validation scheme for composite geons applied by Tiede et al. Citation2010). Composite geons are delineated by experts in a process that can be realized by object-based class modeling. They are functional composite objects with disputable boundaries. Although mapping keys may be used, it is difficult to abstract from single exemplars to a prototype representation of such units. The object affordance (Lang, Schöpfer, and Langanke Citation2009), i.e., the assignment of values and meanings to objects during the interpreter’s process of visual perception (Gibson Citation1979), requires additional experience and interpretation skills. For evaluating uncertainty in delineating forest stands as composite geons, Hernando et al. (Citation2012) applied OFA to compare different representations of objects valid from differing expert perspectives.
Both types of geons are built around theoretical frameworks that need to be conceptualized and operationalized: composite geons use mapping keys including particular instructions on composition and structure (very much like an entity-based ontology), integrated geons employ a conceptual framework that de-/composes the latent multidimensional phenomena. With integrated geons, we face an additional challenge insofar that the generated units, though considered plausible, may not directly correspond with observable real-world objects. As a pragmatic solution, the validity of the spatial extent and the pre-categorical nature of such units can be indirectly assessed by collecting evidence data on the prevalence of the phenomenon’s impact. Examples are damage scenarios or loss estimation scenarios, in the case of vulnerability to natural hazards. Generating integrated geons involves several stages, from selection of indicators (and dimensions), to transformation, normalization, weighting, and finally regionalization. During each stage, we are faced with choices that impact the modeling results (Tate Citation2012). This applies to both the statistical soundness of the indicator selection and the parameterization of the segmentation algorithm. We assume that a combination of statistical and expert-based selection approaches delivers a consolidated output of domain-relevance. Still, it is important to analyze the impact of these choices by assessing both the overall sensitivity of the result, as well as related uncertainties that imbue the modeling stages (Tate Citation2012, Citation2013).
With respect to MAUP, we argue that the mapping of a spatial composite indicator using integrated geons is embedded in a conceptual framework. Its methodological realization, provided that the basic principles of multivariate data analysis are obeyed, does result in intersubjectively relevant units. In case of composite geons, the aggregation of building blocks follows a generalized mapping key, which is supported intersubjectively by domain experts, and may lead to alternative, but nonarbitrary solutions depending on interpretation practices.
5. Conclusions
We extended the geon concept by presenting two types of geons, composite and integrated geons. We show how they are built by regionalization techniques, what strategies exist to analyze and characterize them, and how they relate to information-based ontology. We discussed aspects that influence the robustness of geon delineation, as a prerequisite for transferability and monitoring, and also in relation to MAUP. The proposed approach is a means to spatialize complex geographical phenomena under the premise of matching the respective policy scale. Its usability will be benchmarked at the success in reducing complexity while maintaining detail and fitting the degree of integration to the specific level of intervention.
Acknowledgments
The research leading to these results has received funding from the European Community’s Seventh Framework Programme (FP7/2007- 2013) under grant agreements n° 263479 and n° 211590, from the Austrian Academy of Science DOC-fFORTE Programme, the United Nations Environment Programme (UNEP, SSFA/2010/DEPI/PCDMB/043) and from the Verband Region Stuttgart.
References
- Abler, R., J. S. Adams, and P. Gould. 1971. Spatial Organization – The Geographer’s View of the World. Upper Saddle River, NJ: Prentice-Hall.
- Ahlqvist, O. 2008. “In Search of Classification that Supports the Dynamics of Science: The FAO Land Cover Classification System and Proposed Modifications.” Environment and Planning B: Planning and Design 35 (1): 169–186. doi:10.1068/b3344.
- Baatz, M., and A. Schäpe. 2000. “Multiresolution Segmentation: An Optimization Approach for High Quality Multi-scale Image Segmentation.” In Angewandte Geographische Informationsverarbeitung XII, edited by J. Strobl, T. Blaschke, and G. Griesebner, 12–21. Heidelberg: Wichmann Verlag.
- Berry, B. J. L. 1967. “Grouping and Regionalizing: An Approach to the Problem Using Multivariate Analysis.” In Quantitative Geography, edited by W. L. Garrison, and D. F. Marble, 219–251. Evanston: Northwestern Studies in Geography.
- Berry, B. J. L. 1968. “Interdependency of Spatial Structure and Spatial Behavior: A General Field Theory Formulation.” Papers of the Regional Science Association 21: 205–227. doi:10.1007/BF01952730.
- Bibby, P., and J. Shepherd. 2000. “GIS, Land Use, and Representation.” Environment and Planning B: Planning and Design 27 (4): 583–598. doi:10.1068/b2647.
- Birkmann, J. 2006. “Measuring Vulnerability to Promote Disaster-Resilient Societies: Conceptual Frameworks and Definitions.” In Measuring Vulnerability to Natural Hazards: Towards Disaster Resilient Societies, edited by J. Birkmann, 9–54. Tokyo: United Nations University Press.
- Blaschke, T. 2010. “Object Based Image Analysis for Remote Sensing.” ISPRS Journal of Photogrammetry and Remote Sensing 65 (1): 2–16. doi:10.1016/j.isprsjprs.2009.06.004.
- Blaschke, T., and J. Strobl. 2001. “What’s Wrong with Pixels? Some Recent Developments Interfacing Remote Sensing and GIS.” Zeitschrift für Geoinformationssysteme 14 (6): 12–17.
- Carver, S. J. 1991. “Integrating Multi-Criteria Evaluation with Geographical Information Systems.” International Journal of Geographical Information Systems 5 (3): 321–339. doi:10.1080/02693799108927858.
- Couclelis, H. 2010. “Ontologies of Geographic Information.” International Journal of Geographical Information Science 24 (12): 1785–1809. doi:10.1080/13658816.2010.484392.
- Cova, T. J., and M. J. Goodchild. 2002. “Extending Geographical Representation to Include Fields of Spatial Objects.” International Journal of Geographical Information Science 16 (6): 509–532. doi:10.1080/13658810210137040.
- Drăguţ, L., O. Csillik, C. Eisank, and D. Tiede. 2014. “Automated Parameterisation for Multi-Scale Image Segmentation on Multiple Layers.” ISPRS Journal of Photogrammetry and Remote Sensing 88: 119–127. doi:10.1016/j.isprsjprs.2013.11.018.
- Duque, J. C., and R. R. Suriñach. 2006. Supervised Regionalization Methods – A Survey, 31, Working Papers. San Diego, CA: Research Institute of Applied Economics.
- Foody, G. M. 2002. “Status of Land Cover Classification Accuracy Assessment.” Remote Sensing of Environment 80 (1): 185–201. doi:10.1016/S0034-4257(01)00295-4.
- Fotheringham, A. S., and D. W. S. Wong. 1991. “The Modifiable Areal Unit Problem in Multivariate Statistical Analysis.” Environment and Planning A 23 (7): 1025–1044. doi:10.1068/a231025.
- Gibson, J. J. 1979. The Ecological Approach to Visual Perception. Boston, MA: Houghton Mifflin.
- Goodchild, M. J., M. J. Egenhofer, K. K. Kemp, D. M. Mark, and E. Sheppard. 1999. “Introduction to the Varenius Project.” International Journal of Geographical Information Science 13: 731–745. doi:10.1080/136588199240996.
- Goodchild, M. J., M. Yuan, and T. J. Cova. 2007. “Towards a General Theory of Geographic Representation in GIS.” International Journal of Geographical Information Science 21 (3): 239–260. doi:10.1080/13658810600965271.
- Grigg, D. B. 1967 “Regions, Models and Classes.” In Models in Geography, edited by R. J. Chorley, and P. Haggett, 461–509. London: Methuen.
- Guo, D. 2008. “Regionalization with Dynamically Constrained Agglomerative Clustering and Partitioning (REDCAP).” International Journal of Geographical Information Science 22: 801–823. doi:10.1080/13658810701674970.
- Guo, J. Y., and C. R. Bhat. 2004. “Modifiable Areal Units: A Problem or a Matter of Perception in the Context of Residential Location Choice Modeling?” Transportation Research Record 1898: 138–147.
- Hagenlocher, M., S. Lang, D. Hölbling, D. Tiede, and S. Kienberger. 2014. “Modeling Hotspots of Climate Change in the Sahel Using Object-Based Regionalization of Multi-Dimensional Gridded Datasets.” Journal of Selected Topics in Applied Earth Observations and Remote Sensing.
- Hancock, J. R. 1993. “Multivariate Regionalization: An Approach Using Interactive Statistical Visualization.” In Proceedings of the International Symposium On Computer-Assisted Cartography, edited by AutoCarto Xi, 218–227. Minneapolis: American Congress on Surveying and Mapping, and the American Society for Photogrammetry and Remote Sensing.
- Hernando, A., D. Tiede, F. Albrecht, and S. Lang. 2012. “Spatial and Thematic Assessment of Object-based Forest Stand Delineation Using an OFA-matrix.” International Journal of Applied Earth Observation and Geoinformation 19: 214–225.
- Johnston, R. J. 1968. “Choice in Classification: The Subjectivity Ofobjective Methods.” Annals of the Association of American Geographers 58: 575–589. doi:10.1111/j.1467-8306.1968.tb01653.x.
- Johnston, R. J. 1970. “Grouping and Regionalizing: Some Methodological and Technical Observations.” Economic Geography 46: 293–23032 . doi:10.2307/143145.
- Kienberger, S. 2012. “Spatial Modelling of Social and Economic Vulnerability to Floods at the District Level in Búzi, Mozambique.” Natural Hazards 64 (3): doi:10.1007/s11069-012-0174-9.
- Kienberger, S., T. Blaschke, and R. Z. Zaidi. 2013. “A Framework for Spatio-Temporal Scales and Concepts from Different Disciplines: The ‘Vulnerability Cube’.” Natural Hazards doi:10.1007/s11069-012-0513-x.
- Kienberger, S., S. Lang, and P. Zeil. 2009. “Spatial Vulnerability Units – Expert-Based Spatial Modelling of Socio-Economic Vulnerability in the Salzach Catchment, Austria.” Natural Hazards and Earth System Sciences 9: 767–778. doi:10.5194/nhess-9-767-2009.
- Kienberger, S., M. Hagenlocher, E. Delmelle, and I. Casas. 2013. “A WebGIS Tool for Visualizing and Exploring Socioeconomic Vulnerability to Dengue Fever in Cali, Colombia.” Geospatial Health 8 (1): 313–316.
- Lambin, E. F., and D. Ehrlich. 1997. “Land-Cover Changes in Sub-Saharan Africa (1982–1991): Application of a Change Index Based on Remotely Sensed Surface Temperature and Vegetation Indices at a Continental Scale.” Remote Sensing of Environment 61 (2): 181–200. doi:10.1016/S0034-4257(97)00001-1.
- Landesanstalt-Fuer-Umweltschutz, ed. 2003. Handbuch zur Erstellung von Pflege- und Entwicklungsplaenen für die natura 2000-gebiete in baden- Wuerttemberg. Karlsruhe: Fachdienst Naturschutz, Naturschutz Praxis, Natura 2000.
- Lang, S. 2008. “Object-Based Image Analysis for Remote Sensing Applications: Modeling Reality – Dealing with Complexity.” In Object-Based Image Analysis – Spatial Concepts for Knowledge-Driven Remote Sensing Applications, edited by T. Blaschke, S. Lang, and G. J. Hay, 3–28. Berlin: Springer.
- Lang, S., F. Albrecht, S. Kienberger, and D. Tiede. 2010. “Object Validity for Operational Tasks in a Policy Context.” Journal of Spatial Science 55 (1): 9–22. doi:10.1080/14498596.2010.487639.
- Lang, S., E. Schöpfer, and T. Langanke. 2009. “Combined Object-Based Classification and Manual Interpretation – Synergies for a Quantitative Assessment of Parcels and Biotopes.” Geocarto International 24 (2): 99–114. doi:10.1080/10106040802121093.
- Lang, S., and D. Tiede. 2003. V-LATE Extension für ArcGIS – vektorbasiertes Tool zur quantitativen Landschaftsstrukturanalyse. [In German.] ESRI Anwenderkonferenz Innsbruck.
- Lang, S., P. Zeil, S. Kienberger, and D. Tiede. 2008. “Geons – Policy-Relevant Geo-Objects for Monitoring High-Level Indicators.” In Geospatial Crossroads @ GI_Forum’ 08, edited by A. Car and J. Strobl, 180–186. Heidelberg: Wichmann.
- Long, J., T. Nelson, and M. Wulder. 2010. “Regionalization of Landscape Pattern Indices Using Multivariate Cluster Analysis.” Environmental Management 46: 134–142. doi:10.1007/s00267-010-9510-6.
- Longley, P., M. J. Goodchild, D. Maguire, and D. Rhind. 2001. Geographic information systems and science. 1st ed. Chichester: Wiley.
- Maclaurin, G. J., S. Leyk, and L. M. Hunter. 2012. “The Impacts of Aggregation and Spatial Non-Stationarity on Migration Models.” Proceedings AutoCarto 2012, Columbus, OH, September 16–18.
- Malczewski, J. 1999. GIS and Multicriteria Decision analysis. Chichester: Wiley.
- Mark, D. M. 1999 “Spatial Representation: A Cognitive View.” In Geographical Information Systems, edited by P. Longley, M. J. Goodchild, D. Maguire and D. Rhind, 81–89. London: Wiley.
- Masolo, C., and L. Vieu. 1999. Atomicity vs. Infinite Divisibility of Space, 235–250. London: Springer.
- Moldan, B., and A. L. Dahl. 2007 “Challenges to Sustainability Indicators.” In Sustainability Indicators – A Scientific Assessment, edited by T. Hák, B. Moldan, and A. L. Dahl, 1–26. Washington, DC: Island Press.
- Nardo, M., M. Saisana, A. Saltelli, S. Tarantola, A. Hoffmann, and E. Giovannini. 2005. Handbook on Constructing Composite Indicators – Methodology and User Guide. OECD Working Papers, Paris: OECD.
- Ng, R. T., and J. Han. 2002. “Clarans: A Method for Clustering Objects for Spatial Data Mining.” IEEE Transactions on Knowledge and Data Engineering 14: 1003–1016. doi:10.1109/TKDE.2002.1033770.
- Openshaw, S. 1984. The Modifiable Areal Unit Problem. Norwich: Geo Books.
- Páez, A., and D. M. Scott. 2004. “Spatial Statistics for Urban Analysis: A Review of Techniques with Examples.” GeoJournal 61: 53–67. doi:10.1007/s10708-004-0877-x.
- Pernkopf, L., and S. Lang. 2011. “Spatial Meta-Indicators: Assessing Landscape Sensitivity in the Context of SEA.” In RegioResources, Dresden: The European Land Use Institute.
- Peuquet, D. J. 2002. Representations of Space and Time. New York: The Guilford Press.
- Raper, J. F. 1999. “Spatial Representation: The Scientist’s Perspective.” In Geographical Information Systems – Principles and Technical Issues, edited by P. Longley, M. J. Goodchild, D. Maguire and D. Rhind, London: Wiley.
- Salton, G., A. Wong, and C. S. Yang. 1975. “A Vector Space Model for Automatic Indexing.” Communications of the ACM 18 (11): 613–620. doi:10.1145/361219.361220.
- Schöpfer, E., S. Lang, and F. Albrecht. 2008. “Object-Fate Analysis – Spatial Relationships for the Assessment of Object Transition and Correspondence.” In Object-Based Image Analysis – Spatial Concepts for Knowledge-Driven Remote Sensing Applications, edited by T. Blaschke, S. Lang, and G. J. Hay, 785–801. Berlin: Springer.
- Shannon, C. E., and W. Weaver. 1949. The Mathematical Theory of Communication. Urbana: University of Illinois Press.
- Sharma, J., A. Angelucci, and M. Sur. 2000. “Induction of Visual Orientation Modules in Auditory Cortex.” Nature 404: 841–847. doi:10.1038/35009043.
- Smith, B. 1994. “Fiat objects.” In 11th European Conference on Artificial Intelligence. Amsterdam: Parts and Wholes: Conceptual Part-Whole Relations and Formal Mereology.
- Spence, N. A. 1961. “A Multifactor Uniform Regionalization of British Countries on the Basis of Employment Data for 1961.” Regional Studies II: 87–104.
- Strasser, T., S. Lang, B. Riedler, L. Pernkopf, and K. Paccagnel. 2014. “Multi-Scale Object Features for Habitat Quality Monitoring in Riparian Forests.” Geosciences and Remote Sensing Letters 11 (3): 559–563.
- Tate, E. 2012. “Social Vulnerability Indices: A Comparative Assessment Using Uncertainty and Sensitivity Analysis.” Natural Hazards 63: 325–347. doi:10.1007/s11069-012-0152-2.
- Tate, E. 2013. “Uncertainty Analysis for a Social Vulnerability Index.” Annals of the Association of American Geographers 103 (3): 526–543. doi:10.1080/00045608.2012.700616.
- Tiede, D., S. Lang, F. Albrecht, and D. Hölbling. 2010. “Object-Based Class Modeling for Cadastre Constrained Delineation of Geo-Objects.” Photogrammetric Engineering & Remote Sensing 193–202. doi:10.14358/PERS.76.2.193.
- Tobler, W. 1970. “A Computer Movie Simulating Urban Growth in the Detroit Region.” Economic Geography 46 (2): 234–240. doi:10.2307/143141.
- Tomanev, J. 2009. Region. Oxford: Elsevier.
- Voudouris, V. 2010. “Towards a Unifying Formalisation of Geographic Representation: The Object–Field Model with Uncertainty and Semantics.” International Journal of Geographical Information Science 24 (12): 1811–1828. doi:10.1080/13658816.2010.488237.
- Wise, S., R. Haining, and J. Ma. 2001. “Providing Spatial Statistical Data Analysis Functionality for the GIS User: The SAGE Project.” International Journal of Geographical Information Science 15 (3): 239–254. doi:10.1080/13658810151072877.
- Yuan, M. 2001. “Representing Complex Geographic Phenomena in GIS.” Cartography and Geographic Information Science 28 (2): 83–96. doi:10.1559/152304001782173718.
- Zadeh, L. A. 1965. “Fuzzy Sets.” Information and Control 8 (3): 338–353. doi:10.1016/S0019-9958(65)90241-X.