
ABSTRACT
Emergency events such as floods and wildfires are handled by various responders and at various levels: strategic, tactical, and operational. To facilitate situational awareness, emergency responders require customized map-based decision support systems that are tailored to specific needs depending on the responders’ organizational affiliation, role, objectives, and occupationally specific knowledge. As a result, the systems are equipped with manifold map functions. However, the diversity of map-based emergency tools in use impedes gaining common user skills among their target audiences and thus, requires a systematic overview. Through a multistep research process, this study was to: investigate the requirements for support from map-based tools expressed by various emergency responders in Norway, identify desired map functions, and categorize those functions to facilitate an overview. Six stages constituted our workflow: meetings with Norwegian emergency responders, survey on selected map-based tools, interviews with designers and users of tools, a table-top exercise, theoretical considerations, and validation with stakeholders. This study contributes to the state of the art by systematizing and structuring knowledge about map functions that facilitate situational awareness. In turn, it helps developing and optimizing functionality of map-based tools depending on needs of specific emergency responders.
Introduction
To develop situational awareness, i.e. to know what is going on during a crisis situation (Endsley, Citation1995), responders use emergency map-based decision support systems (Fertier et al., Citation2020) often called common operational picture (COP) tools (Baber et al., Citation2013; Hwang & Yoon, Citation2020). Those tools support decision-making processes by displaying relevant information such as events’ geographic positions and resources of engaged emergency actors. COP tools also provide specific map functions such as searching for the closest available emergency vehicle or showing address points located within a hazard-prone area. Therefore, such tools encompass solutions of diverse functionality and design that enable emergency responders to address assigned tasks.
Although map-based COP tools facilitate getting situational awareness necessary for efficient decision-making during crisis situations, the diversity of such tools regarding software producers, technologies used, and versions of graphical user interfaces, impedes gaining common user skills among their target audiences and thus, hinders efficient collaboration between emergency responders (Antkiewicz et al., Citation2009). Efficient COP tools help solve tasks that differ from one another in terms of such aspects as emergency event type, emergency responder’s level of engagement, as well as the responder’s role and use of own resources. However, despite the differences, map-based COP tools share similar map functions.
Studies that concern the needs of the users of COP tools regarding map functions are sparse, fragmented in the literature, and often not directly referring to the term of COP (Wu et al., Citation2013). Moreover, map functions are not considered systematically and comprehensively, from the GIScience perspective. Therefore, this research set out to systematize knowledge about map functions provided in map-based decision support systems for emergency response. We focused on the needs of emergency responders in Norway with the assumption that our findings could be transferred to other geographic contexts worldwide. We posed two research questions:
(RQ1):
What are the requirements for support from map-based emergency systems expressed by emergency responders?
(RQ2):
What are the functions of map-based emergency systems most desired by emergency responders during their tasks?
Furthermore, two practical objectives resulted from the formulated research questions. First, to make an inventory of map functions of importance to map-based emergency support systems. Second, to group identified functions into categories to facilitate gaining their comprehensive overview.
This study was motivated by the need for an understanding of the support of map-based tools for emergency management. Stakeholders expressed such a need during a workshop that we organized in Oslo in October 2019 (Opach et al., Citation2020). In Norway, implementation of the command and control structure within emergency response diverges from military structures. Thus, emergency responders are not managed through a centralized administration, instead emphasizing the role of local decision-making and delegated authority, often including voluntary resources and semiprofessional rescue personnel. While the police are mainly responsible for command and control at the operational and tactical levels, emergency response can see a wide variation in participants, particularly in rural areas where available resources may be sparse. The systematic integration of voluntary resources, coupled with a decentralized administration, creates a set of challenges when it comes to ensuring that stakeholders have access to map-based tools and geographic data needed to develop situational awareness. The use of different software systems and the lack of inter-organizational data access, particularly across the professional-voluntary divide, has been among the factors limiting efficient sharing of information during emergencies (Grottenberg & Njå, Citation2017). These difficulties give a compelling argument for establishing a common set of dedicated capabilities across organizations – “common operational functionality” (Chmielewski & Gałka, Citation2009). Therefore, a question arose as to what map functions a map-based COP tool should be equipped with to effectively support diverse emergency responders during their operations.
Related work
Cartographic communication for situational awareness
Although the concept of situational awareness has been extensively elaborated in the literature (Endsley, Citation1995; Hwang & Yoon, Citation2020; Luokkala et al., Citation2017; Steen-Tveit & Munkvold, Citation2021), its interpretation differs between its application areas (Blandford & Wong, Citation2004). Typically, situational awareness is acquired through the access to operational, tactical, and strategic information whose visual representations are provided as a common operational picture, i.e. COP (Hwang & Yoon, Citation2020; McNeese et al., Citation2006). Regarding the latter concept, there is no univocal definition of COP. Steen-Tveit and Munkvold (Citation2021) confirm the opinion of McNeese et al. (Citation2006) that among emergency responders, COP is typically understood as a map interface that represents objects visible during an emergency situation. In turn, common situational understanding is a common interpretation of such a visual information. Therefore, one may assume that common situational understanding is a stage achieved after the comprehension of the information provided in a map-based COP tool that leads to the shared situational awareness necessary for an efficient collaboration between stakeholders from different agencies (Seppänen et al., Citation2013).
The above linkages between the three concepts of COP, common situational understanding, and situational awareness, and the key role of maps, resemble the relationships between the elements in the communication process of cartographic information (Kolačny, Citation1969). Typically, five steps constitute the cartographic communication process. Reality (, step 1) is perceived by a mapmaker, who prepares adequate geographical data (2) and encodes the data visually when elaborating a map (3). The map is next read (visually decoded) by the user who develops a certain level of understanding by linking the information shown on the map with the knowledge previously acquired (4). Finally, the user interprets the information to create his/her own mental image of the reality (5). Additionally, in the context of modern highly interactive exploratory map-based tools such as those with coordinated multiple views (Wu et al., Citation2013), the map reading process between step 3 and 4 can be supplemented by the sense making loop (elements in green in ) for exploratory data analysis (Pirolli & Card, Citation2005). In this loop, the user applies various map functions and adapts map representations to investigate map content. Next, the information read from the map is schematized and explored during the sense making process (to comprehend information). Then, if something is still unclear and needs deeper investigations, the user returns to step 3, to search for extra evidence. These actions can be repeated until the user acquires necessary comprehension.
Figure 1. Similarities between the process of comprehension of an emergency situation and the process of cartographic communication.
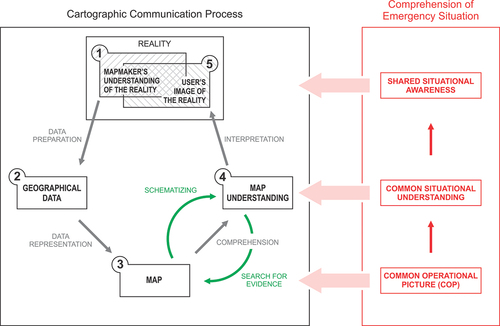
As shown in the right panel of (elements in red), the concepts of COP, common situational understanding, and situational awareness that lead to the comprehension of emergency situation, correspond with the concepts shown in the left part of , i.e. map, map understanding, and user’s image of the reality, respectively, of the cartographic communication process. Furthermore, in the latter process, there is a gap between the user’s mental image of the reality (step 5 in ) and the mapmaker’s understanding (step 1). This gap is typically caused by the loss of information during the cartographic communication process (Ratajski, Citation1978). Similarly, situational awareness is never fully comprehensive and complete and there is always some missing information (Hwang & Yoon, Citation2020). This happens due to various reasons such as inefficient communication between participating agents (Hwang & Yoon, Citation2020; Steen-Tveit & Munkvold, Citation2021), organizational habits and routines, pressure of time and stress (Kuvedžić Divjak & Lapaine, Citation2014), inappropriately designed decision support systems (Blandford & Wong, Citation2004), or the uncertainties of crowdsourced or VGI data contributed by the general public during an emergency that may be incorporated into COP systems. For instance, during a given emergency event such as a wildfire, engaged responders often encounter the problem of location uncertainty (Steen-Tveit & Munkvold, Citation2021). This issue can be considered in the context of the five steps of the process of cartographic communication. Various responders have different needs regarding the accuracy of address information (steps 1 and 2 in ) and thus, on the maps, prioritize different aspects (step 3) that lead to responded-specific situational awareness, it means, users’ image of the reality (steps 4 and 5). Therefore, the question to be posed is what map functions a tool should be equipped with to facilitate acquiring situational awareness that represents the crisis situation as accurately as possible, and also, to avoid overloading the tool cognitively (Bunch & Lloyd, Citation2006).
Map functions of emergency tools
With rich geographic data and extensive functionality, map-based COP tools resemble geographic information systems (Grottenberg & Njå, Citation2017; McNeese et al., Citation2006). An essential map function of COP tools is to display multifaceted geographic information such as operational data as a primary layer and a basemap in the background. What is important for users is to change map scale and projection as well as modify cartographic representation (Kuvedžić Divjak & Lapaine, Citation2014). By applying various geographic visualization techniques users can adapt the map to specific needs, e.g. a road map can be shifted to street view or to 3D view. Another essential map function of COP tools is map sharing for collaborative decision-making. A good example is the study by Wu et al. (Citation2013) who built a dual-map visual interface consisting of a personal (role-specific) map and a shared (team) map. Further, this combination was equipped with an interactive annotation tool to add comments and a sketching tool to draw graphs on the personal and the shared map.
Map-based COP tools differ in terms of offered functionality. While some tools provide a map equipped with basic interactive functions, others offer rich functionality built in a map display assisted with auxiliary visual components such as a timeline or a reporting panel (Luokkala et al., Citation2017). Different levels of functionality are caused by diverse requirements regarding operational tasks supported by COP tools. If a given COP tool supports emergency scenarios relevant for one emergency responder only, required functionality can be planned through the tool’s co-design process engaging representatives of that responder. However, if a COP tool is to be used by several emergency responders, then, required functionalities need to be negotiated between potential users. Such negotiations are necessary to determine a balance between a general level of essential functionality included in COP tools for emergency management and specific interactive functions requested by some responders, but likely to generate confusion to other responders.
Requirements regarding map functions of emergency tools
COPs for emergency response resemble other decision support systems that employ map displays, such as those used in the control of air traffic (Pfeiffer et al., Citation2015) or power supply (Lu et al., Citation2020). Therefore, in the design of map-based COP tools, developers follow approaches like those used in the design of other map-based decision support systems (Kuvedžić Divjak & Lapaine, Citation2014). The latter are often designed to support specific tasks that are grouped into various task taxonomies (Gotz & Zhou, Citation2009). Such taxonomies facilitate optimizing tool functionalities since they can help assign adequate interactive functions to desired tasks to be supported, and thus, can help fulfill user needs. Equipping decision support tools with map functions is appreciated by target users, and therefore, following the user-centric design approach is a common strategy. In the context of COP, Balakrishnan et al. (Citation2009) investigated the performance of specific functions: a layer management function and a spatially annotated chat. Their qualitative evaluation concerned user-centric problems related to human-computer interaction to support group work and the impact geo-tools have on group work. Cartographic literacy is another aspect to be considered when designing COP map-based interfaces with a user-centric approach. Such interfaces, if well-designed, can facilitate communication of geographical information in crisis situations (Kuvedžić Divjak & Lapaine, Citation2014).
Various responders have different tasks, capabilities, and resources, and thus, different requirements regarding COP tools. Hence, emergency actors vary in how they display adequate information on map-based visual interfaces and use the interfaces’ functionalities to perform designated tasks (Friedmannová, Citation2010). A good example is the system by Locus Public Safety (Furland, Citation2013) that have two versions, one for the Norwegian fire service (TransFire), and one of the Norwegian medical service (TransMed). Both versions share the same layout; however, they differ in terms of provided functionality. Furthermore, while emergency information is often displayed on maps tailored to large wall displays, some actors also use desktop solutions or portable devices with small screens. Additionally, at an interagency level, responders process and utilize each other’s professional expertise to achieve greater situational awareness in terms of common situational understanding. Finally, some information for the COP may be provided by the public who expects to be kept informed about how the situation develops.
All aspects highlighted above make designing map functions for emergency map-based interfaces challenging. A wide range of emergency management stakeholder involvement is critical for the effective development of emergency tools for situational awareness. It may be also necessary to provide different levels of access to emergency information and map functions, separately for various emergency responders, for the third-party actors such as local decision-makers, and lastly, for the public.
Methods
We used a combination of methods to identify the requirements for support from map-based emergency systems and to gain an empirical evidence about map functions desired by emergency responders. Our efforts were divided into six steps (). In step 1, we organized two stakeholder meetings and conducted two interviews with software producers (Table S1 in supplemental online material) to identify challenges of the operational support of COP map-based tools and determine research issues. Step 1 directed our attention toward map functions when surveying, in step 2, ten COP map-based interfaces () in use by selected emergency responders in Norway. Such a survey was necessary to gain a comprehensive understanding of the functionality (i.e. supported use case scenarios) of existing tools. Regarding the constraints of the survey, our efforts were impeded by the limited accessibility and insufficient documentation of several tools. For example, while Avinet’s solutions were available for free examination, tools by Locus Public Safety did not have trial versions. In such cases, our survey was based on software demonstrations, documentation, and promotional videos and presentations. Continuous software improvement and update was another issue that hindered the survey, as sometimes, published software descriptions did not correspond with the software’s most recent versions.
Figure 2. The workflow of the research process.
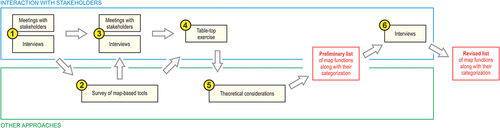
Table 1. Map-based tools included in the survey.
The first round of meetings and interviews in step 1, and the survey in step 2, influenced how we, in step 3, structured further interviews with users of COP tools and arranged following meetings with providers of such tools (Table S2 in supplemental online material). As a result, step 3 enabled us to determine requirements regarding map functions and their combinations implemented in COP tools. In turn, the results of the survey as well as the outcomes of the meetings and interviews in step 3 were used to design and conduct a table-top exercise in step 4. The exercise was organized in spring 2021 and included three simultaneous forest fires. Participants were expected to share their operational information using a common map-based system. In all three fire scenarios, critical infrastructure such as electricity supply was threatened and in one case, a hospital was also affected by smoke. In total, approximately 70 participants from 20 agencies and organizations took part in the exercise. The exercise facilitated highlighting map functions essential for supporting emergency work practices related to situational awareness as well as eliciting potential shortcomings.
In step 5, we used the findings from the empirical material collected in steps 1–4 to propose a conceptual framework and an inventory of map functions essential for emergency responders. In our considerations, we referred to the theory of cartographic communication (Kolačny, Citation1969; Ratajski, Citation1978). Additionally, the proposed map functions were divided into those of importance to the common operational picture, and those contributing to the new concept of the common situational picture. Next, in step 6, a preliminary list of map functions along with their categorization were validated with stakeholders. To this aim, semi-structured interviews (see supplemental online material for the guide) were conducted to ask about: (1) our proposal with the two categories of map support tools for emergency management, (2) identified map functions for decision support in emergency management, and (3) map functions for common operational picture and those for common situational picture.
The results of steps 1–5 are reported in the following section. Whereas the interviews performed in step 6 along with the revised list of map functions are described in the validation section.
Results
The first round of stakeholder meetings and interviews
Participants of the Oslo workshop (see Table S1 in supplemental online material) identified adequate functionality as one of the most important aspects of the design of map-based emergency tools. They suggested arranging a list of predefined interactive analytical map functions and a joint map repository for all Norwegian emergency map services. They also pointed out that sharing the same map-based interface across different agencies at a national level can help avoid misunderstandings caused by inconsistencies among various tools. Some participants argued that it is important to have a map-based interface for “drill-down” and to have “various perspectives” such as satellite-night-sea, sea level view, and aerial imagery.
In turn, map functions of importance to COP tools for marine traffic and oil spills were in focus during the meeting with a representative of the Norwegian Coastal Administration (NCA) (Table S1). The primary tool of NCA, i.e. Kystinfo, integrates background maps with thematic overlays and situational data such as real-time observations and positions of engaged resources. As the representative claimed, Kystinfo provides multiple map functions, e.g. it displays weather forecasts, provides drift analysis, enables information sharing and accessing remote sensing data from boats, aircrafts, and drones.
Regarding the interviews (Table S1), map functions implemented in the command post tools offered by Locus Public Safety, are tailored to organizational responsibilities and the workflows of the respective agencies. However, a tool development is a multistage process with mutual interaction between user groups and system designers and, as the interviewee put it “it is very rare that something that is really good comes without a proper effort.” Similar feedback was gained during the interview with a representative of the Avinet company that delivered several map-based decision support tools for directorates, county governors, and county councils in Norway. As the interviewee said, Avinet develops map-based interfaces based on specific requests and the tool development process is typically stepwise and requires continuous collaboration with the customer. Avinet’s tools are used, for example, in exercises and, along with exercise customization, modification needs arise. As the interviewee put it “together we find a solution.” This means that over a development process the functionality evolves based on specific needs that are reflected in offered interactive functions.
Survey of map-based COP tools
Tools for emergency responders engaging own resources
Conveying mission-relevant information and ensuring the fastest possible response time is the most essential purpose of tools used by medical service, fire service, and the police, i.e. TransMed, TransFire, and Tellus, respectively (see ). In principle, these tools are used to perform day-to-day operations by responders who engage own resources and whose responsibilities and tasks are strictly determined by regulations (Grottenberg & Njå, Citation2017; Steen-Tveit & Munkvold, Citation2021). For example, TransMed helps answering where the patient is, what resources are nearby, and how to get the resources and send them out. In general, TransMed as well as TransFire and, in particular, Tellus, support effective mission management such as resource monitoring and directing allocation of resources to an assignment in the map, i.e. searching for nearest available resources to be sent to an emergency event. Therefore, those tools implement an extensive proximity analysis functionality. Regarding other functions, route calculation and driving description, and analysis of response time areas and driving range, are essential map functions to support decision-making during operational tasks.
Rich functionality causes that the multi-view layout is a common feature of tools of responders that engage own resources. The main display with various background maps is typically accompanied by other maps (e.g. a subset map with resource overview or a new address search map) and visual components such as timeline panels and tables. The latter can list engaged resources to help engaged agencies integrate and analyze critical information and monitor individual activities. While maps show status and positions of emergency vehicles, points of interests, and emergency events, tables contain information about selected objects and communication logs. Hence, multiple views aid decision-making as well as group activity awareness.
While TransMed and TranFire share similar design and functionality, Tellus that is used by the police, offers more extensive map functions. This system was introduced to replace Geopol with a tool richer in analytical capabilities (Inderhaug, Citation2018). Therefore, Tellus, apart from the typical operational map functions such as resource monitoring and assignment management, offers functions known from GIS software. Examples include viewshed analysis, dispersion analysis, analysis of human spatial behavior, density analysis, or buffer analysis.
Tools for coordination and getting insight into a situational context
Most of the tools that contribute to the second category are built using the same Avinet Adaptive platform for web GIS and web mapping. Therefore, although KystInfo, DSB Kart, BarentsWatch Arealverktøy, and NOFO COP Oljevern (see ) differ regarding target audiences, they all share similar layout and offer similar map functions. For example, the tools enable displaying various map backgrounds, overlays and thematic content, measuring distances and areas, filtering data, and selecting objects on the map. Moreover, the considered tools enable drawing objects on a map that can be saved and shared with other system users.
Tools from the second category consist of a map window accompanied by a function panel and a table. Besides, they all offer functionalities typical for web GIS services, in which three groups of user tasks are feasible, i.e. data display, data creation and data analysis. Therefore, the analysis of the Avinet products resulted in identifying a number of map functions and grouping them into those that enable users to display and share data (e.g. “layer manager” to manipulate map content and “playback” to get insight into changes over time), those for the creation of geographical data (e.g. “draw” to create point, line, or polygon features and “user data” to upload own data to the tool), and analytical functions (e.g. “comparison” to compare various timestamps of the same dataset and “layer filtering” to selectively customize data to be displayed).
Although CIM and SARTopo are assigned to the second group, they are of different nature. SARTopo is used for rescue mission management and planning and is modest regarding map functions in comparison with Avinet’s tools. It consists of a map display where operational information such as team positions, assigned or planned tasks, and POIs are showed on the background of satellite images or thematic maps. In turn, CIM is a system for crisis and incident management, to coordinate tasks at various phases of an emergency event. Various implementations of CIM, e.g. kystcim.no or dsb-cim.no, integrate a simple map component with basic functions only, such as displaying point symbols or drawing objects on a map.
The second round of stakeholder meetings and interviews
In the second round of interviews and meetings, the chief of the map division in the administration of one of the Norwegian counties (Table S2) emphasized the role of map sharing. As he explained, during an extreme event, roads may be closed and information needs to be disseminated. Currently, this is done by making a list of roads closed. If this is showed on a map, the information is perceived more efficiently. Furthermore maps can be easily updated by actors involved in managing the incident; citizens could also add their observations.
Displaying various thematic overlays was another considered issue. For example, this is of interest for emergency planning to see which areas become exposed due to sea level rise. Therefore, having a digital terrain model and 3D data on built environment is of importance to decision-making during emergency events since such data are used to generate maps that show the exposure of residential areas or infrastructure. The interviewee also indicated the importance of automatic tracking and showing position of a user on a map to verify whether the position is within a hazard exposure zone, electricity failure coverage, cell phone coverage, or emergency call coverage. Other examples of valuable map functions included drawing objects on a map and, thereafter, displaying them in a 3D view, and symbolizing roads going through inundated areas. Then, roads are styled based on their “level of flooding” and thus, information on vehicle types that can pass through differently inundated areas is provided.
In turn, an adviser at the county governor’s office reported on how map-based tools are used during emergency situations by owners of critical infrastructure. Having a map when sharing a description of the situation was highlighted as paramount. Regarding the map-based tool provided by DSB, it can be accessed using a common login enabling engaged actors to work in the same workspace. Hence, they can all modify the same information, i.e. developing a map-based situational picture. Regarding the CIM system, which is the standard tool for incident logging and reporting provided by DSB for free to the Norwegian emergency responders in public sector, the vendor F24 expressed that further development of a map component will require a request from their customers and financial backing for this need. Further, as map services is not within the core business of F24, this would require alliances with third party providers such as Avinet.
Regarding the interviews, six emergency officers from the municipal and county administration, as well as officers from various Norwegian emergency and rescue institutions were interviewed individually in autumn 2020 (Table S2). We encouraged our interviewees to comment on, among other, favorable map functions of COP tools. One interviewee suggested using a common map base by various emergency responders and letting those responders create individual but distributable layers that can be sent to peer agencies. The interviewees also had more specific suggestions. One example is the division of the map space into sectors to communicate with personnel managing drops from helicopters. Another example concerns text labels popping up when one moves the mouse cursor over map symbols.
Table-top exercise
In the table-top exercise, empirical data was collected based on observations during the exercise, two rounds of questionnaires distributed after the training conducted prior to the exercise and after the exercise itself, and group interviews with representatives of the participating organizations. However, reflecting the overall purpose of the exercise, most of the collected feedback concerned information sharing for common operational understanding, procedures, and learning from the incident, and a minor part (included here) was about map functions.
As reported by the participants, the basic advantage of a common map system was that an overview of the situation was provided in a different way than logs and textual descriptions. With maps, it was easier to gain an operational overview and to know what other information one needed. A map visualized the situation and gave much better understanding than text. Therefore, the use of maps reduced misunderstandings. Regarding the shortcomings, participants claimed that although DSB Kart was “interesting,” competence is needed to use its map functions efficiently. As one of the participants put it, “I think this is a tool that you should have worked a lot with to be safe in use.” Furthermore, the participants reported several suggestions for improvements, e.g. “a procedure should be created for the participants who enter elements into the map” as they “must enter which organization they represent.” Other participant required easier identification of symbols as it was “a little cumbersome to find out who has placed the material.” Some individuals complained about the lack of 3D view of terrain and found map editing as “too difficult” and the DSB Kart as being “too static.” Especially the latter issue was identified as of special importance since map tools are used not only to keep track of ongoing actions, but also to see preceding actions. Therefore, participants pointed out that the time dimension was not handled on the map; there was no timeline to play the map back to see what happened in the past. Moreover, the map used in the exercise did not provide real time data of vehicles, equipment, and personnel. Participants pointed out the lack of map labels when hovering over objects on the map and complained about the lack of a map grid necessary to support operating helicopters.
Conceptual framework, tool categories and their corresponding map functions
Feedback collected in step 1, 3, 4, and the outcomes of the survey in step 2 (see ) revealed that support from map-based tools is twofold. Some tools support operations and thus, encompass solutions for first-response emergency actors, e.g. Tellus, TransMed. Such COP tools prioritize event information and resource management, in which access to real time data is of primary importance to decision-making processes. Whereas tools contributing to the second group support getting insight into situation. They resemble GIS software, facilitate coordination, and provide insight into the situational context during and after emergency events. Examples include DBS Kart and BarentsWatch Arealverktøy. Therefore, for those solutions we propose a novel term of common situational picture (CSP) tools.
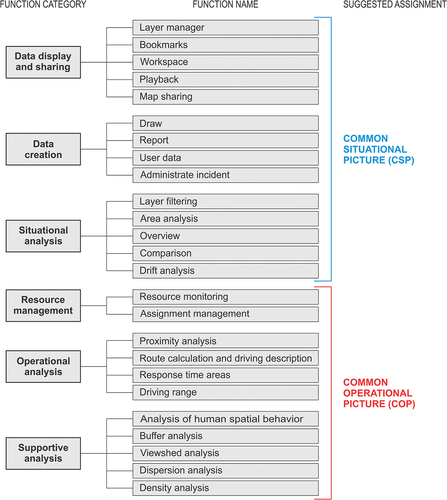
Although COP and CSP tools can employ the same map functions, the essential difference concerns emphasized functionalities and thus, combinations of implemented map functions. Customized combinations of map functions imply gaining operational or situational understanding and thus, facilitate specific decision-making processes. Therefore, we have walked through the collected evidence to identify map functions of value to emergency map support when performing operations, and those that are favorable to gain a comprehensive insight into a situation. As a result, apart from distinguishing a total of 25 map functions, we identified 11 of importance to COP and 14 important for CSP tools, and grouped them into six sub-categories ().
Figure 3. Map functions for common operational picture (COP) and common situational picture (CSP).
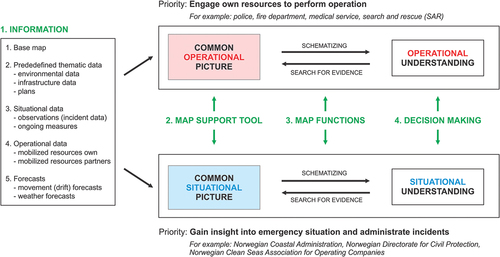
To systematize our investigations and recognize the role of map functions in the whole process of comprehension of an emergency event, we combined two theoretical approaches to establish a conceptual framework (). We adopted the theory of cartographic communication and the concept of sensemaking loop for exploratory data analysis by Pirolli and Card (Citation2005). While the former approach enabled as to frame the concepts, the latter approach, with its foraging and sensemaking loops, enabled us to distinguish “picture” and its “understanding,” and assign to these elements different activities of a given emergency actor.
Figure 4. Common operational picture tools and common situational picture tools in the conceptual framework of our study.
Validation
Nine emergency officers (Table S3) from emergency and rescue institutions and from municipal and county administration were interviewed individually in spring 2022. Although the participants represented specific agencies, some also had experience from previous positions in other institutions such as the police or the military that did not have representatives among our interviewees. The interviews were structured around three issues, which are reported in the three sections below.
Map-based tools for operational and situational picture (Q1)
Four out of the nine participants directly agreed with the proposed division of emergency support systems for COP and CSP tools (see question Q1.1 in the interview guide attached as supplemental online material). Among the statements made, the one presented by a municipal emergency manager (P4) best describes the rationale behind our division:
To me, your division seems very good. We [municipal administration] need to have an overall overview to deal with the incident in an overall manner. (…) If you have a good situation picture, you can make better overall decisions about what the situation requires, and whether one may have to invoke additional resources. For example, do we need civil defense? One may see that the incident is so extensive that we must also have civil defense as well, perhaps even the armed forces, perhaps completely different resources. The municipality has a long resource list from where we can get hold of people with an excavator or with other types of equipment needed, as well as crews who can use these.
A similar statement was provided by P1 who agreed with our proposal and concluded “Yes, this is what I would like to suggest.” As the person further explained, “at a county governor, our situation is that we mostly use the situational picture (…). First responders, the police, fire brigades and so, they (…) use map in an operational picture.” Regarding P4, the person also commented
When an incident occurs, it is the emergency services, either fire or ambulance, or the police, who come and deal with the situation (…). We try to help and support the emergency services as best as we can, so that the incident is handled in the best possible way.
In turn, interviewee P3 was positive about our proposal, but instead of COP, the person used the phrase “mission management” tools. As the person further explained, it is important to ask “what the maps tell and how the maps are used.” Therefore, the phrase mission management better describes the role of such tools as Tellus or TransMed than COP. The same interviewee also added that there is a difference between the map competence of those who use COP and CSP tools. While the former are “users who are professionals, users who do this [use maps] every single day,” the latter are “less professional” users, who use map-based systems occasionally, mainly, for reporting.
Two interviewees were ambivalent about our proposal. As P5 argued, “In some situations (…), there will be a need for a constant switch from COP to CSP.” Therefore, P5 would prefer different map layers, where one could have situational and operational information. Similar reasoning was given by P7 who suggested one system with various entry points for different users.
Three out of the nine interviewees disagreed with our division. P9 pointed out the lack of linkages between the proposed categories and the three levels used in emergency management. As the person put it, “You have to see on what level you work. (…) Is it on the operational, tactical, or strategic level? That is very important because the needs are very different on the different levels.” In turn P6 said “I would rather like to have merged these two [tool categories].” As the person explained, “I am confused on how these two pictures will interact” and how they can be used for planning, “if I push a button somewhere I can go over to planning map.” In turn, P2 commented on the distinction of COP – “although you call it COP, it’s all about (…) fleet management.” The same person was also skeptic about the complexity of tools that we classified as CSP
The digital competence of the user is too low. Why cannot you create a system so simple that when you open something, click something, move something, you have everything you need. Why is it that you almost must be a computer engineer to create common situational awareness on a map?
We also asked (Q1.2) whether the proposed grouping systematizes knowledge on available map support tools for emergency management and thus, facilitates understanding of their roles. Those who generally agreed with the grouping were also positive regarding this question, since as P1 said “there is a lot of confusion among emergency responders” regarding available tools, what they offer. In turn, P3 commented that such grouping helps since developers “sometimes overestimate users’ ability to handle digital tools.” As we further discussed, the user “must have the competence to formulate some kind of requirement specification, how a system needs to be able to handle a crisis, to create a situation picture, or to create an assignment management.” Then, “the people who are going to develop the system, they have to be in a pretty close dialogue with the users, so that they create a system that the users demand and that they want to use.”
Extending or modifying the grouping was the issue addressed in Q1.3. As a result, a clear suggestion concerned the need for a simplified map interface that could be used even without training – as P3 said – “to gain a common situational understanding,” since, “for this, map systems are not used that often.” Even if “one can draw shapes, share, create good overviews, collect a lot of information, but one is unable to create the situational awareness for some reason.” In turn, P1 mentioned about a situational plot, i.e. “a very rough sketch [that is] much simpler than the map with multiple functions” where one “adds layers, layers, layers of information.” An interesting opinion was provided by P2 – “You also have volunteers, non-government NGOs, (…) a lot of different people operating in here. And these systems that are available now are just too complex. So, simplicity is extremely important in my opinion.”
Another clear suggestion concerned planning tools that can be used to answer the question – as P3 expressed – “What do I need to be able to manage the incident?” The interviewee further continued that one “need[s] an analysis tool to be prepared for events to occur.” The need for planning tools was also formulated by P7, who concluded that a tool with well-integrated and easily accessible map functions can be used also for preventing actions, to mitigate potential hazardous events. Lastly, P3 suggested deeper sub-division of COP and CSP tools. According to the interviewee, these two tool categories should be further divided by management level, i.e. for those tools that are used at operational, tactical, and strategic level.
Map functions for decision support in emergency management (Q2)
Although some participants needed extra explanations, all identified 25 map functions were found reasonable (Q2.1). Regarding functions of particular importance to the interviewees, although all functions gained positive comments, P1 pointed to “Layer manager” and “Overview,” P6 to “Draw,” whereas P9 to “Resource monitoring,” “Assignment management,” and “Dispersion analysis;” P4 pointed to “Buffer analysis” and “Dispersion analysis.” The categorization of the map functions was also assessed positively (Q2.2). As P4 put it
I think such a division is good for raising awareness of the use of map functions for the formation of situational and operational picture. So, I think, it makes a lot of sense.
P2 was enthusiastic too and commented
Any person operating the various systems (…), the crisis management system, (…) they need anyhow to do some training, education, whatever. And in that sense, I think the grouping is fair, is okay. You could put different names of them [map functions], but it doesn’t matter. I think they are okay.
The potential of using the grouping in training was also recognized by P7 who emphasized that all identified map functions seem intuitive. However, “training is always essential though” and such a grouping helps to gain necessary competence especially if an emergency actor “does not have any particularly strong expertise in the use of various map functions” (P4). The use of the grouping in acquiring the map competence among emergency officers was indicated by P9 who concluded that
The tool can be really rich when it comes to the functionality; but then, we have to remember that the richer that tool is the more competent the user has to be. So, it can be an important limitation when it comes to improving the tools in use by emergency responders.
As we further discussed, teaching materials are therefore needed, and our categorization can be helpful.
We asked about missing map functions (Q2.3) and again, one common suggestion concerned the absence of those functions that facilitate planning. The lack of such functions was pointed out by P1 and P3; the latter stated that “there should be some map use that is carried out before the event occurs.” The person further mentioned “visibility analysis” and “escape route analysis” as exact examples of the map functions to be of value to planning. P5 also expected map functions “for scenario planning, how (…) situation can escalate or deescalate in the future.” In turn, P6 said that “planning can be carried out both on the operational picture and on the overall situational picture.” Assessment functionality was another example of the map functions of importance to planning since decision-makers should be able to summarize and evaluate preparedness ahead of crisis situations.
Regarding other missing functions, P6 and P7 mentioned “chatrooms.” P6 said that real time chatrooms are useful if combined with maps where the geographical context is provided. One comment (P6) concerned “communication coverage,” i.e. coverage of emergency networks, and one comment (P8) concerned an extended routing functionality that includes exposure to natural hazards such as floods or landslides and thus, verifies, “whether evacuation via road is possible.” As P8 explained, “It could function as a decision support tool for navigation (…) that would be good for ambulance coordinators.” Similarly, P1 said, “It is ok for most people to understand that the road is closed. However, for those who are going to plan where the ambulances are going to drive, they do not care if the road is closed. They care if you can drive through the village if there are detours.”
Map functions for operational and situational picture (Q3)
All but one interviewee (P9) were positive regarding how we assigned map functions to COP and CSP tools. For example, P4 found our division instructive and said
It becomes so concrete how I should be able to use map functions in a good way, to give crisis management the best possible overview.
However, participants also expressed the need for flexibility regarding the design of COP and CSP tools. For example, P8 said, “we do not need any more than address details and how long it takes to get there by an ambulance.” Therefore, the person was skeptic about incorporating to a COP tool more map functions than those related to “Resource management” and “Operational analysis.” In turn, P1 said, “it is a quite good description of the needs over the situation,” but tools are often mixed regarding their roles. P6 also advocated flexibility and said, “I would like to have, for example, dispersion analysis from the supportive analysis group, and, for example, I need that on the situational picture as well.” Having access to COP-related functions in CSP tools was also mentioned by P7 who argued that often those who use CSP tools are former operational police officers, soldiers, paramedics, and over the years have advanced up to a management level.
The following comment concerning the planning role was made by P3: “If the map is to be used for analysis, preferably proactively before an event, then, there is one approach.” However, “If the map is to be used for an event that has occurred, then other needs come in.” The person also commented that map functions of COP tools depend on the context. For example, an operation center located far away from an incident needs the overall analytical gaze – “they need driving route calculations, they need to know evacuation routes and things like that.” In turn,
A task force leader has local knowledge, but will also need details at the local level. Details so that the crew of the task force leader manages to act on the incident and creates a situational understanding.
Regarding P9 who disagreed, the person argued that the role of map depends on the situation and concluded, “it would be fantastic to have all of those functions implemented in a single system.”
Discussion
Requirements regarding the support from map-based emergency tools
Emergency responders who participated in our meetings and those who we interviewed expressed various requirements and needs regarding the support of map-based tools that are to facilitate situational awareness. One factor that determined the requirements was the role of the responder, whether it is to gain an overview to deal with an incident in an overall manner, e.g. for emergency preparedness, or whether the responder is actively involved in responding to the situation at the incident scene. In the former case, the decision support systems in use often resemble GIS software as also reported in previous studies (e.g. Grottenberg & Njå, Citation2017; McNeese et al., Citation2006). In the latter case, when responders need to instantly engage own resources on site, map-based tools are required to support mission management or even offer the fleet management functionality. This, is turn, confirms the finding by Chen et al. (Citation2014) that the required map support combines real time operational information with the GIS functionality. Depending on its role, the responder uses specific map functions to comprehend an emergency situation, it means, to gain necessary situational understanding and awareness (see ). Another identified factor is cartographic literacy. Experienced users, especially those who advanced from operational to managerial positions, have more sophisticated needs than those who use maps occasionally. Moreover, those experienced need less training to start using new map functions.
While COP tools let users administrate their fleets and CSP tools facilitate strategic efforts, planning tools are required to plan both on the operational level and on the overall situational level. Planning tools are important since enable responders to verify procedures without a risk of costly mistakes. Thus, using the tool ahead of, during, or after the crisis situation is another factor that determines the requirements regarding map support.
The validation phase revealed the need for planning tools, e.g. simplified and user-friendly map interfaces that facilitate planning. Surprisingly, information losses (in , see the shift between mapmaker’s understanding of the reality and user’s image of the reality) that seem to be an essential weakness during the cartographic communication process (Ratajski, Citation1978), in some cases are appreciated when creating instant situational awareness. It happens since emergency responders often need simplified emergency “plots”, i.e. maps equipped with only basic functions showing limited and simplified information, just to catch a glimpse of the recent operational or situational picture if a decision needs to be taken in limited time. During the validation phase, when discussing COP and CSP tools, many interviewees expressed the need for tools with simplified map-based interfaces. In some sense SARTopo exemplifies the power of simplicity. This tool is self-explanatory; one displays a map and sees own and others’ positions. In Norway, this system is used as a mapping tool by volunteers engaged in search and rescue operations.
Having tools for planning and those with simplified map-based interfaces as supplementary to the proposed categories of COP and CSP tools is an essential outcome of this study. However, no matter what tool is to be designed, user engagement is always central for the development process. Emergency stakeholders emphasized that their tools need to be developed together with them. As one of the interviewees said “the developer must make suggestions, solutions that satisfy the user, or so that we must have a user who has evolved to adopt the technology that exists.”
Various requirements regarding map support are reflected in the diversity of map-based tools in use by Norwegian emergency responders. Ten tools included in our survey differed in terms of overall functionality, data content, and graphical user interface. Therefore, we divided them into two main categories, i.e. map-based tools for COP and those for CSP. COP tools, as exemplified by Tellus and TransMed, are used mostly by first responders and their priority is to support mission management. Whereas CSP tools exemplified by DSB Kart and Kystinfo are to be used by secondary emergency responders and third parties to gain insight into the situation, understand the context, or to support first responders that cope with the crisis on site. As one of the interviewees said, “Some actors need fleet management functionalities. While this may be a map function that is needed for the police during operation, DSB, the county administrator, municipalities, and others, they just need to keep an eye on the situation.” However, the validation of the proposed division revealed mixed opinions among the interviewees. Although their generally agreed with our point of view, there were also those who disagreed. One common counterargument was the need for a merged approach, for a system that provides a flexible support and integrates both operational and situational picture. Therefore, instead of two different tools, one may prefer access―in a single map system―to two different layers showing operational and situational picture that could be smoothly switched during the comprehension stage of the process of cartographic communication (see ). Such a statement arose our skepticism since a merged approach would lead to overloading a tool with (too) many map functions making it difficult to use.
Map functions of emergency tools
No common norm exists for map support among emergency responders in Norway (Solberg, Citation2018). As a result, although different tools are in use offering various functionality, none of them are considered to fully cover the needs of Norwegian responders (Røed-Bottenvann, Citation2018). There are also local variations in the map services utilized within each sector. This hinders the possibilities for effective information sharing based on a common map interface, and points to a need for more standardization of map support regarding map functions that, in turn, can decrease information loss in the process of cartographic communication. The stakeholder interaction let us discuss various map functions of value to emergency support. Part of the collected thoughts were of generic nature, e.g. that maps as decision support ensure universal communication, are intuitive, and can be used for many purposes. Some attendees provided us with exact suggestions, e.g. to use dynamic labels when hovering over map symbols.
We identified 25 map functions. After the validation process, an inventory with extensive descriptions and examples of all those functions was elaborated and published online (https://folk.ntnu.no/opach/INSITU/functions/Inventory.pdf). The functions were found reasonable, even if an extra clarification was needed. However, the use of map-based systems supporting emergency situations happens in the pressure of time and stress, in the unique environment exposed to risk and significant losses (Kuvedžić Divjak & Lapaine, Citation2014). Hence, it is a challenge to equip a map-based emergency system with adequate functions and thus, to reduce possible information losses resulting from the incorrect map interpretation typical for the cartographic communication process (see ). Therefore, in the validation stage, we asked about map functions of importance to COP tools and those essential for CSP tools. Although most of the interviewees had positive opinions about our proposal of assigning specific functions to either COP or CSP tools, some suggestions were provided, for instance, about the need for flexibility when designing specific tools, and about the lack of planning tools and those with simplified functionality.
Emergency preparedness is fragmented, but is supposed to function through co-operation and interaction, and the situation should be solved at the lowest possible level. Therefore, priority should be given to the integration of the map support regarding various emergency responders who should be able to work on the same map, and also, to equipping the tools with standardized and understandable map functions. One of the interviewees referred to the quick clay slide incident at Gjerdrum that was demanding for the actors involved. Although the rescue operation was successful, various emergency services were present with their own systems, for example, the military came with their system and the municipality used their tools. Instead, in the future, a common picture should be built to ensure proper information sharing.
Conclusions
In the study, we systematically collected adequate data to understand the needs of emergency responders regarding map functions. Two rounds of meetings and interviews and a table-top exercise provided us with the feedback about how map-based decision support tools to be used in emergency response should look and work. Moreover, on the one hand, the stakeholder interaction triggered our increased interest regarding functions of map-based emergency tools and motivated us to address design issues of such tools; however, on the other hand, provided us with the evidence and insights necessary to systematize knowledge on the functionality design of those tools. Next, the survey of map-based decision support tools in use in Norway let us comprehend the diversity of existing design solutions and facilitated building a conceptual framework in the theoretical considerations stage of our study. The framework was next used to categorize map-based tools and describe functions of importance to specific categories.
The role of the emergency responder, the competence in terms of the use of maps, and the application of the latter ahead of, during, or after a crisis situation are three essential factors that determine the requirements regarding map-based tools supporting emergency management. Therefore, the design process of emergency tool of any kind needs to be conducted with an extensive engagement of its target users, who should determine those map functions that are required in their emergency tasks. Moreover, we proposed the division of map-based tools for common operational picture (COP) and common situational picture (CSP). Those, who design such tools should prioritize map functions supporting resource management in the case of COP tools used by emergency responders that are actively involved in responding to the situation at the incident scene, and, in the case of CSP tools, such map functions that provide an overview to deal with an incident in an overall manner, e.g. for emergency preparedness. However, mixed feedback was collected among the stakeholders regarding proposed division. While part agreed, there were also stakeholders who disagreed and expressed the need for a merged approach, in which operational and situational picture are integrated in a single map tool, but accessible as switchable layers. Furthermore, our study revealed an urgent need for planning tools and also, for tools with simplified map functionality to be used even by amateurs without training, e.g. those who voluntarily participate in search and rescue actions.
A total of 25 map functions grouped in six categories were identified as a result of the multistep research process. The functions were also classified as supporting either COP or CSP tools. The validation process confirmed the importance of all identified map functions; however, the feedback from the participants also indicated the need for more research to better elaborate this concept.
Our study can be of value to emergency responders and their educators who gain ready to use tips how to direct their training programs regarding decision-making processes facilitated by map-based tools. Software producers are another group who may benefit from our inventory of map functions as they can discuss them with the customers and implement selected functions in their products.
Supplemental Material
Download MS Word (15.8 KB)Supplemental Material
Download MS Word (620.3 KB)Disclosure statement
No potential conflict of interest was reported by the author(s).
Data availability statement
The data that support the findings of this study are available on request from the corresponding author, [T.O.]. Transcribed interviews used in our study are not publicly available due to their containing information that could compromise the privacy of interviewees.
Supplementary data
Supplemental data for this article can be accessed online at https://doi.org/10.1080/15230406.2023.2264759.
Additional information
Funding
References
- Antkiewicz, R., Najgebauer, A., Pierzchała, D., & Tarapata, Z. (2009). Systemy wspomagania dowodzenia w procesie planowania działań operacyjnych: problemy modelowania, projektowania i integracji [Command support systems in the process of planning operational tasks: Problems of modeling, designing, and integration]. Biuletyn Instytutu Systemów Informatycznych, 3(1), 1–12. https://yadda.icm.edu.pl/baztech/element/bwmeta1.element.baztech-article-BWA0-0041-0043/c/httpwww_bg_utp_edu_plartbisi32009pdfc-biulisi30901.pdf
- Baber, C., Stanton, N. A., Atkinson, J., McMaster, R., & Houghton, R. J. (2013). Using social network analysis and agent-based modelling to explore information flow using common operational pictures for maritime search and rescue operations. Ergonomics, 56(6), 889–905. https://doi.org/10.1080/00140139.2013.788216
- Balakrishnan, B., Pfaff, M., McNeese, M. D., & Adibhatla, V. (2009). NeoCITIES Geo-tools: Assessing impact of perceptual anchoring and spatially annotated chat on Geo collaboration. Proceedings of the Human Factors and Ergonomics Society Annual Meeting, 53(4), 294–298. https://doi.org/10.1177/154193120905300428
- Blandford, A., & Wong, B. W. L. (2004). Situation awareness in emergency medical dispatch. International Journal of Human-Computer Studies, 61(4), 421–452. https://doi.org/10.1016/j.ijhcs.2003.12.012
- Bunch, R. L., & Lloyd, R. E. (2006). The cognitive load of geographic information. The Professional Geographer, 58(2), 209–220. https://doi.org/10.1111/j.1467-9272.2006.00527.x
- Chen, T., Su, G., & Yuan, H. (2014). Creating common operational pictures for disaster response with collaborative work. WIT Transactions on Information and Communication Technologies, 47, 393–400. https://doi.org/10.2495/RISK140331
- Chmielewski, M., & Gałka, A. (2009). Automated mapping JC3IEDM data in tactical symbology standards for common operational picture services. In Proceedings of the military communications and information systems conference MCC.
- Endsley, M. R. (1995). Toward a theory of situation awareness in dynamic systems. Human Factors, 37(1), 32–64. https://doi.org/10.1518/001872095779049543
- Fertier, A., Barthe-Delanoë, A. M., Montarnal, A., Truptil, S., & Bénaben, F. (2020). A new emergency decision support system: The automatic interpretation and contextualisation of events to model a crisis situation in real-time. Decision Support Systems, 133, 113260. https://doi.org/10.1016/j.dss.2020.113260
- Friedmannová, L. (2010). Designing map keys for crisis management on the regional operational and informational centre level: Monitoring transport of dangerous goods via contextual visualisation. In M. Konečný, S. Zlatanova, & T. L. Bandrova (Eds.), Geographic information and cartography for risk and crisis Management. Lecture notes in geoinformation and cartography (pp. 425–437). Springer.
- Furland, S. (2013). Nyheter fra locus public safety. https://docplayer.me/1198196-Nyheter-fra-locus-public-safety.html
- Gotz, D., & Zhou, M. X. (2009). Characterizing users’ visual analytic activity for insight provenance. Information Visualization, 8(1), 42–55. https://doi.org/10.1057/ivs.2008.31
- Grottenberg, L. O., & Njå, O. (2017). Applying a systems safety approach to the development of GIS in the Norwegian emergency management domain. In M. Čepin & R. Briš (Eds.), Safety and reliability. Theory and applications (pp. 484–484). CRC Press. https://doi.org/10.1201/9781315210469-417
- Hwang, G. H., & Yoon, W. C. (2020). A new approach to requirement development for a common operational picture to support distributed situation awareness. Safety Science, 125, 104569. https://doi.org/10.1016/j.ssci.2019.104569
- Inderhaug, E. (2018). Nå får operasjonssentralene nytt kartsystem [The operation centers are now getting a new map system]. Politiforum. https://www.politiforum.no/na-far-operasjonssentralene-nytt-kartsystem/148804
- Kolačny, A. (1969). Cartographic information – A fundamental concept and term in modern cartography. The Cartographic Journal, 6(1), 47–49. https://doi.org/10.1179/caj.1969.6.1.47
- Kuvedžić Divjak, A., & Lapaine, M. (2014). The role of the map in a crisis management environment: Applying the theory of cartographic communication and visualization. Collegium Antropologicum, 38(1), 187–193. https://hrcak.srce.hr/121036
- Lu, Q., Xu, W., Zhang, H., Tang, Q., Li, J., & Fang, R. (2020). ElectricVIS: Visual analysis system for power supply data of smart city. The Journal of Supercomputing, 76(2), 793–813. https://doi.org/10.1007/s11227-019-02924-4
- Luokkala, P., Nikander, J., Korpi, J., Virrantaus, K., & Torkki, P. (2017). Developing a concept of a context-aware common operational picture. Safety Science, 93, 277–295. https://doi.org/10.1016/j.ssci.2016.11.005
- McNeese, M. D., Pfaff, M. S., Connors, E. S., Obieta, J. F., Terrell, I. S., & Friedenberg, M. A. (2006). Multiple vantage points of the common operational picture: Supporting international teamwork. Proceedings of the Human Factors and Ergonomics Society Annual Meeting, 50(3), 467–471. https://doi.org/10.1177/154193120605000354
- Opach, T., Rød, J. K., Munkvold, B. E., Radianti, J., SteenTveit, K., & Grottenberg, L. O. (2020). Map-based interfaces for common operational picture. In A. L. Hughes, F. McNeill, & C. Zobel (Eds.), Proceedings of the 17th international conference on information systems for crisis response and management (pp. 506–516). ISCRAM. https://idl.iscram.org/files/tomaszopach/2020/2249_TomaszOpach_etal2020.pdf
- Pfeiffer, L., Müller, N. H., & Rosenthal, P. (2015). A survey of visual and interactive methods for air traffic control data. In E. Banissi & M. W. McK. Bannatyne, & F. Bouali (Eds.), 19th international conference on information visualization (pp. 574–577). IEEE. https://doi.org/10.1109/iV.2015.102
- Pirolli, P., & Card, S. (2005). The sensemaking process and leverage points for analyst technology as identified through cognitive task analysis. In ProceedIngs of the 2005 international conference on intelligence analysis. https://www.e-education.psu.edu/geog885/sites/www.e-education.psu.edu.geog885/files/geog885q/file/Lesson_02/Sense_Making_206_Camera_Ready_Paper.pdf
- Ratajski, L. (1978). The main characteristics of cartographic communication as a part of theoretical cartography. International Yearbook of Cartography, 18, 21–32.
- Røed-Bottenvann, S. (2018). Papirkart er viktigst – men savner digital fellesløsning [Paper maps are most important – but lack a common digital solution]. Posisjon Magasinet for Geomatikk, 26(3), 8–9. https://geoforum.no/wp-content/uploads/2018/10/Posisjon_03_2018.pdf
- Seppänen, H., Mäkelä, J., Luokkala, P., & Virrantaus, K. (2013). Developing shared situational awareness for emergency management. Safety Science, 55, 1–9. https://doi.org/10.1016/j.ssci.2012.12.009
- Solberg, S. (2018). Håndbok for redningstjenesten. Systembeskrivelse – prinsipper – verdier (Nivå 1) [Handbook for the rescue service. System description – principles – values]. Hovedredningssentralen. https://www.hovedredningssentralen.no/wp-content/uploads/2018/09/Den-norske-redningstjenesten.pdf
- Steen-Tveit, K., & Munkvold, B. E. (2021). From common operational picture to common situational understanding: An analysis based on practitioner perspectives. Safety Science, 142, 105381. https://doi.org/10.1016/j.ssci.2021.105381
- Wu, A., Convertino, G., Ganoe, C., Carroll, J. M., & Zhang, X. L. (2013). Supporting collaborative sense-making in emergency management through geo-visualization. International Journal of Human-Computer Studies, 71(1), 4–23. https://doi.org/10.1016/j.ijhcs.2012.07.007