
 ?Mathematical formulae have been encoded as MathML and are displayed in this HTML version using MathJax in order to improve their display. Uncheck the box to turn MathJax off. This feature requires Javascript. Click on a formula to zoom.
ABSTRACT
The estuary is dominated by sea ice and snow cover from winter to spring, and a highly turbid meltwater plume during summer. The aims were to quantify the variability in optical conditions, inorganic nutrients, and primary production between these two extremes, and identify the drivers of variability. Data were obtained during a summer cruise along a transect in the estuary in August 2007, and a spring campaign on the ice in March 2011. The study comprises conductivity, temperature, and depth (CTD), Kd(PAR), Kd(λ), PAR transmittance, photic depth, chl-a, nutrients (NO3, NO2, NH3, PO4, and SiO2), primary production, and sediment concentrations. PAR transmittance varied between 5% below snow and ice and 85% in clear water with 44% in turbid meltwater. Primary production rates were similar below the ice in March (76.8 mg C m−2 d−1) and in the highly turbid meltwater in August (94.8 mg C m−2 d−1), but higher (246.6 mg C m−2 d−1) at the mouth of the fjord. Meltwater inflow was the main driver of variability during summer and the snow and sea ice during spring. Under-ice primary production will increase three-fold with less snow on the sea ice, and the higher meltwater turbidity with increased melting of glacial ice and runoff will only reduce primary production slightly.
Introduction
A multitude of rivers in areas covered by glaciers and ice caps in Polar regions supply large amounts of fine-grained sediments with their meltwater into estuaries and fjords during summer (e.g., Hasholt et al. Citation2012; Kuzyk et al. Citation2008; Retamal, Bonilla, and Vincent Citation2008; Syvitski, Burnell, and Skei Citation1987). Light attenuation is high in meltwater (Lund-Hansen et al. Citation2010), which reduces light for photosynthesis and thus primary production (Hop et al. Citation2002; Piwosz et al. Citation2009; Retamal, Bonilla, and Vincent Citation2008; Svendsen et al. Citation2002). In comparison, many of these same fjords and estuaries are covered during winter and spring by sea ice and snow (Syvitski, Burnell, and Skei Citation1987), which strongly attenuate light (Grenfell and Maykut Citation1977; Mundy, Barber, and Michel Citation2005; Perovich et al. Citation1993) and thereby reduce light for photosynthesis and primary production, both within the ice and below (Lund-Hansen et al. Citation2017). Transitions between the summer turbid meltwater state and the winter/spring sea-ice state follow a clear annual cycle of air-temperature variation. These are likely to be highly sensitive to increased atmospheric temperatures and respond strongly to differences in annual temperature cycles (Hanna et al. Citation2008; Overeem et al. Citation2015). Polar regions are in focus because of climate change (Parkinson et al. Citation1999; Thompson Citation2010), because higher air temperatures will increase freshwater runoff from glaciers and ice caps (Hanna et al. Citation2008) and thereby increase discharges of turbid meltwater into fjords and estuaries (Hasholt et al. Citation2012). Increased air temperatures will also reduce the time when fjords and estuaries are covered by ice and snow, leading to longer periods when turbid meltwater dominates. As part of ongoing fjord and estuarine research and their climate-change responses, there is a need for reference points in the Polar regions. This is here accomplished for the first time based on comparison and quantification of spring and summer optical properties, nutrient concentrations, and primary production rates in the upper parts of the water column in the same estuary (Kangerlussuaq, Greenland) using the same methods and instrumentation. The four specific questions addressed are: (1) What are the differences in optical properties in terms of transmittance and attenuation coefficients between summer meltwater and winter snow/ice conditions? (2) Are there differences in nutrient concentrations below sea ice and in the meltwater and why? (3) What is the primary production below the winter sea ice compared to summer meltwater and does production vary with meltwater sediment concentrations? (4) How will increased air temperatures and increased inflow of turbid meltwater change primary production in the Kangerlussuaq estuary?
Study area
Kangerlussuaq is a 180 km long, narrow (1–5 km) southwest–northeast-oriented estuary located at the Arctic Circle in southern west Greenland (66.8 N, 51.5 E), with a total surface area of about 490 km2 and classified as a fjord-type estuary (Lund-Hansen et al. Citation2010; ). It consists of a relatively shallow (30–40 m depth) outer part with a sill, which connects to the open ocean, and a deep-water inner part with depths up to 280 m. The tide is diurnal with a maximum spring tide tidal range of about 3 m (Nielsen, Erbs-Hansen, and Knudsen Citation2010). Kangerlussuaq is covered by winter ice up to 70 cm thick (Lund-Hansen et al. Citation2014) between November and May (Basse Vængtoft, former manager at Kangerlussuaq International Science Support, personal communication, March 20, 2011). The Watson River, which connects the Greenland Ice Sheet and Kangerlussuaq (), discharges sediment-loaded meltwater into Kangerlussuaq between May and September, with an average discharge of about 514 m3 s−1, which can reach a peak of nearly 3,000 m3 s−1 (Overeem et al. Citation2015). The average sediment transport in the Watson River is about 60,480 tons d−1 (Hasholt et al. Citation2012). The climate is continental because of the proximity of the Greenland Ice Sheet (Hanna et al. Citation2008), with winter temperatures as low as −30°C and low precipitation of about 5 mm month−1 during December–July, and summer average temperatures up to 10–20°C (Cappelen Citation2017).
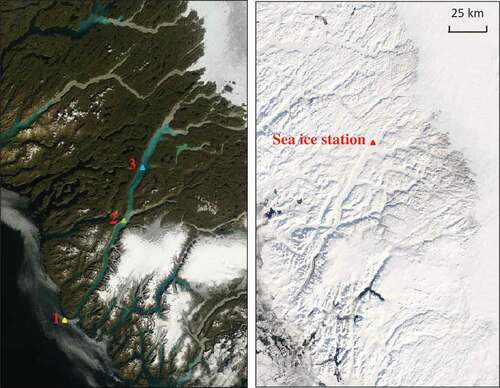
Figure 1. MODIS images of the study area in August 2007 and March 2008. The red triangle shows the ice station in March 2011, and summer ice-free stations are shown in yellow (station 1), green (station 2), and blue (station 3)
Materials and methods
Conductivity, temperature, and depth (CTD), optical sensors, and data processing
Data from the meltwater period were obtained during a cruise in August 2007 with CTD and sampling stations along a transect in Kangerlussuaq. We used a Seabird (SBE 19 Plus) CTD equipped with a Niskin bottle (5 l) for water sampling. A PAR (photosynthetic active radiation) sensor (LI-192, Licor.com) and a RAMSES (UV/VIS) hyperspectral radiometer (trios.com) were mounted on the CTD metal frame for measuring PAR (400–700 nm) and spectral irradiance (320–920 nm). A PAR surface censor (LI-191) connected to a dataloggger was mounted as high as possible on the ship to get continuous (5 min) PAR readings during the cruise. A recently calibrated Wetlabs C-Star transmissometer (660 nm) mounted on the CTD was applied to derive vertical distribution of suspended particulate matter (SPM). Water samples from about 1 m depth were sampled for primary production, SPM, nutrients, and chl-a at positions along the transect (Lund-Hansen et al. Citation2010). Data from a sea-ice covered period were obtained in March 2011 at a fixed field site in Kangerlussuaq (). We measured downwelling PAR (LI-192) below the ice with a sensor mounted on a 1 m underwater L-arm. PAR albedo was measured with two PAR sensors (LI-191), one for downward and one for reflected irradiance (albedo). Surface and under-ice PAR data were obtained in a fully undisturbed, snow-covered area with snow thickness of 10 cm. In addition, a 10 × 10 m area was cleared of snow, and optical sensors were placed centrally to measure the optical properties of the ice alone. Spectral downwelling irradiance (320–920 nm) at depths below the ice was obtained with the TriOS spectroradiometer mounted on a Seabird 19 Plus CTD lowered through a small hole in the ice, which was covered and filled with snow and small chunks of ice to minimize artificial light entering the hole. Diffuse attenuation coefficients Kd(PAR) for the water were derived through
Nutrients, CHL-a, and suspended matter
Analyses of ammonia (NH3), nitrate (NO3), nitrite (NO2), silicate (Si(OH)4), and phosphorus (PO4) were conducted on filtered (Millipore Millex-GP hydrophilic PES 0.22 µm) seawater samples that were frozen and kept at −18°C and brought to Denmark. They were analyzed with a SANPLUS System Scalar auto-analyzer at the National Environmental Research Institute (NERI), Denmark, based on a modified Grasshoff, Ehrhardt, and Kremlin (Citation1999) protocol. Ice nutrient concentrations were scaled to seawater following Manes and Gradinger (Citation2009). An exact volume (0.5–1 l) of water was filtered through GF75 Advantec glass fiber filters with a nominal pore size of 0.3 μm for chl-a, using a maximum vacuum of 30 kPa. Filters were packed in aluminum foil envelopes, frozen at −18°C, transported to Denmark, and extracted in 5 ml 96 percent ethanol at 5°C in the laboratory for chl-a analyses. Absorbances of the supernatant were measured at 665 nm and 750 nm with a spectrophotometer (Thermo Spectronic HELIOS λ), and were converted into chl-a concentrations following Strickland and Parson (Citation1972). An exact volume (0.5–1 l) of water was filtered through precombusted Whatman GF-F glass fiber filters (0.7 μm pore size) for SPM, and filters were dried and weighed. See Lund-Hansen et al. (Citation2010) for further details.
Primary production
Carbon incorporation was determined using the 14C-incubation method, modified after Steemann-Nielsen (Citation1952). Water samples for primary production were collected at a 1 m depth in August and at a 1 m depth below the sea ice in spring using a Niskin-like water sampler. The samples were carefully mixed to distribute algae evenly and 1 L was enriched with 14C. The enriched sample (specific activity = 60 μCi 14C l−1) was distributed in 8 × 60 ml NUNC incubation bottles and two reference samples in complete darkness. Light intensity in the light-incubated bottles was reduced exponentially in the incubator by a light-attenuating mesh system (50 percent reduction after each sample), and the incubation time was four hours at in situ temperature. Samples of ice for primary production were collected using a 90 mm KOVACS ice auger, and bottom slices (3 cm) were sectioned using a stainless-steel saw. Samples were transferred to the laboratory and thawed in the dark overnight at 4°C in filtered seawater at a volumetric ratio of 1:1 ice:water. Thawed samples were carefully mixed the following day to distribute algae evenly, and 200 ml of the sample was enriched with 14C to a concentration of 60 μCi 14C l−1. The enriched samples were distributed in three 60 ml NUNC bottles, and incubated for four hours in a cooled water bath (−1.5°C) with one sample for incubation and two in complete dark for reference. A quartz halogen light source (OSRAM Powerstar HQI-E) was used both on the ship and in the laboratory. After incubations, 200 μl 0.5 N HCl was added to each bottle to stop carbon incorporation and remove excess carbonate, and each water sample was filtered onto an Advantec GF75 filter. Filters were placed in scintillation vials, scintillation liquid was added, and samples were returned to the laboratory in Denmark for scintillation counting. Incubations were carried out on the ship during summer and in the laboratory at Kangerlussuaq International Science Support (KISS) in March. The light saturation point (Ek) was not reached in August but was assumed to be 400.0 µM photons m−2 s−1, and was applied to derive Pmax through α, which is the slope of the obtained regression line between production (P) and irradiance (I) at incubation. Light saturation points were reached for the below-ice samples and the Jassby and Platt (Citation1976) equation was applied to derive Pmax, α, and Ek. The bottom section of the sea-ice sample was incubated for four hours at an average under-ice PAR of 15 µmol m−2 s−1. The light response of the sea-ice samples and derived parameters were obtained from algae in intact bottom-ice sections by means of rapid light curves (RPL) based on fluorescence imaging using an Imaging-PAM (Hawes et al. Citation2012). Primary production was accordingly calculated by the Jassby and Platt (Citation1976) relations, with the measured light-attenuation coefficient Kd(PAR). Production was integrated over the photic depth (Z0) for every hour of light during the day based on measured surface PAR both in March and August. Z0 was calculated as the depth to which photosynthesis can occur (Falkowski and Raven Citation2007), given by Z0 = 4.6/Kd(PAR) with Kd(PAR) for the water column. Reflectance and albedo, which both reduce PAR in the water column, were accounted for in the calculations. The sea-ice sample primary production was calculated for every hour of light at 0.5 m depth with the measured PAR and integrated throughout the day.
Results
Spring and summer SPM, salinity, and temperatures
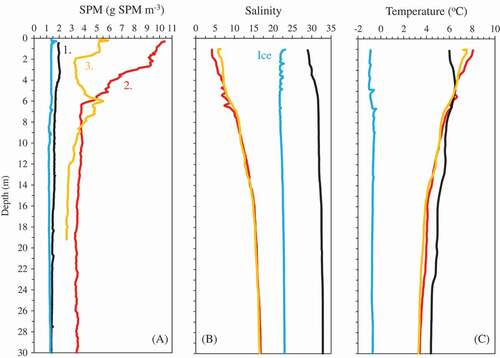
The SPM concentrations were low (1.5–2 g SPM m−3) at station 1 and below the ice, but significantly higher at the inner station 3 (~5 g SPM m−3) and station 2 (~10 g SPM m−3), with a clear surface SPM plume down to about 6–7 m (). Salinity was low around 4–6 at meltwater stations in summer, which emphasizes the freshwater influence here, compared to a salinity of 29 at the mouth of the estuary (). The water column was stratified by salinity and temperature in the upper photic zones of the water column, and only in summer ().
Figure 2. (A) Suspended particulate matter (SPM; g m−3); (B) salinity; and (C) temperature (°C) versus depth at the ice station (blue line) and at summer stations 1 (black), 2 (red), and 3 (orange)
Spring and summer optical properties
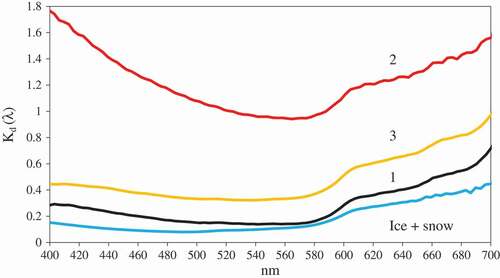
Optical conditions are composed of four different states: spring sea ice with a snow cover, sea ice without snow, summer meltwater (i.e., stations 3 and 2), and station 1 at the mouth of the estuary (). Snow PAR albedo was 0.8 and 0.65 for bare ice, and water-leaving reflectance R(-O, PAR) was 0.10 at station 1. Albedo was slightly higher (0.15) at stations 3 and 2 with higher SPM concentrations and thus higher scattering. Net PAR transmittance was different in the four cases, with only 5 percent for the ice and snow, 60 percent for bare ice, 44 percent for station 2, 68 percent for station 3, and 85 percent at station 1 (). This demonstrated that transmittance was even lower at the high SPM meltwater station 2 compared to bare ice. Low transmittance at stations 2 and 3 was related to the strong light attenuation in the meltwater, evident from Kd(PAR) = 1.32 m−1 (station 2) and Kd(PAR) = 0.5 m−1 (station 3). The photic depth (Z0) was 13 m below the ice, 38 m at station 1, and only 4 m at the high SPM meltwater station 2. The difference in photic depths strongly emphasizes the effects of SPM. High SPM also changed the spectral composition of the light as shown by the spectral attenuation coefficient Kd(λ), with minimum values in low turbid waters below the ice and at station 1. The attenuation coefficients are 4–5 times higher as compared to station 1 (). There were also clear differences in the relative attenuation, which was stronger in the blue part of the spectrum at station 2 compared to the other stations and related to increased scattering in the high SPM meltwater. This was supported by calculations (Philips and Kirk Citation1984) of the scattering coefficient, which was only 0.5 m−1 at station 1, but eleven times higher (5.7 m−1) at the high SPM meltwater station 2.
Figure 3. Spring albedo (snow and ice), summer reflectance (meltwater), net transmittance (%, in bold), and photic depths Z0 (m) for (A) snow-covered ice, (B) bare ice, (C) meltwater with medium (station 3) and high SPM (station 2), and (D) station 1
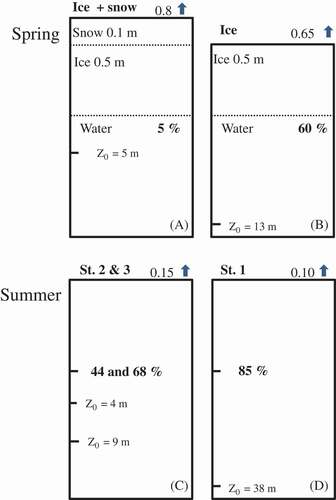
Figure 4. Spectral attenuation coefficient Kd(λ) in water below at ice station (blue line) and at summer stations 1 (black), 2 (red), and 3 (orange) between 400 and 700 nm
Nutrients
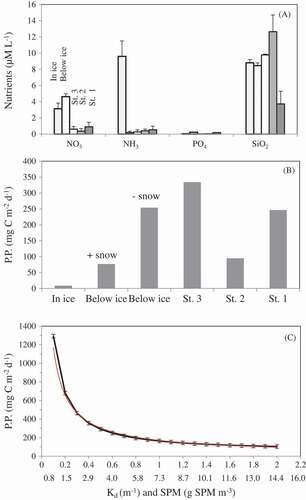
The NO3 concentration in the water below the ice was 4.60 µmol l−1 and was higher than the average of 0.62 µmol l−1 at summer stations 3, 2, and 1; PO4 concentrations were also low, both in the ice, below the ice, and at summer stations (). Si concentrations were about 10 µmol l−1 and were similar in and below ice and at summer stations, except for station 1, and were related to the origin of the glacial meltwater entering the estuary, which contains high amounts of Si (Yde et al. Citation2014). Station 1 at the estuary mouth was least influenced by the freshwater, with a surface salinity of 28.9, and it contained less Si.
Figure 5. (A) Nutrient (NO3, NH3, PO4, and SiO2) concentrations (µmol L−1) in the ice, in the water below the ice, and at stations 1, 2, and 3; (B) primary production (mg C m−2 d−1) in the ice, in water below the ice with and without snow, and at stations 1, 2, and 3; (C) modeled primary production (mg C m−2 d−1) in the meltwater as a function of both light attenuation coefficient (Kd(PAR)) – upper x-axis and SPM (mg SPM m−3) – lower x-axis
Primary production
Summer primary production was highest (334.1 mg C m−2 day−1) at station 3, compared to the mouth of the estuary (246.6 mg C m−2 day−1), and lowest at station 2 (94.8 mg C m−2 day−1; ). Spring primary production in the ice was low (8.6 mg C m−2 day−1), but was about ten times higher (76.8 mg C m−2 day−1) than this in the water column below the snow-covered ice at 5 percent transmittance. With no snow cover, transmittance reached 60 percent below the ice, and production increased to 254.0 mg C m−2 day−1, which is nearly three times higher than with a snow cover, and equal to the station 1 summer production (246.6 mg C m−2 day−1; ). Primary production clearly varied with transmittance and, thus, light attenuation in the water, and we calculated the production as a function of a range of SPM concentrations and, thus, Kd(PAR) at constant surface PAR to evaluate the effects on the production at an increase in SPM. The photosynthetic parameters (Pmax, α, and Ek) from stations 2 and 3 were applied in this evaluation, and results show a clear decrease in production with an increase in SPM and conversely in light attenuation (). The relation between SPM and primary production was described (r2 = 0.99) by the power function: 170.9x−0.84. The calculated average production ranges from an average of 1292.2 ± 19.5 mg C m−2 day−1 at 0.8 g SPM m−3 but reduced to 356.2 ± 19.2 mg C m−2 day−1 at a three times higher SPM. Results also show that primary production will only decrease slightly with further increased SPM, once SPM in the meltwater is greater than 4–5 g SPM m−3.
Discussion
Here we applied net transmittance, accounting for albedo and water-leaving reflectance, for a comparison of transmittance through ice, snow, and water. Removal of a 10 cm snow cover increased transmittance from 5 to 60 percent, which emphasizes that snow is an efficient regulator of light transmittance (Lund-Hansen et al. Citation2014; Perovich et al. Citation1993), which is also reflected in the very high Kd(PAR) = 11.9 m−1 of the snow compared to a Kd(PAR) = 0.84 m−1 for the ice. The water column below the ice in spring was comparatively clear, with a low Kd(PAR) = 0.32 at low chl-a (0.1 mg chl-a m−3; Lund-Hansen et al. Citation2010) and low SPM (1–2 mg SPM l−1) concentrations. Transmittance in summer was clearly related to SPM in the meltwater as with a transmittance of 44 percent at station 2 in high (10.1 g SPM m−3) SPM meltwater. The low meltwater transmittance and the high Kd(PAR) = 1.32 m−1 are related to a very strong light scattering by fine-grained sediment particles and flocculated material in Kangerlussuaq (Lund-Hansen et al. Citation2010). The scattering was also emphasized by the high scattering coefficient (5.7 m−1) at the inner station 2 compared to 0.5 m−1 at the outer station 1. The strong scattering also changed the spectral composition of the light, as at station 2 where the high Kd(λ) in the blue part of the spectrum, compared to the other stations, was related to scattering at high SPM. Phytoplankton has a very strong absorption peak in the blue part of the spectrum around 480 nm (Falkowski and Raven Citation2007), and it is suggested that reduced blue light might have contributed to the significantly lower production at station 2. CDOM is also a strong absorber in the blue part of the spectrum (Kirk Citation1994), but previous studies have shown that CDOM absorption coefficients are low in Kangerlussuaq (Lund-Hansen et al. Citation2010), and here are assumed to be of less importance compared to the SPM.
Nutrients
The below-ice NO3 concentration in Kangerlussuaq is about half that measured below ice in March in Kobbefjord (Mikkelsen, Rysgaard, and Glud Citation2008), a small fjord near Nuuk some 250 km south of Kangerlussuaq. The PO4 levels are, alternatively, similar to those in Kobbefjord. Summer NO3 concentrations in Kangerlussuaq are about half of those measured in August near the entrance to the Godthåbs Fjord, and PO4 is about a third (Juul-Pedersen et al. Citation2015). This shows that concentrations of NO3 and, to a lesser extent, PO4 in both spring and summer are lower in Kangerlussuaq compared to other fjords in the area. Kangerlussuaq is an estuary and is strongly influenced by the extensive inflow of turbid meltwater during summer, whereas only the inner parts of the Godthåbs Fjord are influenced by meltwater. There is, in comparison, a transport of NO3 into Kangerlussuaq with the meltwater, shown by the concentrations of 2–4 µmol L−1 in the meltwater near the Greenland Ice Sheet measured in June 2007 (Yde et al. Citation2014). This corresponds to our measured NO3 concentrations of 1.2 ± 0.27 µmol L−1 in August 2007 where meltwater enters the estuary. There was also a significant transport of Si into the estuary with the meltwater, as reflected in the high Si concentrations at stations during both spring and summer (Yde et al. Citation2014). A comparable export of Si with meltwater has also been observed in the large glacial influenced Godthåbs Fjord south of Kangerlussuaq (Meire et al. Citation2016). The difference in NO3 of about 2 µmol L−1 between spring and summer concentrations could be related to NO3 uptake by photosynthesis and primary production, although the water was not depleted of NO3, related to the inflow of NO3 with the meltwater.
Primary production
The primary production rates reported here are gross primary production rates. Respiration rates were assumed to be low, as they are reduced in cold water (Sampou and Kemp Citation1994; here between −1.5°C below the ice and about 7°C). Respiration depends further on chl-a concentrations (Marra and Barber Citation2004), which were also low here (0.2 mg chl-a m−3 spring, and 1.2 mg chl-a m−3 in the surface meltwater). The in-ice production of 8.6 mg C m−2 d−1 in this study is similar to other Greenland fjords; for example, 10 mg C m−2 d−1 in the high Arctic Young Sound (Rysgaard, Nielsen, and Hansen Citation1999), and 15.0 mg C m−2 d−1 in Kobbefjord (Mikkelsen, Rysgaard, and Glud Citation2008). Production below snow-covered ice of 76.8 mg C m−2 d−1 is also comparable to production rates at these sites. In summer, the estuary mouth production of 246.6 mg C m−2 d−1 is very similar to the August production of 200 mg C m−2 d−1 in Disko Bay north of Kangerlussuaq (Levinsen and Nielsen Citation2002) and the average of 340.0 mg C m−2 d−1 for sixteen west Greenland stations (Jensen et al. Citation1999), and about half of the 500 mg C m−2 d−1 in the Godthåbs Fjord south of Kangerlussuaq (Juul-Pedersen et al. Citation2015). Compared to the Godthåbs Fjord (Juul-Pedersen et al. Citation2015), we have never observed any chl-a maximum in Kangerlussuaq either during summer or spring, and our study was accordingly focused on the upper parts of the water column. Chl-a maximas may contribute significantly to the total primary production (Weston et al. Citation2005). There is generally a strong phytoplankton bloom and high primary production following the ice breakup in late spring in ice-covered waters (Fortier et al. Citation2002). Such a production can reach up to 275 mg C m−2 d−1 in Young Sound (Rysgaard, Nielsen, and Hansen Citation1999) and 5,000 mg C m−2 d−1 in Kobbefjord (Mikkelsen, Rysgaard, and Glud Citation2008). A similar seasonal variation in production during spring thawing is likely in Kangerlussuaq, although a short strong bloom does not contribute significantly to the total production. However, we do not have a seasonal primary production signal for comparison of total spring and total meltwater production as we do for Kobbefjord, where sea-ice production was 0.8 g C m−2 compared to 94.4 g C m−2 in the water column (Mikkelsen, Rysgaard, and Glud Citation2008). It is emphasized, for these reasons, that production was measured and calculated for periods where measured PAR and number (n = 12) of daylight hours (PAR > 10.0 m−2 s−1) were the same in both seasons. Photosynthesis is based on availability of light and nutrients, where photosynthesis both in and below ice are assumed to be light limited in spring (Arrigo, Matrai, and Dijken Citation2011), which is also the case in Kangerlussuaq. This is demonstrated by the 3–4 times higher nutrient (NO3 and PO4) concentrations below the ice than in the meltwater. Data (Lund-Hansen, unpublished data) from March 2008 in Kangerlussuaq at similar nutrient concentrations gave chl-a absorbance ratios 480/665 < 1, a strong indication that plankton is not nutrient-limited (Heath, Richardson, and Kiørboe Citation1990). Nutrients were not totally depleted in the meltwater, with NO3 concentrations at about 0.8 µmol L−1 in comparison to Young Sound following a bloom where NO3 was below detection limits (Rysgaard, Nielsen, and Hansen Citation1999). That nutrients were not depleted in Kangerlussuaq might be attributed to the supply of NO3 in the glacial meltwater (Yde et al. Citation2014), and is substantiated by our NO3 measurements in the meltwater at the head of the estuary. This indicates that production could be light-limited also in summer. For instance, production was 3.5 times higher (334.2 mg C m−2 d−1) at station 3 compared to station 2 (94.8 mg C m−2 d−1), with only light attenuation being the main difference, as photosynthetic parameters (Pmax, α, and Ek) and nutrient concentrations were similar at stations. Reduced primary production related to high turbidity has been observed in the Arctic Mackenzie River estuary, with 54 mg C m−2 d−1 at inner turbid parts, and 306 mg C m−2 d−1 at the shelf (Retamal, Bonilla, and Vincent Citation2008) in other Arctic fjords (Hop et al. Citation2002; Svendsen et al. Citation2002) and in temperate estuaries (Cloern Citation1987; Cloern and Jassby Citation2010; Gameori, Zwolinski, and Brotas Citation2011). It is reasoned that the reduced primary production in turbid waters is caused by a higher scattering at a higher number of sediment particles in suspension, which again increases the probability that photons are absorbed and no longer available for photosynthesis (Kirk Citation1994). Here we also observed significant changes in spectral composition and strong attenuation in the blue part of the spectrum where phytoplankton has an absorption maximum (Falkowski and Raven Citation2007), which might also be part of the explanation for a reduced primary production in turbid waters.
Drivers
A purpose of this study was to identify the drivers of the variability in optical conditions, nutrients, and primary production, which in summer is the inflow of highly turbid meltwater that lasts for about five months from late May to late September (Hasholt et al. Citation2012). The driver of variability in winter and spring is the development of sea ice with a snow cover, which overlays the estuary from mid-November until the end of May. The ultimate driver of both summer and winter/spring variability is the seasonal variation in air temperature, which can be as low as −30°C in winter and spring with sea ice covering the estuary, have summer temperatures up to 10–20°C with melting in the ablation zone of the Greenland Ice Sheet (Hanna et al. Citation2008), and have turbid meltwater that flows into the Kangerlussuaq estuary. However, the higher air temperatures and increased meltwater discharges will ultimately give way to a longer season where the Kangerlussuaq estuary is dominated by turbid meltwater.
Perspectives on primary production
Our determination of primary production with photosynthetic parameters unaffected by Kd(PAR), and implicitly SPM, demonstrates that an increase in SPM greater than 4–5 g SPM m−3 will not reduce production significantly, whereas production is sensitive to changes in SPM less than 4.0 g m−3 because of the powerfuntion relationship between light attenuation and photosynthesis. This indicates that the observed increased melting of ice caps and glaciers and higher meltwater discharges (Van As et al. Citation2012; Hanna et al. Citation2008) will not reduce primary production significantly in the estuaries and fjords receiving the meltwater, provided that SPM in the meltwater is higher than a certain level, in this case 4–5 g SPM m−3. This finding needs further research, but it is evident from this and other studies that higher meltwater discharges with increased SPM concentrations will reduce primary production, especially in areas of the estuaries and fjords not previously affected by meltwater, or in areas with previously low SPM concentrations. This is substantiated by the significantly positive correlation between meltwater discharge and plume size in Kangerlussuaq (McGrath et al. Citation2010), as well as with a tendency of increased annual discharges in Kangerlussuaq (Overeem et al. Citation2015). Increased Arctic air temperatures are predicted to increase precipitation and snowfall, although the extent of the snow cover will be reduced (Callaghan et al. Citation2011; Warren et al. Citation1999). In comparison, we showed here that primary production will increase about threefold below the ice without a snow cover, which in all indicates that production at higher air temperatures will increase in spring and be reduced in summer.
Acknowledgments
Kangerlussuaq International Science Support is thanked for logistical help and support during spring field work, and also the Captain and crew of Navarana.
Additional information
Funding
References
- Arrigo, K. R., P. A. Matrai, and G. L. Dijken. 2011. Primary productivity in the arctic ocean: Impacts of complex optical properties and subsurface chlorophyll maxima on large-scale estimates. Journal of Geophysical Research 116:1. doi: https://doi.org/10.1029/2011JC007273.
- Callaghan, T. V., M. Johansson, R. D. Brown, P. Y. Groisman, N. Labba, V. Radionov, R. G. Barry, O. N. Bulygina, R. L. H. Essery, D. M. Forlov, et al. 2011. The changing face of the arctic snow cover: A synthesis of observed and projected changes. Ambio 40:17–11. doi: https://doi.org/10.1007/s13280-011-0212-y.
- Cappelen, J. 2017. Weather observations from Greenland 1958–2016: Observation data with description. DMI Report 17-08, Danish Meteorological Institute, Copenhagen, 31 pp.
- Cloern, J. E. 1987. Turbidity as a control on phytoplankton biomass and productivity in estuaries. Continental Shelf Research 11:1367–81. doi:https://doi.org/10.1016/0278-4343(87)90042-2.
- Cloern, J. E., and A. D. Jassby. 2010. Patterns and scales of phytoplankton variability in estuarine coastal ecosystems. Estuaries and Coasts 33:230–41. doi:https://doi.org/10.1007/s122237-009-9195-3.
- Falkowski, P. G., and J. A. Raven. 2007. Aquatic photosynthesis. Princeton and Oxford, Princeton University Press, 488 pp.
- Fortier, M., L. Fortier, C. Michel, and L. Legendre. 2002. Climatic and biological forcing of the vertical flux of biogenic particles under seasonal arctic sea ice. Marine Ecology Progress Series 225:1–16. doi:https://doi.org/10.3354/meps225001.
- Gameori, C., J. Zwolinski, and V. Brotas. 2011. Light control on phytoplankton production in a shallow and turbid estuarine system. Hydrobiologia 660:249–63. doi:https://doi.org/10.1007/s10750-011-0695-3.
- Grasshoff, K., M. Erhardt, and K. Kremlin, eds. 1999. Methods of seawater analysis. London, Wiley, 632 pp.
- Grenfell, T., and G. A. Maykut. 1977. The optical properties of ice and snow in the arctic basin. Journal of Glaciology 18:445–63. doi:https://doi.org/10.1017/S0022143000021122.
- Hanna, E., P. Huybrechts, K. Steffen, J. Cappelen, R. Huff, C. Shuman, I. F. Tristram, S. Wise, and M. Griffiths. 2008. Increased runoff from meltwater from the Greenland ice sheet: A response to global warming. Journal of Climate 15:331–41. doi:https://doi.org/10.1175/2007JCLI1964.1.
- Hasholt, B., A. B. Mikkelsen, M. H. Nielsen, and M. A. D. Larsen. 2012. Observations of runoff and sediment and dissolved loads from the Greenland ice sheet at Kangerlussuaq, West Greenland, 2007 to 2010. Zeitschrift Für Geomorphologie 57:1–25. doi:https://doi.org/10.1127/0372-8854/2012/S-00121.
- Hawes, I., L. C. Lund-Hansen, B. K. Sorrell, M. H. Nielsen, R. Borzák, and I. Buss. 2012. Photobiology of sea ice algae during initial spring growth in Kangerlussuaq, West Greenland: Insights from imaging variable chlorophyll fluorescence of ice cores. Photosynthesis Research 112:103–15. doi:https://doi.org/10.1007/s11120-012-9736-7.
- Heath, M., K. Richardson, and T. Kiørboe. 1990. Optical assessment of phytoplankton nutrient depletion. Journal of Plankton Research 12:381–96. doi:https://doi.org/10.1093/plankt/12.2.381.
- Hop, H., T. Pearson, E. N. Hegseth, K. M. Kovacs, C. Wiencke, K. Kwasniewski, K. Eiane, F. Mehlum, B. Gulliksen, M. Wlodarska-Kowalczuk, et al. 2002. The marine ecosystem of Kongsfjorden, Svalbard. Polar Research 21:167–208. doi:https://doi.org/10.1111/j.1751-8369.2002.tb00073.x.
- Jassby, A. D., and T. Platt. 1976. Mathematical formulation of the relationship between photosynthesis and light for phytoplankton. Limnology and Oceanography 21:540–47. doi:https://doi.org/10.4319/lo.1976.21.4.0540.
- Jensen, H. M., L. Pedersen, A. Burmeister, and B. W. Hansen. 1999. Pelagic primary production during summer along 65 to 72°N off West Greenland. Polar Biology 21:269–78. doi:https://doi.org/10.1007/s003000050362.
- Juul-Pedersen, T., K. Arendt, J. Mortensen, M. Blicher, D. Søgaard, and S. Rysgaard. 2015. Seasonal and interannual phytoplankton production in a sub-arctic tidewater outlet glacier fjord, West Greenland. Marine Ecology Progress Series 524:27–38. doi:https://doi.org/10.3354/meps11174.
- Kirk, J. T. O. 1994. Light and photosynthesis in the aquatic ecosystems. Cambridge, University Press, 509 pp.
- Kuzyk, Z. A., R. W. Macdonald, M. A. Granskog, R. K. Scharien, R. J. Galley, C. Michel, D. Barber, and G. Stern. 2008. Sea ice, hydrological, and biological processes in the Churchill River estuary region, Hudson Bay. Estuarine, Costal, and Shelf Science 77:369–84.
- Levinsen, H., and T. G. Nielsen. 2002. The trophic role of marine pelagic ciliates and heterotrophic dinoflagellates in arctic and temperate coastal ecosystems: A cross-latitude comparison. Limnology and Oceanography 47:427–39. doi:https://doi.org/10.4319/lo.2002.47.2.0427.
- Lund-Hansen, L. C., T. J. Andersen, M. H. Nielsen, and M. Pejrup. 2010. Suspended matter, chl-a, CDOM, grain sizes, and optical properties in the arctic fjord-type estuary, Kangerlussuaq, west Greenland during summer. Estuaries and Coasts 33:1442–51. doi:https://doi.org/10.1007/s12237-010-9300-7.
- Lund-Hansen, L. C., I. Hawes, M. H. Nielsen, and B. K. Sorrell. 2017. Is colonization of sea ice by diatoms facilitated by increased surface roughness in growing ice crystals? Polar Biology 40:593–602. doi:https://doi.org/10.1007/s00300-016-1981-3.
- Lund-Hansen, L. C., I. Hawes, B. K. Sorrell, and M. H. Nielsen. 2014. Removal of snow cover inhibits spring growth of arctic algae through physiological and behavioral effects. Polar Biology 37:471–81. doi:https://doi.org/10.1007/s00300-013-1444-z.
- Manes, S. S., and R. Gradinger. 2009. Small scale vertical gradients of arctic ice algal photo–physiological properties. Photosynthesis Research 102:53–66. doi:https://doi.org/10.1007/s11120-009-9489-0.
- Marra, J., and R. T. Barber. 2004. Phytoplankton and heterotrophic respiration in the surface layer of the ocean. Geophysical Research Letters 31:L09314. doi:https://doi.org/10.129/2004GL0-19664.
- McGrath, D., K. Steffen, I. Overeem, S. H. Mernild, B. Hasholt, and M. V. D. Broeke. 2010. Sediment plumes as a proxy for local ice-sheet runoff in Kangerlussuaq Fjord, West Greenland. Journal of Glaciology 56:813–21. doi:https://doi.org/10.3189/002214310794457227.
- Meire, L., P. Meire, E. Struyf, D. W. Krawczyk, K. E. Arendt, J. C. Yde, T. J. Pedersen, M. J. Hopwood, S. Rysgaard, and F. J. R. Meysman. 2016. High export of dissolved silica from the Greenland Ice Sheet. Geophysical Research Letters 43:9172–82. doi:https://doi.org/10.1002/2016GL070191.
- Mikkelsen, D., S. Rysgaard, and R. N. Glud. 2008. Microalgal composition and primary production in Arctic sea ice: A seasonal study from Kobbefjord (Kangerluarsunnguaq), West Greenland. Marine Ecology Progress Series 368:64–75. doi:https://doi.org/10.3354/meps07627.
- Mundy, C. J., D. G. Barber, and L. Michel. 2005. Variability of snow and ice thermal, physical and optical properties pertinent to sea ice algae biomass during spring. Journal of Marine Research 58:107–20.
- Nielsen, M. H., D. R. Erbs-Hansen, and K. L. Knudsen. 2010. Water masses in Kangerlussuaq, a large fjord in west Greenland: The processes of formation and the associated foraminiferal fauna. Polar Research 29:159–75. doi:https://doi.org/10.1111/j.1751-8369.2010.00147.x.
- Overeem, I., B. Hudson, E. Welty, A. Mikkelsen, J. Bamber, D. Petersen, A. Lewinter, and B. Hasholt. 2015. River inundation suggests ice-sheet runoff retention. Journal of Glaciology 228:776–78. doi:https://doi.org/10.3189/2015JoG15J012.
- Parkinson, C. L., D. J. Cavalieri, P. Gloersen, J. H. Zwally, and J. C. Comiso. 1999. Arctic sea ice extents, areas and trends, 1978–1996. Journal of Geophysical Research 104 (C9):20.837–56. doi:https://doi.org/10.1029/1999JC900082.
- Perovich, D. K., G. F. Cota, G. A. Maykut, and T. C. Grenfell. 1993. Bio-optical observations of first-year arctic sea ice. Geophysical Research Letters 20:1059–62. doi:https://doi.org/10.1029/93GL01316.
- Philips, D. M., and J. T. O. Kirk. 1984. Study of the spectral variation of absorption and scattering in some Australian waters. Australian Journal of Marine and Freshwater 35:635–44. doi:https://doi.org/10.1071/MF9840635.
- Piwosz, K., W. Walkuz, R. Hapter, P. Wieczorek, H. Hop, and J. Wiktor. 2009. Comparison of productivity and phytoplankton in a warm (Kongsfjorden) and a cold (Hornsund) Spitsbergen fjord in mid-summer 2002. Polar Biology 32:549–59. doi:https://doi.org/10.1007/s00300-008-0549-2.
- Retamal, L., S. Bonilla, and W. F. Vincent. 2008. Optical gradients and phytoplankton production in the Mazkenzie River and the coastal beaufort sea. Polar Biology 31:363–79. doi:https://doi.org/10.1007/s00300-007-0365-0.
- Rysgaard, S., T. G. Nielsen, and B. W. Hansen. 1999. Seasonal variation in nutrients, pelagic primary production and grazing in a high-arctic coastal marine ecosystem, young sound, Northeast Greenland. Marine Ecology Progress Series 179:13–25. doi:https://doi.org/10.3354/meps179013.
- Sampou, P., and W. M. Kemp. 1994. Factors regulating plankton community respiration in chesapeake bay. Marine Ecology Progress Series 110:249–58. doi:https://doi.org/10.3354/meps110249.
- Steemann-Nielsen, E. 1952. The use of radioactive carbon (C14) for measuring organic productivity in the sea. Journal Du Conseil/Conseil Permanent International Pour l’Exploration De La Mer 144:92–95.
- Strickland, J. D. H., and T. R. Parson. 1972. A practical handbook of seawater analysis. Fisheries Research Board of Canada, Ottawa, 239 pp.
- Svendsen, H., A. Beszczynska-Møller, J. O. Hagen, B. Lefauconnier, V. Tverberg, S. Gerland, J. B. Ørbæk, K. Bischof, C. Papucci, M. Zajaczkowaski, et al. 2002. The physical environment of Kongsfjorden-Krossfjorden, and arctic fjord system in Svalbard. Polar Research 21:133–66.
- Syvitski, J. P. M., D. C. Burnell, and J. M. Skei. 1987. Fjords: Processes and products, Berlin, Springer Verlag, 379 pp.
- Thompson, L. G. 2010. Climate change: The evidence and our options. The Behavior Analyst 33:153–70. doi:https://doi.org/10.1007/BF03392211.
- Van As, D., A. L. Hubbard, B. Hasholt, A. B. Mikkelsen, M. R. Broeke, and R. S. Fausto. 2012. Large surface meltwater discharge from the Kangerlussuaq sector of the Greenland ice sheet during the record-warm year 2010 explained by detailed energy balance observations. The Cryosphere 6:199–209. doi: https://doi.org/10.5194/tc-6-199-2012.
- Warren, S. G., I. G. Rigor, N. Untersteiner, V. F. Radianov, N. Bryazgin, Y. I. Aleksandrov, and R. Colony. 1999. Snow depth in the arctic sea ice. Journal of Climate 12:1814–29. doi:https://doi.org/10.1175/1520-0442(1999)012<1814:SDOASI>2.0.CO;2.
- Weston, K., L. Fernand, D. K. Mills, R. Delahunty, and J. Brown. 2005. Primary production in the deep chlorophyll maximum of the central North Sea. Journal of Plankton Research 27:909–22. doi:https://doi.org/10.1093/plankt/fbi064.
- Yde, J. C., N. T. Knudsen, B. Hasholt, and A. B. Mikkelsen. 2014. Meltwater chemistry and solute export from a Greenland ice sheet catchment, Watson River, Greenland. Journal of Hydrology 519:2165–79. doi:https://doi.org/10.1016/j.jhydrol.2014.10.018.