
ABSTRACT
Because permafrost is extremely sensitive to climate change, it is of great importance to understand the relationship between permafrost and vegetation biomass. This study aims to reveal the impacts of permafrost on above- and belowground vegetation biomass on the northern Qinghai-Tibetan Plateau. Soil temperature, moisture, active-layer thickness, vegetation coverage, aboveground biomass (AGB), belowground biomass (BGB), and soil organic carbon were investigated in the growing seasons during 2014–2016. The average AGB and BGB in the growing seasons were 0.036 and 0.83 g cm−2, respectively. The AGB was significantly positively correlated with BGB, soil moisture, and soil organic carbon content, but was significantly negatively correlated with mean annual ground temperature and active-layer thickness, suggesting that permafrost degradation can potentially decrease vegetation growth. The BGB was positively correlated with active-layer thickness and was negatively correlated with soil moisture. This study suggests that permafrost degradation can decrease the soil moisture on the northern Qinghai-Tibetan Plateau and thus decrease AGB. The decreased soil moisture can also lead to lower BGB, while the vegetation in drier soils tends to have higher BGB to access more water resources for plant growth.
Introduction
Permafrost affects the soil hydrological regime because of the relatively impermeable layer of the permafrost table (O’Donnell et al. Citation2012). Permafrost also plays an important role in soil-nutrients cycling, the important factors for vegetation growth (Tian et al. Citation2017). Because soil moisture and nutrients are major environmental factors controlling vegetation distribution (Shen et al. Citation2008; Wardle et al. Citation2004), permafrost degradation will inevitably affect vegetation growth because permafrost degradation usually means increasing ground temperature and deepening active-layer thickness, which further affect soil moisture conditions (Wu and Zhang Citation2010; Zhao et al. Citation2010). From the observation of ground temperature data or active-layer thickness, permafrost degradation has been widely observed in both continuous and discontinuous permafrost regions during the past decades (Streletskiy et al. Citation2015).
In the circum-Arctic regions, a deeper active layer was associated with denser plants (Walker et al. Citation2003). In the Greenland areas, the warming on permafrost can lead to the melting of ground ice, which can supply more water for plant growth, and thus permafrost degradation can increase primary production (Sistla et al. Citation2013). In comparison with the active layers in arctic regions, which are largely less than 1 m (Ping et al. Citation2015), the active layers in low-latitude permafrost regions are usually about 2 m or deeper (Qin et al. Citation2016; Wu et al. Citation2016b). Therefore, permafrost degradation can decrease soil moisture contents because the deepening of active layers removes the impermeable layer for groundwater penetration, and thus permafrost degradation probably results in the degradation of land-cover types (Wang et al. Citation2007; Wu et al. Citation2017). It can be expected that permafrost degradation may decrease the biomass in low-latitude permafrost regions. So far, there are no reports about the relationship between vegetation biomass and active layer, and this knowledge gap hinders our understanding of the effects of permafrost degradation on ecosystem functions.
The Qinghai-Tibetan Plateau (QTP) occupies the largest extent of permafrost in the low-middle latitude areas, with permafrost regions underlying approximately 67 percent of the QTP area (Zou et al. Citation2017). The QTP permafrost is extremely sensitive to climate change, and climate warming has significantly accelerated permafrost degradation (Wu et al. Citation2016a). In this study, we investigated biomass at eleven sites with different active-layer thickness in the permafrost regions on the northern QTP in August 2014–2016. Our main objectives were to (1) examine the distribution of the above- and belowground biomass in the permafrost regions and (2) reveal the relationships among the above- and belowground biomass and permafrost hydrothermal characteristics. The results can improve our understanding of the effects of permafrost degradation on vegetation and the responses of alpine ecosystems to global climate warming.
Study area and methods
Study area and sampling sites
The study area is located in the permafrost regions throughout the upper reaches of the Heihe River basin on the northern QTP (). The mean annual air temperature was about −1°C, and the mean annual precipitation was about 400 mm (Wang et al. Citation2017). In the study area, permafrost distribution was mainly affected by elevation, and the permafrost lower boundary was approximately 3,650 m (Mu et al. Citation2017b). There were mainly three typical land-cover types: alpine wet meadow, alpine meadow, and alpine steppe (Mu et al. Citation2017b).
Figure 1. Study area and location of sampling sites. (A) Map of China; (B) the upper reaches of Heihe River; (C) EB sites; (D) PM sites
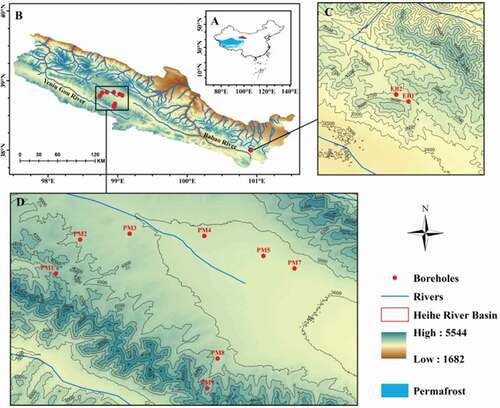
In 2011–2014, eleven boreholes (EB1, EB2, PM1, PM2, PM3, PM4, PM5, PM6, PM7, PM8, and PM9), with depths of 15–100 m, were drilled in the study area (, ). The ground temperatures that were measured from the boreholes in 2015 showed that the active layer varied from 1.1 m to 4.85 m, and there was also a site (PT6) without permafrost. Soil temperature and moisture were monitored in the active layers of EB1, PM1, PM3, PM4, and PM5 in 2012–2016 using the 109 Temperature Probes and CS616 Water Content Reflectometer (Campbell Scientific, Inc.).
Table 1. Characteristics of sampling sites throughout the upper reach of the Heihe River basin on the northern Qinghai-Tibetan Plateau
Field investigation and laboratory analysis
The fieldwork was conducted at eleven sites in August 2014–2016. The environmental factors for the sampling sites are summarized in . At each site, three 1 × 1 m2 quadrats were established uniformly to record the vegetation types, dominant species, coverage, heights, and abundances. For each quadrat, the vegetation at three subquadrats of 0.25 × 0.25 m2 were harvested after completion of the vegetation survey, and the biomass of the three subquadrats was averaged to produce an average value to calculate the biomass in the plot. Soil samples for the BGB measurement were collected using a soil auger (7.5 cm in diameter) from the upper 40 cm soils from the three quadrats from which the AGB measurements were conducted. Therefore, the biomasses were surveyed at thirty-three plots using ninety-nine subquadrats at the eleven drilling sties.
Because it is difficult to separate live roots from dead roots in the field investigation, we collected both live and dead roots by washing through a sieve. The biomass samples were oven dried to a constant mass at 70°C (Yue et al. Citation2017). Soil organic carbon (SOC) contents were quantified by dry combustion using a vario EL elemental analyzer (Elementra, Hanau, Germany; Mu et al. Citation2015) and the moisture contents for the upper 10 cm soils were measured using an oven-dried method at 105°C for 24 h.
Statistical analysis
Data for AGB and BGB are presented as mean values and standard deviations. To test the best predictors for AGB and BGB, we performed linear regressions for AGB and BGB using soil moisture, SOC content, mean annual ground temperature, and active-layer thickness. For these multiple linear regressions, we standardized predictors (mean = 0, SD = 1) to allow interpretation of coefficients as effect sizes. We compared all significant models based on Akaike information criterion (AIC; Bates et al. Citation2013; Kuznetsova, Brockhoff, and Christensen Citation2014) to find the best models for AGB and BGB. All the data analyses were performed in R.3.3.3 (http://www.r-project.org/). A multiple regression model was used to estimate the factors influencing ABG in the permafrost area.
Results
Soil hydrothermal characteristics in the active layer
The soil hydrothermal characteristics varied among sites during freezing and thawing periods in 2012–2016 (supplementary materials, Figures S1, S2). The annual mean ground temperatures at the top layers of 0–40 cm for wet meadows—that is, EB1 (−1.04 ~ −0.27°C), PM1 (−1.53 ~ −1.31°C), and PM3 sites (−1.28 ~ −1.20°C)—were lower than those in the PM4 (−0.07 ~ 0.37°C) and PM5 sites (0.18 ~ 0.39°C), which were meadows (supplementary materials, Figure S1). This pattern was consistent with the active-layer thickness for these sites (). The EB1 site exhibited high soil moisture with mean values of 38.8 percent and 31.8 percent at depths of 20 cm and 40 cm, respectively. The mean soil moistures at the depth of 40 cm at PM1, PM3, and PM5 were 25.1 percent, 19.2 percent, and 15.6 percent, respectively. The mean soil moistures at 20 cm depth at PM4 and PM5 were 14.8 percent and 19.0 percent, respectively (supplementary materials, Figure S2).
Distribution of above- and belowground biomass
The mean vegetation coverage in the permafrost area ranged from 72.9 percent to 93.3 percent. During the sampling period (August 10–15), vegetation coverage slightly decreased from 2014 to 2016 (). The AGB and BGB varied among the sites (). The mean values of AGB under alpine meadow, steppe, and wet meadow was 0.036, 0.027, and 0.041 g cm−2, respectively. The BGB among the sites were similar, with the mean values of 0.84, 0.86, and 0.81 g cm−2 under alpine meadow, steppe, and wet meadow, respectively. For all the sites, the mean AGB and BGB in the growing seasons were 0.036 and 0.83 g cm−2, respectively.
Figure 2. Distributions of aboveground biomass (AGB) and belowground biomass (BGB) in the permafrost area
Relationships among above- and belowground biomass, soil moisture, organic carbon, ground temperature, and active layer
Although BGB showed similar values, the BGB was significantly positively correlated with AGB, indicating that higher AGB largely was associated with higher BGB. The AGB was also significantly positively correlated with SOC content (). There was a significant positive relationship between soil moisture at 10 cm depth and AGB, and a significant negative relationship between soil moisture and BGB ().
Figure 3. Relationships between aboveground biomass (AGB) and belowground biomass (BGB) and soil organic carbon (SOC) content
Figure 4. Relationships between soil moisture and above- and belowground biomass
Permafrost conditions, including active-layer thickness and ground temperature, showed significant correlations with AGB and BGB. The mean annual ground temperature was significantly negatively correlated with AGB, but not significantly correlated with BGB (). The active-layer thickness was significantly negatively correlated with AGB, and was positively correlated with BGB (). The multiple regressions for the AGB and BGB are shown in . The moisture was the determining factor for AGB. However, for the BGB the moisture was the negative contributor for the BGB, and the final model was not statistically significant.
Table 2. Multiple linear regressions for AGB and BGB using soil moisture, active layer, mean annual ground temperature, and soil organic carbon
Figure 5. Relationships between mean annual ground temperature (MAGT) and above- and belowground biomass
Figure 6. Relationships between active-layer thickness and above- and belowground biomass
Discussion
Soil moisture and temperature are dynamic properties, and they can also be affected by the freeze-thaw process (Zhao et al. Citation2000, Citation2010). The soil temperatures in our study areas were mainly associated with permafrost conditions, and the temperatures at the EB1, PM1, and PM3 sites were lower than those at the PM4 and PM5 sites, which was consistent with the active-layer thickness at these sites. The soil moisture contents in August were similar with the patterns from the oven-dried method. Therefore, the soil moisture in our study can be used to represent the differences of the soil moisture content among the sampling sites. Overall, the wet meadow has higher soil moisture content than that of meadow. The wet meadow on the QTP usually has poor drainage conditions (Wu et al. Citation2018). In addition, the wet meadow usually means ice-rich permafrost on the QTP (Mu et al. Citation2015), and the shallower permafrost table favors the higher soil moisture content.
The ratio of the AGB to the BGB (1:23) falls within the reported ranges (1:14 to 1:23) in the northern QTP (Luo et al. Citation2005), and the ratios of AGB and BGB can be affected by animal grazing in our study areas. The vegetation coverage of 72.9–93.9 percent in this study area was higher than that in the central and western QTP permafrost regions (Yue et al. Citation2017). The average AGB in the growing seasons (0.036 g cm−2) was higher than that (0.014 g cm−2) along the Qinghai-Tibetan Railway (Yue et al. Citation2017). Similarly, the average BGB (0.83 g cm−2 within 40 cm) was much higher than that (0.066 g cm−2) in the alpine grasslands (Luo et al. Citation2002) and that (0.20 g cm−2) for the light grazing sites in the middle QTP (Cao et al. Citation2004). The higher vegetation coverage, AGB, and BGB in our study area could be explained by the relative higher mean annual precipitation in the northern QTP (Yi, Li, and Yin Citation2013). Our results showed that wet meadow had the largest AGB, followed by the meadow and steppe, which is in agreement with the AGB distribution pattern for the grassland ecosystems on the QTP (Zhang et al. Citation2014). The AGB was significantly correlated with SOC, because SOC mainly originated from the litter or debris input (Wu et al. Citation2012).
Permafrost with high mean annual ground temperature has a deeper active layer or permafrost table. The AGB was significantly negatively correlated with mean annual ground temperature and active-layer thickness, suggesting that permafrost degradation can inhibit the vegetation growth. In addition to temperature, soil moisture is also a limiting factor for vegetation growth in many areas on the QTP (Mu et al. Citation2017a), and there was a significant positive relationship between soil moisture and AGB. The deepening of the active layer and the increase of mean annual ground temperature will result in the decrease of soil moisture because of both the removal or deepening of the impermeable layer for groundwater penetration and increased evaporation (Guglielmin et al. Citation2014; Harden et al. Citation2012). In the permafrost regions on the QTP, it is a general pattern that soil moisture contents were negatively correlated with active-layer thickness (Mu et al. Citation2016; Wu et al. Citation2017). In this study, the coefficient of soil moisture was largest in the model for AGB, and it was the only factor retained in the final model. Therefore, soil moisture was the most important factor in the determination of AGB. Although vegetation types can affect the permafrost via mulching effects and the production of soil organic matter, which can decrease heat conduction (Wu et al. Citation2017), permafrost degradation would still result in the degradation of alpine ecosystems because it leads to lower soil moisture contents.
The significant negative relationship between BGB and soil moisture was consistent with the positive correlation between BGB and active-layer thickness. This result further indicates that soil moisture is a limiting factor for plant growth in our study area. The vegetation in the areas with a deeper active layer suffer from drier conditions, and higher BGB would make it possible to get more access to water from deeper soils (Maarel and Titlyanova Citation1989). Alternatively, low soil temperature limits plant growth, and thus leads to low BGB. Therefore, although the coefficient of moisture for the regression of BGB is negative, the statistical significance for the model is not significant. This result suggests that the deepening of the active layer can decrease soil moisture content, and further decrease AGB through limiting plant growth, but also increase BGB under drier conditions, because increasing BGB is beneficial for accessing the water sources required for plants to survive.
Conclusions
Our study examined the relationships between above- and belowground biomass and permafrost hydrothermal characteristics in the northern QTP. Aboveground biomass was closely related with active-layer thickness and mean annual ground temperature, suggesting that permafrost plays an important role in vegetation growth via the effects of permafrost on soil moisture. Belowground boiomass was related to soil moisture, active-layer thickness, and AGB. Soil moisture is the most important factor in the determination of AGB. Although, BGB was significantly correlated with AGB; thus, permafrost degradation would decrease BGB as well, while vegetation that grows in drier soils tends to have higher BGB.
Supplementary Materials
Download Zip (573.5 KB)Additional information
Funding
Related Research Data
References
- Bates, D., M. Maechler, B. Bolker, and S. Walker. 2013. lme4: Linear mixed-effects models using Eigen and S4. R Package Version ( version 1.0-5).
- Cao, G., Y. Tang, W. Mo, Y. Wang, Y. Li, and X. Zhao. 2004. Grazing intensity alters soil respiration in an alpine meadow on the Tibetan plateau. Soil Biology and Biochemistry 36 (2):237–43.
- Guglielmin, M., M. Dalle Fratte, and N. Cannone. 2014. Permafrost warming and vegetation changes in continental Antarctica. Environmental Research Letters 9 (4):045001.
- Harden, J. W., C. D. Koven, C. L. Ping, G. Hugelius, A. David McGuire, P. Camill, T. Jorgenson, P. Kuhry, G. J. Michaelson, and J. A. O’Donnell. 2012. Field information links permafrost carbon to physical vulnerabilities of thawing. Geophysical Research Letters 39 (15):L15704.
- Kuznetsova, A., P. B. Brockhoff, and R. H. B. Christensen. 2014. lmerTest: Tests for random and fixed effects for linear mixed effect models (lmer objects of lme4 package). R Package Version ( version 2.0-6).
- Luo, T., W. Li, and H. Zhu. 2002. Estimated biomass and productivity of natural vegetation on the Tibetan Plateau. Ecological Applications 12:946–980.
- Luo, T., S. Brown, Y. Pan, P. Shi, O. Hua, Z. Yu, and H. Zhu. 2005. Root biomass along subtropical to alpine gradients: Global implication from Tibetan transect studies. Forest Ecology and Management 206 (1–3):349–63.
- Maarel, E. V. D., and A. Titlyanova. 1989. Above-ground and below-ground biomass relations in steppes under different grazing conditions. Oikos 56 (3):364–70.
- Mu, C., T. Zhang, Q. Wu, B. Cao, X. Zhang, X. Peng, X. Wan, L. Zheng, Q. Wang, and G. Cheng. 2015. Carbon and nitrogen properties of permafrost over the Eboling Mountain in the upper reach of Heihe River basin, northwestern China. Arctic, Antarctic, and Alpine Research 47 (2):203–11.
- Mu, C., T. Zhang, X. Zhang, B. Cao, X. Peng, L. Cao, and H. Su. 2016. Pedogenesis and physicochemical parameters influencing soil carbon and nitrogen of alpine meadows in permafrost regions in the northeastern Qinghai-Tibetan Plateau. Catena 141:85–91.
- Mu, C., T. Zhang, Q. Zhao, H. Su, S. Wang, B. Cao, X. Peng, Q. Wu, and X. Wu. 2017a. Permafrost affects carbon exchange and its response to experimental warming on the northern Qinghai-Tibetan Plateau. Agricultural and Forest Meteorology 247:252–59.
- Mu, C. C., B. W. Abbott, Q. Zhao, H. Su, S. F. Wang, Q. B. Wu, T. J. Zhang, and X. D. Wu. 2017b. Permafrost collapse shifts alpine tundra to a carbon source but reduces N2O and CH4 release on the northern Qinghai-Tibetan Plateau. Geophysical Research Letters 44 (17):8945–52.
- O’Donnell, J., M. T. Jorgenson, J. Harden, A. D. McGuire, M. Kanevskiy, and K. Wickland. 2012. The effects of permafrost thaw on soil hydrologic, thermal, and carbon dynamics in an Alaskan peatland. Ecosystems 15 (2):213–29.
- Ping, C., J. Jastrow, M. Jorgenson, G. Michaelson, and Y. Shur. 2015. Permafrost soils and carbon cycling. Soil 1 (1):147–71.
- Qin, Y., T. Wu, L. Ren, W. Yu, T. Wang, X. Zhu, W. Wang, G. Hu, and L. Tian. 2016. Using ERA-Interim reanalysis dataset to assess the changes of ground surface freezing and thawing condition on the Qinghai–Tibet Plateau. Environmental Earth Sciences 75 (9):1–13.
- Shen, M., Y. Tang, J. Klein, P. Zhang, S. Gu, A. Shimono, and J. Chen. 2008. Estimation of aboveground biomass using in situ hyperspectral measurements in five major grassland ecosystems on the Tibetan Plateau. Journal of Plant Ecology 1 (4):247–57.
- Sistla, S. A., J. C. Moore, R. T. Simpson, L. Gough, G. R. Shaver, and J. P. Schimel. 2013. Long-term warming restructures Arctic tundra without changing net soil carbon storage. Nature 497 (7451):615–18.
- Streletskiy, D. A., N. I. Tananaev, T. Opel, N. I. Shiklomanov, K. E. Nyland, I. D. Streletskaya, I. Tokarev, and A. I. Shiklomanov. 2015. Permafrost hydrology in changing climatic conditions: Seasonal variability of stable isotope composition in rivers in discontinuous permafrost. Environmental Research Letters 10 (9):095003.
- Tian, L., L. Zhao, X. Wu, H. Fang, Y. Zhao, G. Yue, G. Liu, and H. Chen. 2017. Vertical patterns and controls of soil nutrients in alpine grassland: Implications for nutrient uptake. The Science of the Total Environment 607-608:855–64.
- Walker, D. A., G. Jia, H. E. Epstein, M. K. Raynolds, F. S. Chapin, C. Copass, L. D. Hinzman, J. A. Knudson, H. A. Maier, and G. J. Michaelson. 2003. Vegetation-soil-thaw-depth relationships along a Low-Arctic bioclimate gradient, Alaska: Synthesis of information from the ATLAS studies. Permafrost and Periglacial Processes 14 (2):103–23.
- Wang, G., Y. Wang, Y. Li, and H. Cheng. 2007. Influences of alpine ecosystem responses to climatic change on soil properties on the Qinghai–Tibet Plateau, China. Catena 70 (3):506–14.
- Wang, Q., H. Jin, T. Zhang, B. Cao, X. Peng, K. Wang, X. Xiao, H. Guo, C. Mu, and L. Li. 2017. Hydro-thermal processes and thermal offsets of peat soils in the active layer in an alpine permafrost region, NE Qinghai-Tibet plateau. Global and Planetary Change 156:1–12.
- Wardle, D. A., R. D. Bardgett, J. N. Klironomos, H. Setälä, W. H. V. D. Putten, and D. H. Wall. 2004. Ecological linkages between aboveground and belowground biota. Science 304 (5677):1629–33.
- Wu, Q., and T. Zhang. 2010. Changes in active layer thickness over the Qinghai‐Tibetan Plateau from 1995 to 2007. Journal of Geophysical Research: Atmospheres (1984–2012) 115 (D9):D09107.
- Wu, Q., Z. Zhang, S. Gao, and W. Ma. 2016a. Thermal impacts of engineering activities and vegetation layer on permafrost in different alpine ecosystems of the Qinghai-Tibet Plateau, China. The Cryosphere 10 (4):1695–706.
- Wu, X., H. Fang, Y. Zhao, J. M. Smoak, W. Li, W. Shi, Y. Sheng, L. Zhao, and Y. Ding. 2017. A conceptual model of the controlling factors of soil organic carbon and nitrogen densities in a permafrost-affected region on the eastern Qinghai-Tibetan Plateau. Journal of Geophysical Research: Biogeosciences 122 (7):1705–17.
- Wu, X., L. Zhao, M. Chen, H. Fang, G. Yue, J. Chen, Q. Pang, Z. Wang, and Y. Ding. 2012. Soil organic carbon and its relationship to vegetation communities and soil properties in permafrost areas of the Central Western Qinghai-Tibet Plateau, China. Permafrost and Periglacial Processes 23 (2):162–69.
- Wu, X., L. Zhao, H. Fang, Y. Zhao, J. M. Smoak, Q. Pang, and Y. Ding. 2016b. Environmental controls on soil organic carbon and nitrogen stocks in the high-altitude arid western Qinghai-Tibetan Plateau permafrost region. Journal of Geophysical Research: Biogeosciences 121 (1):176–87.
- Wu, X. D., L. Zhao, G. Hu, G. M. Liu, W. P. Li, and Y. J. Ding. 2018. Permafrost and land cover as controlling factors for light fraction organic matter on the southern Qinghai-Tibetan Plateau. Science of the Total Environment 613-614:1165–74.
- Yi, X., G. Li, and Y. Yin. 2013. Spatio-temporal variation of precipitation in the Three-River Headwater Region from 1961 to 2010. Journal of Geographical Sciences 23 (3):447–64.
- Yue, G., L. Zhao, Z. Wang, L. Zhang, D. Zou, L. Niu, Y. Zhao, and Y. Qiao. 2017. Spatial variation in biomass and its relationships to soil properties in the permafrost regions along the Qinghai-Tibet Railway. Environmental Engineering Science 34 (2):130–37.
- Zhang, D., D. Niu, H. Chen, Y. Zhang, and F. U. Hua. 2014. Estimation of aboveground biomass in an alpine meadow on the Eastern Qinghai-Tibetan Plateau. Mountain Research 32 (4):453–59.
- Zhao, L., G. Cheng, S. Li, X. Zhao, and S. Wang. 2000. Thawing and freezing processes of active layer in Wudaoliang region of Tibetan Plateau. Chinese Science Bulletin 45 (23):2181–87.
- Zhao, L., Q. Wu, S. Marchenko, and N. Sharkhuu. 2010. Thermal state of permafrost and active layer in Central Asia during the International Polar Year. Permafrost and Periglacial Processes 21 (2):198–207.
- Zou, D., L. Zhao, Y. Sheng, J. Chen, G. Hu, T. Wu, J. Wu, C. Xie, X. Wu, Q. Pang, et al. 2017. A new map of permafrost distribution on the Tibetan Plateau. The Cryosphere 11 (6):2527–42.