
 ?Mathematical formulae have been encoded as MathML and are displayed in this HTML version using MathJax in order to improve their display. Uncheck the box to turn MathJax off. This feature requires Javascript. Click on a formula to zoom.
ABSTRACT
Changes in flowering phenology resulting from climate change could impact individual plant fitness and population viability. Flowering phenology can mediate plant reproductive success in several ways, including pollinator interactions, flowering synchrony with conspecifics, and timing of suitable abiotic conditions. We explored factors that control phenology and reproductive success for an alpine cushion plant, Silene acaulis, across two years and four sites, totaling 1,123 plants, in Colorado, USA. We investigated relationships between flowering time, flowering synchrony, and reproductive success with local abiotic conditions and pollinator behavior. Mean flowering phenology was strongly correlated with the timing of snowmelt across sites and years. Relative to mean flowering times, earlier flowering plants generally produced more flowers and experienced greater soil moisture during flowering but reduced synchrony with conspecifics. Fruit set tended to increase with greater soil moisture, synchrony during flowering, and earlier flowering times. Pollinator visitation increased with local Silene flower density. Earlier snowmelt and drier conditions later in the season favor earlier flowering, but these effects are partially counteracted by the positive effects of synchrony, perhaps because of changes in pollinator visitation. Overall, while both biotic and abiotic effects influence reproductive success, late-season drought may outweigh the benefits of flowering synchrony to increasingly favor earlier flowering.
Introduction
The timing of flowering has advanced in many plant populations as a consequence of warmer temperatures (Menzel et al. Citation2006; CaraDonna, Iler, and Inouye Citation2014), with potential effects on reproductive success and hence population persistence in the face of climate change. Flowering phenology can influence plant reproductive success through direct abiotic effects as well as via effects on biotic interactions. Seasonal fluctuations can strongly limit the window available for plants to flower and reproduce in many habitats (Inouye and McGuire Citation1991). For example, the timing of snowmelt (Inouye, Saavedra, and Lee-Yang Citation2003; Kudo and Ida Citation2013), precipitation (Carrol, Pallardy, and Galen Citation2001; Peñuelas et al. Citation2004), or frost events (Inouye Citation2008; CaraDonna and Bain Citation2016) can impose strong limits on the timing of successful reproduction in plants, which can shift with changing climate (Parmesan Citation2007; Forrest Citation2015).
Changes in the climatic windows appropriate for flowering can also scale up to alter interactions with pollinators, either directly through phenological mismatches between plants and pollinators (Memmott et al. Citation2007; Forrest and Thomson Citation2011; Kudo and Ida Citation2013) or indirectly through changes in competition (Pleasants Citation1980) or facilitation (Ghazoul Citation2006) for pollination services among co-flowering species. Such plant-pollinator asynchrony can negatively impact plant populations by decreasing seed set (Ashman et al. Citation2004). However, these fitness consequences are not consistent for all plants (Forrest Citation2015). In fact, in many species the onset of both flowering and pollinator activity have shown similar phenological shifts with increasing temperatures (Hegland et al. Citation2009; Bartomeus et al. Citation2011; Rafferty and Ives Citation2011). Plants in environments with narrow climatic windows for reproduction, including in alpine environments, may be particularly susceptible to changing abiotic and biotic constraints on flowering time.
One way to gain insight into the possible consequences of phenological shifts for plant populations is to study variation across time and individuals in phenology and subsequent reproductive success. In particular, phenological shifts could influence reproductive success through changes in either the absolute timing of flowering and/or the degree of synchrony in flowering. The timing of flowering often has strong effects on individual reproductive success (Kudo Citation2006; Elzinga et al. Citation2007). Large, synchronous floral displays can act to attract pollinators and increase pollen dispersal and outcrossing (Kudo Citation1993; Ollerton and Diaz Citation1999) or may, conversely, swamp available pollinators and reduce per-flower visitation rates, resulting in pollen limitation (Robertson and Macnair Citation1995; Thomson Citation2010). The degree of conspecific synchrony in flowering time can also shift with changing climate conditions (Rodriguez-Perez and Traveset Citation2016). Yet evidence for the importance of flowering synchrony among individuals in determining reproductive success has been mixed, with some studies finding strong positive effects of flowering synchrony and others finding weak or even negative effects (Augspurger Citation1981, Citation1983; Kudo Citation1993; Ollerton and Lack Citation1998; Forsyth Citation2003; Kempe Citation2014). One potential explanation for this variation in outcomes could be variation in the spatial scale at which flowering synchrony influences reproductive success. For example, pollinator behavior may be influenced by variation in flowering density at smaller spatial scales, from individual floral displays (Rathcke and Lacey Citation1985; Tarayre et al. Citation2007) to localized groups of flowering individuals (Kempe Citation2014). Alternatively, flowering synchrony may simply have weaker effects on reproductive success relative to the absolute timing of flowering (Munguía-Rasa et al. Citation2011).
Here, we explore the causes and consequences of flowering time variation in Silene acaulis (Caryophyllaceae), an early flowering arctic and alpine cushion plant (Molau Citation1993). Reproductive success for S. acaulis (henceforth Silene) is likely contingent on several abiotic and biotic factors. In many alpine plants, the timing of the snow-free period largely determines both the abiotic window for successful reproduction (Billings and Mooney Citation1968) as well as the timing of pollinator activity (Kudo Citation1993; Thomson Citation2010), while frost events, particularly in the early and later portions of the growing season, can damage flowers and developing fruits (CaraDonna and Bain Citation2016). For these reasons, climate variation, either among microhabitats or years, can have profound impacts on reproductive success in alpine plants. Silene has been shown to flower earlier in warming experiments, suggesting that this species may be particularly responsive to changing climate conditions (Alatalo and Totland Citation1997). Additionally, Silene is gynodioecious (), and females and hermaphrodites may differ in their sensitivity to climate drivers and pollen limitation for fruit production; females produce more and higher quality seeds on average and are reliant on outcross pollen receipt, whereas hermaphrodites are self-compatible but also produce larger, showier flowers (Shykoff Citation1992; Hermenutz and Innes Citation1994; Shykoff et al. Citation2003; Canelles et al. Citation2017). Because females contribute most of the seeds (Morris and Doak Citation1998) and require pollinator visits to reproduce, this system may be particularly sensitive to phenological mismatches between flowering and pollinator activity mediated by climate effects. This makes Silene an excellent system to examine the multiple ways in which flowering phenology can influence reproductive success.
Table 1. Climate and flowering phenology across four sampling sites at Niwot Ridge, Colorado, from 2016 to 2017. All days are given as day of the year and standard deviations are indicated in parentheses
In this study, we quantified individual flowering phenology, reproductive success, and pollinator visitation rates for Silene at four sites on Niwot Ridge, Colorado, to dissect the consequences of flowering time variation for fruit set. First, we tested the correlates of flowering phenology across individuals, sites, and years to understand the drivers of variation in flowering time. We then examined how flowering phenology altered the local soil moisture experienced during flowering and the degree of synchrony in flowering among individuals. Finally, we tested the relative effects of flowering time, synchrony of flowering, and soil moisture in determining flower production and fruit set, and whether these patterns are likely to be related to pollinator visitation patterns. We pay particular attention to the spatial scale of synchrony because synchrony will often vary with distance, with changing effects on pollinator behavior and potentially reproductive success. We predicted that the timing of snowmelt would largely determine variation in flowering phenology across sites and years, and that there would be a unimodal effect of flowering phenology on flower production and fruit set, with the strongest effects of timing seen in the earliest and latest portions of the flowering season when abiotic conditions (e.g., temperature, soil moisture) are limiting. We further hypothesized that flowering synchrony would increase fruit set, particularly for females, by increasing pollinator visitation.
Materials and methods
Study species and study site
Silene is a common arctic and alpine cushion plant with a circumboreal distribution (Jones and Richards Citation1962). Individuals can be extremely long-lived (Morris and Doak Citation1998) and grow as dense cushions of tightly branching stems (“rosettes”) with a single taproot. The size of an individual cushion is strongly correlated with its survival and fruit production (Morris and Doak Citation1998). Silene is gynodioecious and each plant can produce many small pink flowers; hermaphrodites produce perfect flowers while females produce male-sterile flowers (Hermenutz and Innes Citation1994). Female Silene tend to have higher fruit production (Delph and Carroll Citation2001) and higher quality seeds that produce more successful offspring (Delph Citation2004) than hermaphrodites. Although the anther-smut fungus Microbotryum violaceum infects Silene individuals at some sites, causing sterility and the production of spore-filled anthers in both sexes (Hermenutz and Innes Citation1994, Marr Citation1997), we did not observe smut infection in any individuals in our study. Silene is both bee and fly pollinated (Shykoff Citation1992; Kempe Citation2014).
We collected data during both 2016 and 2017 at four sites (SN1–SN4; Figure S1) on Niwot Ridge, Colorado, USA, that are part of a long-term demography study (Doak and Morris Citation2010). These sites vary in elevation (ranging from 3,540 to 3,613 m a.s.l.) and microhabitat, ranging from sparsely vegetated fellfields (SN1 and SN2) to dry meadows (SN3 and SN4, ). Throughout the Colorado Rocky Mountains, warming temperatures (+ 0.9°C per decade) have been associated with accelerated snowmelt (−4.8 d per decade; Clow Citation2010) and increased rainfall at Niwot Ridge in particular (+ 60 mm per decade; Kittel et al. Citation2015). At each site, we used four shallowly buried (< 1 cm) iButton micro-thermistor dataloggers to determine snowmelt dates. We inferred that an iButton was snow covered for each day in which the maximum daily temperature did not exceed 1°C and the range of daily temperatures (recorded every 255 min) did not exceed 0.5°C. We used the last spring date with snow cover, averaged across iButtons at a site, as our estimate of snowmelt date. We tracked soil volumetric water content (VWC) every 4 hrs using one HOBO datalogger recording from two Decadon EC-5 probes deployed at each site. We estimated soil-moisture availability for each plant during the flowering season by taking the mean VWC at that site during the two weeks following the start of flowering (individual plants flowered for 10.92 d on average [± 5.73 SD]).
Flowering phenology and reproductive success
In both 2016 and 2017, we quantified flowering phenology, fruit production, and size of individually tagged plants along two permanent transects (15– 35 m long) per site that are part of a long-term demographic study (, Figures S1 and S2; Doak and Morris Citation2010). We counted the number of open flowers on each plant in regular censuses every 2–5 d throughout the flowering season (June 15–July 14 in 2016, June 15–July 17 in 2017); individual flowers remain open for 6–7 d on average (Shykoff Citation1988). A flower was considered open if the petals were estimated to be at more than forty-five degrees from vertical and past flowering if its anthers and/or pistils were wilted. Many flowers were open for more than one sampling date, so on the last day of sampling, after the majority of flowers in all sites had wilted, the total number of flowers produced per plant during the season was estimated by counting all wilted or open flowers, buds, and fruits on each plant as a measure of reproductive effort. In addition, we recorded the number of flowers that had successfully matured into fruits at the end of the growing season on July 29, 2016, and on July 31, 2017; Silene fruits with maturing seeds are capsules that are easily distinguished from aborted fruits that will not produce seeds. We also measured plant size at the same time as the two-dimensional area of the cushion (following Doak and Morris Citation2010). We determined the location for each individual by combining GPS data on transect ends with ground mapping of plants within transects using ArcMap 10.4.1 (ESRI Citation2016). We used the “Generate Near Table” tool in ArcMap to determine the group of neighboring plants within 1, 3, and 5 m radii of each plant to use in estimation of spatially restricted synchrony measures (see further on). Although these neighborhoods exclude some unmapped plants between transects (which are 0.5 m wide), flowering time was spatially autocorrelated at small scales (see “Results”) and the relationship between the number of neighbors and the resulting synchrony estimate was very weak (Pearson correlation coefficient = −0.044, N = 3,984, p < 0.01), suggesting that incomplete neighbor sampling did not bias our estimates of flowering synchrony. We measured 73–198 plants per site and year, resulting in 36–114 plants that produced at least one flower and were thus used in analyses ().
Estimating synchrony
We calculated a flowering synchrony value for each plant with its conspecific neighbors for a series of neighborhoods. We defined neighborhoods as either all conspecific plants or only hermaphrodites (i.e., pollen donors) within 1, 3, or 5 m radii or within the same site (eight total neighborhoods). For each neighborhood, we quantified the amount of overlap in the flowering curve of an individual plant p with those of the individuals of a defined neighborhood (hereafter “synchrony”; Schoener Citation1970; Mahoro Citation2002; Kempe Citation2014) as:
where Fpd and Fnd are the total number of open flowers on day d for an individual plant p or all neighboring plants, and Fps and Fns are the total number of flowers produced across all D census days for an individual plant p or all neighboring plants, respectively. This index ranges from 0, when there is no overlap in flowering, to 1, when there is perfect overlap in flowering between a plant p and all plants in a defined neighborhood.
Pollinator observations
In 2017 we observed free-foraging pollinators to determine whether visitation rates to Silene differed throughout the flowering season. In particular, we tested whether visitation rates depended on local Silene floral display. Preliminary trials suggested that the visitation rate was too low for targeted observations of specific Silene plants, so we instead used larger plots to first locate free-foraging pollinators and then estimate the frequency with which they visited Silene. We placed one 10 × 10 m plot diagonally adjacent (to reduce trampling) to each of the four sites in which we measured flowering phenology, and also established a fifth 10 × 10 m plot at a site (SN5, Figure S1) with later snowmelt to increase the number and range of observations (Silene plants at this location continued to flower after the other four sites had ceased flowering). We observed each plot for 40 min twice a week for the duration of the flowering season. Observations were only recorded on sunny days between the hours of 8:00 am and 12:00 pm, with wind speeds from 2.0 to 10.9 mph. Observations were conducted in the mornings to minimize the potential excessive winds that are common in the afternoons. During an observation period, we recorded each flower that a pollinator landed on, regardless of plant species. We made every effort to follow each pollinator as it foraged from the time that it entered the plot until it left, although some visitors were likely missed. We also estimated the density of neighboring Silene flowers for each observation period by recording the number of open Silene flowers within a 0.32 m radius centered around all visited plants. We rotated the order in which plots were observed to avoid bias in the time of day observations were made, and the observer also rotated position every ten minutes to achieve a complete view of the plot during the observation period.
Statistical analyses
Flowering phenology
We compared three metrics of individual flowering phenology: the first day with an open flower, the peak day of flowering, and the duration of flowering. The first day of flowering was strongly correlated with peak day and duration of flowering within sites and years, and was more strongly correlated with flower and fruit production (Figure S3), so we used the first day of flowering as our estimate of flowering time in all analyses.
We tested whether flowering time of individual plants differed among sites, years, plant size (log cushion area), and sex with a series of alternative linear models. In particular, we fit models with all combinations of these predictors and possible two-way interactions between site and other terms using lme4 and the dredge function (Barton Citation2014, Bates et al. Citation2014), and identified the best-supported model with AICc (Burnham and Anderson Citation2004). Given strong site x year interactions (see “Results”), we next tested the extent to which variation in mean flowering time can be explained by the timing of snowmelt across sites and years. We first standardized individual flowering times by subtracting the effects due to plant size and sex based on coefficients from the best-supported model, then estimated the correlation between the mean standardized flowering time for each site and year and the timing of snowmelt.
We next tested how variation in flowering phenology was related to both the soil moisture experienced by plants during flowering and their synchrony with flowering conspecifics at a range of neighborhood sizes. We estimated the correlation in each site and year between flowering time and the mean soil moisture during flowering for each plant. We then tested the effects of relative flowering phenology on synchrony. We first subtracted the mean flowering time within each site and year to remove differences in the mean timing of flowering due to differences in snowmelt. We fit separate linear models for each of the eight synchrony measures, including linear and quadratic terms for relative flowering phenology and their interactions with site and year as explanatory variables.
Drivers of variation in flower number and fruit set
We tested the relative effects of different aspects of phenology on the total number of flowers produced by a plant as well as the proportion of flowers to set fruit. Total flower number increased linearly with the square root of cushion area, suggesting that flower production increases proportionally to cushion circumference, so we used the log of flower number divided by the square root of plant area as our estimate of size-dependent flower production. We also modeled fruit set with quasipoisson models, with fruit number as the response variable and flower number as an offset. For each response variable, we fit a series of alternative models separately to each site and compared their support with AICc or QAICc (for linear and quasipoisson models, respectively) to identify the best-supported model (Burnham and Anderson Citation2004). We considered flowering time and its square, soil moisture during flowering, and plant sex as potential explanatory variables in all models. For models of fruit set, we also included each of the eight synchrony measurements and their interactions with plant sex, with the restriction that only a single synchrony measurement could be included in a given model. Although synchrony is related to date of first flower and its square (see “Results”), there was substantial variation in synchrony values even among plants with similar flowering times (Figure S5) because of differences among individuals in the number and distribution of open flowers over time. We fit models with all combinations of these predictors using lme4 and the dredge function (Barton Citation2014, Bates et al. Citation2014).
We also compared the contributions of flower production versus fruit set to changes in total predicted fruit production with flowering phenology. To do this, we predicted total fruit production (i.e., the log of fruit number plus one divided by the square root of cushion area) using the best-supported models for flower production and fruit set, but while holding either flower production or fruit set constant at its mean value while allowing the other to vary with flowering time. We then compared the fit of these two predictions relative to quadratic regressions of flowering-time fit directly to the fruit production data.
Pollinator behavior and phenology
We summarized pollinator visitation rates to Silene in two ways: the number of Silene plants that were visited per observation period by pollinators, and the proportion of visited plants that were Silene versus other co-flowering species. We tested for changes in visitation to Silene over time by fitting models with linear and quadratic terms for day of the year and their interactions with the plot. We next tested if changes in pollinator visitation to Silene over time were influenced by the local floral display of neighboring Silene by fitting models with Silene floral density, plot, and their interaction. We modeled counts of visited Silene plants with quasipoisson glms and the proportion of visits to Silene with binomial glms. We tested the significance of main effects with F-tests for quasipoisson models and chi-square tests for binomial models. We were unable to include pollinator taxon or plant sex as explanatory variables in these models because of limited sample sizes (see “Results”).
All analyses were conducted in R version 3.3.2 (R Core Team Citation2013).
Results
Flowering phenology
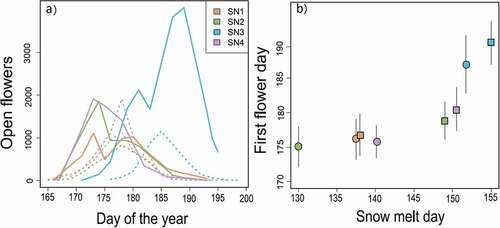
We saw strong site and year effects on flowering phenology. For each site and year there was a pronounced peak in total flowering by Silene; however, many flowers open well before or after this peak (). Flowering phenology, measured as the date of first flower, varied between sites and years (F3,552 = 9.10, p < 0.01; ΔAICc for models without site × year interactions > 18). Larger plants flowered earlier at all sites, although the magnitude of this effect varied among sites (F3,552 = 3.11, p = 0.03; ΔAICc for models without site × size interactions > 3). Female plants also flowered slightly earlier (0.51 d, F1,552 = 4.38, p = 0.04; ΔAICc for models without sex > 1). The mean flowering time, corrected for size and sex effects, was strongly correlated with the timing of snowmelt across sites and years (r = 0.852, df = 6, p = 0.007; , ). In addition to snowmelt determining flowering time, this relationship also suggests that, in cases of early snowmelt, some other factor, such as photoperiod, constrains mean flowering times to be near day 175 regardless of release from the snow (, ).
Figure 1. Flowering phenology in Silene at four sites at Niwot Ridge, Colorado. (A) The total number of open flowers across all plants in a site over time in 2016 (solid lines) and 2017 (dotted lines). (B) Mean flowering time across all plants (± standard deviation), correcting for plant size and sex effects (see “Methods”), is correlated with the last day with snow cover across sites and years (circle = 2016, square = 2017)
Variation in flowering phenology was associated with variation in the soil moisture experienced by plants during flowering (). Earlier flowering was associated with wetter conditions during flowering at all sites and years (r = −0.954 to −0.254) except SN3 in 2017 (r = 0.670), which flowered during a late-season precipitation event (Figure S4).
Figure 2. Flowering phenology influences (A) the soil moisture experienced by plants during flowering, and (B) synchrony in flowering with conspecifics. Note: synchrony with all neighboring plants in the entire site is shown here; for all neighborhoods see Figure S6. Points show the values for individual plants whereas lines show the fitted relationship between synchrony and flowering time—2016 = circles, solid lines; 2017 = squares, dotted lines
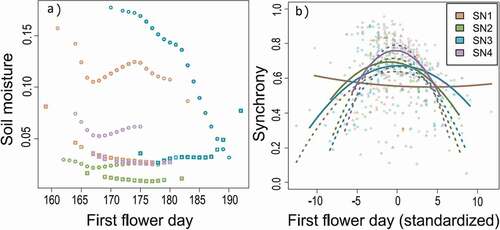
Relationships between flowering phenology and synchrony in flowering were unimodal across a range of neighborhoods (F1,448 > 10.66, p < 0.001 for all models; Table S1), with decreasing synchrony for the earliest and latest flowering plants (). In particular, we observed similar relationships for neighborhoods ranging from 1 m to the entire population, and including all plants or only hermaphrodite plants (Figure S5). Only in 2016 in SN1, and in SN2 only for 1 m neighborhoods, did earlier flowering plants have higher flowering synchrony (Figure S5), possibly because of their longer flowering duration.
Drivers of variation in flower number and fruit set
Flowering time had consistently strong effects on both flower production and fruit set (, Tables S2–S3). Earlier flowering increased flower number and fruit set in all sites, especially in the latest-flowering SN3 site, for which there was little support for quadratic effects of flowering time (). In the other three sites, flowering time had unimodal effects on fruit set, suggesting decreased fruit set in the earliest flowering plants (Table S3). However, there was little support for unimodal effects of flowering time on flower production (Table S2).
Figure 3. Drivers of variation in flower production and fruit set in Silene at four sites. Values are standardized coefficients ± standard error from the best-supported models at each site for (A) flower production relative to cushion area, and (B) fruits per flower. Variables are plant sex, flowering time and its square, synchrony in flowering (at various scales, see Table S3), soil moisture during flowering, and interactions between plant sex and synchrony. Note that some variables were not included in the best-supported model for a particular site and are thus not shown here (Tables S2–S3)
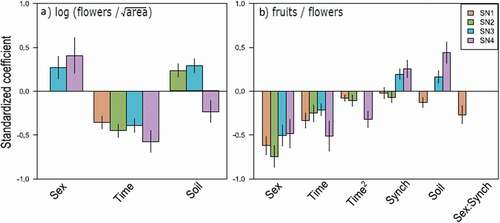
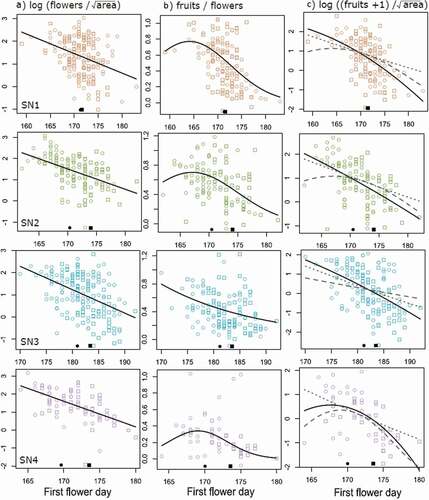
Figure 4. Effects of absolute flowering time on (A) flower production, (B) fruit set, and (C) total fruit production in Silene at four sites. Points are the values for each individual plant, corrected for sex, soil moisture, and synchrony effects (see “Methods”). Black lines show the predicted effects of flowering time from the best-supported model for each site at the mean synchrony and soil moisture values. In C, grey lines show the predicted fruit production, holding either flower production (dashed line) or fruit set (dotted line) constant at its mean value. Dark points on the x axis show the mean flowering time for each site and year (circle = 2016, square = 2017)
In addition to these effects of absolute timing of flowering, there was also support for the site-dependent effects of soil moisture during flowering and, for fruit set, synchrony with conspecifics. Plants that experienced greater soil moisture during flowering produced more flowers at SN2 and SN3, and higher fruit set at SN3 and SN4 (, Tables S2–S3). However, wetter conditions decreased flower number at SN4 and fruit set at SN1, while there was no effect of soil moisture on flower production at SN1 or fruit set at SN2 (, Tables S2–S3). Greater synchrony in flowering had consistently strong, positive effects on fruit set in SN3 and SN4, with strong support for synchrony with all plants at SN3 and for synchrony with hermaphrodites within 1 m at SN4 (, Table S3). At SN1 and SN2 there was support for a mix of weakly positive or negative effects of synchrony at differing spatial scales (Table S3).
Plant sex also had strong but opposing effects on flower production and fruit set. Hermaphrodites produced 27–41 percent more flowers relative to plant size than female plants, but only 59–63 percent as many fruits per flower as females (). There was only strong support for the effects of synchrony to differ between female and hermaphrodite plants at SN1 (Table S3), with more negative effects of synchrony on fruit set for hermaphrodites ().
Taken together, earlier flowering was generally associated with greater total fruit production (). Predicted changes in flower production and fruit set with flowering time together explained 73–99 percent of the variance explained by a model fit directly to the fruit-production data (), suggesting that these effects capture the variation in fruit production that can be explained by phenology. However, the relative contributions of changes in flower production versus fruit set to changes in total fruit production differed among sites (). Phenological effects on flower production alone explained more of the variance in fruit production than changes in fruit set alone at SN2 and SN3 (82% and 89% of the variance in fruit production, respectively), whereas the opposite was true at SN1 and SN4 (73% and 96%, respectively). Costs to the earliest flowering individuals only occurred through changes in fruit set (, dashed lines), but these effects were largely ameliorated by greater flower production (, dotted lines) so that earlier flowering tended to result in greater fruit production overall, when controlling for synchrony and soil-moisture effects (, solid lines). Only at SN4 was there evidence for a unimodal relationship between flowering phenology and fruit production, driven largely by the lower fruit set by the earliest flowering plants (, bottom panels).
Pollinator behavior and phenology
We observed a total of eighty-three foraging bouts to 200 flowering plants during twenty-six observation periods (2.41 plants per bout ± 1.22 SD, Table S4). Eighteen foraging bouts included at least one Silene plant, including visits to a total of 153 flowers on thirty-eight Silene plants. Eighteen percent of the pollinators observed were Bombus foragers, while the rest were various genera of flies. For Silene, most visits were from flies (78%) and to hermaphrodite plants (82%). Although we observed similar pollinator abundances at SN4, we did not observe any visits to Silene (Table S4).
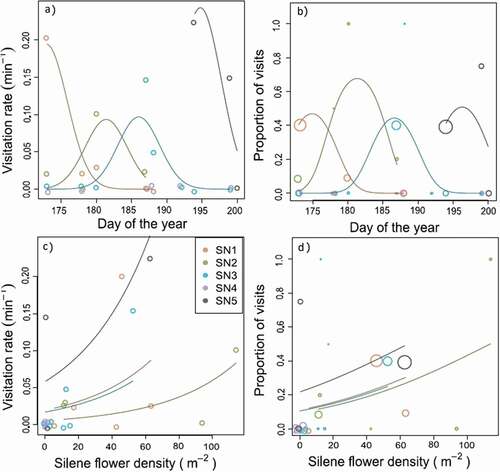
The number of Silene plants that were visited by pollinators per minute (hereafter, visitation rate) changed over time, with a peak that differed among plots (; day2: F1,15 = 12.87, p = 0.003; plot × day: F4,15 = 5.785, p = 0.005). In particular, visitation rates remained high in SN5 even after the other sites had ceased flowering (). Visitation rates increased with neighboring Silene floral density (F1,20 = 7.327, p = 0.014) and differed among plots (F4,20 = 3.657, p = 0.022; ). The proportion of visits to Silene showed similar patterns (day2: χ2 = 25.37, df = 1, p < 0.001; plot × day: χ2 = 34.20, df = 4, p < 0.001; flower density: χ2 = 9.11, df = 1, p = 0.003; ).
Figure 5. Pollinator visitation to Silene changes over time and with local Silene flowering density at five sites. Points show the number of visits to Silene plants per minute (left) or the proportion Silene plants out of all plants visited (right) as a function of the day of the year (top) or the local density of open Silene flowers. Lines show the fitted model for each site. Note that there were no observed pollinator visits to Silene at SN4, despite similar visitation rates to other plant species (see Table S4). Point size in panels B and D are proportional to the total number of visits (range: 2–23)
Discussion
We found evidence that abiotic conditions influence both the timing of flowering and the effects of flowering phenology on reproductive success. Unsurprisingly, release from snow cover in the spring strongly influences the timing of flowering. Yet even within sites and years, plants that flower earlier generally experience greater soil moisture during flowering and are able to produce more flowers per cushion area and more fruits per flower than individuals that flower later. However, fruit set is also increased by synchrony of flowering with conspecific neighbors, with the positive effects of earlier flowering being at least partially counteracted by decreased synchrony in flowering with conspecifics. Finally, we find that pollinator activity is strongly tied to flowering density in local areas, supporting the hypothesis that flowering synchrony effects are driven at least in part by plant–pollinator interactions.
Pollinator visitation to Silene plants increased with high neighboring Silene floral densities (), an effect that was local rather than driven by landscape-level flowering times. This could mean that local floral displays are sufficient to attract pollinators, a hypothesis consistent with the largely localized synchrony effects on reproductive success. Previous research on other systems show similar effects, with plant populations that were more densely flowering, and arguably flowering synchronously, experiencing increased visitation rates (Klinkhamer and De Jong Citation1990; Elzinga et al. Citation2007). In a similar study of Silene acaulis in Sweden, Kempe (Citation2014) also found positive effects of flowering synchrony for reproductive success, but did not find evidence that pollinator visitation rates changed over time or with Silene floral display. In our study, we saw little evidence that synchrony with hermaphrodite plants, the only source of pollen, was more important for fruit set than synchrony with all plants, suggesting that local floral display may, through attraction of pollinators or increasing visit quality, be more important than simple pollen availability. In support of this, we also observed higher pollinator visitation rates at times and in areas with higher Silene flowering density, suggesting that floral display is likely the mechanism relating synchrony to increased fruit set. Interestingly, the only site with strong support for synchrony with hermaphrodite neighbors, SN4, also had the lowest fruit set and no observed pollinator visits to Silene despite similar pollinator abundances. Supplemental pollination experiments could test whether pollen limitation is indeed stronger in this site, or for less synchronously flowering individuals.
Despite the differing reproductive strategies in this gynodioecious species, we found little evidence that female and hermaphrodite plants differed in the effects of flowering phenology on reproductive success. We predicted that synchrony in flowering with conspecifics would have stronger effects for fruit set in female plants, which require outcross pollen, than in hermaphrodite plants, which are self-compatible. However, we only found support for interactions between synchrony and sex at SN1, where support for synchrony effects in general was mixed directionally and across spatial scales. Supplemental pollination experiments would be necessary to test whether fruit set is more pollen-limited in female plants than hermaphrodites. However, we did find strong and consistent differences between the sexes in overall flower production and fruit set. Female plants had much higher fruit set than hermaphrodites across all sites and years, consistent with previous studies in this system (Morris and Doak Citation1998, Delph and Carroll Citation2001).
Earlier flowering has been found to increase reproductive success in a wide variety of flowering plants (Munguía-Rasa et al. Citation2011; Austen et al. Citation2017). Earlier-flowering plants may have a longer flowering period (Hendry and Day Citation2005), which can increase opportunities for pollination and reproductive success (Delph and Ashman Citation2006). In our study, earlier-flowering plants tended to produce more flowers and to flower for a longer period of time. In addition to increased opportunities for pollination, early flowering can reduce the risk of reproductive failure because of unfavorable late-season conditions (Austen et al. Citation2017). This explanation appears most likely in our system. Soils generally dry out after snowmelt (Figure S4), and moisture stress appears to be a limiting factor for Silene performance (DeMarche, Doak, and Morris Citation2017). Reduction in summer soil moisture could increase the drought stress for plants already in dry areas, and may shift conditions such that previously wet habitats will be substantially drier. We found that earlier-flowering plants experienced greater soil moisture during flowering, and this was often associated with more flowers and/or higher fruit set. However, early flowering also increases the potential for damage from some climatic events, such as frost (Inouye Citation2008), and we detected significant quadratic effects of flowering time for fruit set, suggesting costs to the very earliest flowering plants. However, the optimal flowering time was always earlier than the mean flowering time in all sites and years, suggesting that most Silene individuals are flowering later than would be optimal for fruit production. One possible explanation for this mismatch is that climate warming may have already reduced the risks of earlier flowering because of milder spring temperatures, advancing the optimal flowering time (Anderson et al. Citation2012).
Climate change may also impact plant–pollinator relationships. While such mismatches have been widely suggested in the literature (Donnelly et al. Citation2011), we do not see strong evidence in our data for a tight activity period of pollinators, which would manifest as strong synchronous temporal changes in pollinators across all sites, untied to local flower abundance. Instead, we found that pollinator visitation to Silene was greatest during periods of large Silene floral displays. Indeed, pollinator activity has been shown to respond to local changes in floral resources (Thomson Citation1981; Kunin Citation1992) in addition to the broad seasonal and climatic effects that would drive plant–pollinator asynchrony (Parmesan Citation2007; Doi, Gordo, and Katano Citation2008; Ison et al. Citation2018). For example, bumble bees have been shown to remain in the same sites even after their primary floral resource has declined, switching to later-flowering species instead of foraging in a new area (Ogilvie and Thomson Citation2016). Such site fidelity could ensure local pollinator availability despite changes in flowering phenology. Additionally, mountain ecosystems can feature a staggered phenology of plants and insects across habitats and elevations (Pyke, Inouye, and Thomson Citation2011). In our study, most of the pollinators we observed visiting Silene were flies, which tend to be generalist foragers and may adapt behaviorally to changes in flowering phenology by foraging wherever floral resources are abundant. Overall, shifts in local phenology of Silene may not have strong consequences for pollination success so long as flowering synchrony is maintained.
Understanding the drivers of reproduction is important to anticipate the effects of climate change and to appreciate the balance of selective agents that shape flowering strategies. We find that a complex set of effects influences how flowering time impacts reproductive success in Silene. However, our work is limited in only considering fruit production; for hermaphrodites, we are missing an important aspect of fitness through siring success. A second limitation of our work is its short duration. With only two years, we have clearly not sampled a wide range of possible abiotic conditions, which would allow us to better gauge the advantages and disadvantages of earlier flowering in particular. A third limitation of our study is that we have not directly assessed pollen limitation among our sites, which would allow us to further understand the mechanisms by which biotic factors drive reproduction. Nonetheless, we have shown that fruit set in this widespread species is determined by flowering phenology, including the synchrony of flowering, as well as by annually and spatially varying aspects of microclimate. These results show both that plant–pollinator interactions can have marked effects on reproductive success and that synchrony of flowering matters for fitness, and also that these effects should not be considered in isolation from abiotic context.
Supplemental Material
Download Zip (2.4 MB)Acknowledgments
Publication of this chapter was funded by the University of Colorado Boulder Libraries Open Access Fund.
Disclosure statement
No potential conflict of interest was reported by the authors.
Supplementary material
Supplementary material for this article can be accessed here.
Additional information
Funding
Related Research Data
References
- Alatalo, J. M., and Ø. Totland. 1997. Response to simulated climatic change in an alpine and subarctic pollen-risk strategist, Silene acaulis. Global Change Biology 3:1–13. doi:https://doi.org/10.1111/j.1365-2486.1997.gcb133.x.
- Anderson, J. T., D. W. Inouye, A. M. McKinney, R. I. Colautti, and T. Mitchell-Olds. 2012. Phenotypic plasticity and adaptive evolution contribute to advancing flowering phenology in response to climate change. Proceedings of the Royal Society B: Biological Sciences 279 (1734):3843–52. doi:https://doi.org/10.1098/rspb.2012.1051.
- Ashman, T. L., T. M. Knight, J. A. Streets, P. Amaraskare, M. Burd, D. R. Campbell, and M. R. Dudash. 2004. Pollen limitation of plant reproduction: Ecological and evolutionary causes and consequences. Ecology 85 (9):2408–21. doi:https://doi.org/10.1890/03-8024.
- Augspurger, C. K. 1981. Reproductive synchrony of a tropical shrub: Experimental studies on effects of pollinators and seed predators in Hybanthus prunifolius (Violaceae). Ecology 62 (3):775–88. doi:https://doi.org/10.2307/1937745.
- Augspurger, C. K. 1983. Phenology, flowering synchrony, and fruit set of six neotropical shrubs. Biotropica 15 (4):257–67. doi:https://doi.org/10.2307/2387650.
- Austen, E. J., L. Rowe, J. R. Stinchcombe, and J. R. K. Forrest. 2017. Explaining the apparent paradox of persistent selection for early flowering. New Phytologist 215 (3):929–34. doi:https://doi.org/10.1111/nph.14580Bartomeus.
- Bartomeus, I., J. S. Ascher, D. Wagner, B. N. Danforth, S. Colla, S. Kornbluth, and R. Winfree. 2011. Climate-associated phenological advances in bee pollinators and bee-pollinated plants. Proceedings of the National Academy of Sciences 108 (51):20645–49. doi:https://doi.org/10.1073/pnas.1115559108.
- Barton, K. (2014). MuMIn: Multi-Model Inference. R package version 1.10.0. https://CRAN.R-project.org/package=MuMIn.
- Bates, D., M. Mächler, B. Bolker, and S. Walker. 2014. Fitting linear mixed-effects models using lme4. Journal of Statistical Software 67:1.
- Billings, W. D., and H. A. Mooney. 1968. The ecology of arctic and alpine plants. Biological Reviews 43:481–529. doi:https://doi.org/10.1111/j.1469-185X.1968.tb00968.x.
- Burnham, K. P., and D. R. Anderson. 2004. Multimodel inference: Understanding AIC and BIC in model selection. Sociological Methods & Research 33 (2):261–304. doi:https://doi.org/10.1177/0049124104268644.
- Canelles, Q., S. Saura-Mas, M. B. García, F. Lloret, J. Villellas, and W. F. Morris. 2017. Environmental stress effects on reproduction and sexual dimorphism in the gynodioecious species Silene acaulis.. Environmental and Experimental Botany 146:27–33. doi:https://doi.org/10.1016/j.envexpbot.2017.06.010.
- CaraDonna, P. J., A. M. Iler, and D. W. Inouye. 2014. Shifts in flowering phenology reshape a subalpine plant community. Proceedings of the National Academy of Sciences 111 (13):4916–21. doi:https://doi.org/10.1073/pnas.1323073111.
- CaraDonna, P. J., and J. A. Bain. 2016. Frost sensitivity of leaves and flowers of subalpine plants is related to tissue type and phenology. Journal of Ecology 104 (1):55–64. doi:https://doi.org/10.1111/1365-2745.12482.
- Carrol, A. B., S. G. Pallardy, and C. Galen. 2001. Drought stress, plant water status, and floral trait expression in fireweed, Epilobium angustifolium (Onagraceae). American Journal of Botany 88 (3):438–46. doi:https://doi.org/10.2307/2657108.
- Clow, D. W. 2010. Changes in the timing of snowmelt and streamflow in Colorado: A response to recent warming. Journal of Climate 23 (9):2293–306. doi:https://doi.org/10.1175/2009JCLI2951.1.
- Delph, L. F. 2004. Testing for sex differences in biparental inbreeding and its consequences in a gynodioecious species. American Journal of Botany 91 (1):45–51. doi:https://doi.org/10.3732/ajb.91.1.45.
- Delph, L. F., and S. B. Carroll. 2001. Factors affecting relative seed fitness and female frequency in a gynodioecious species, Silene acaulis. Evolutionary Ecology Research 3 (4):487–505. doi:https://doi.org/10.1126/science.1122855.
- Delph, L. F., and T. L. Ashman. 2006. Trait selection in flowering plants: How does sexual selection contribute?. Integrative and Comparative Biology 46 (4):465–72. doi:https://doi.org/10.1093/icb/icj038.
- DeMarche, M. L., D. F. Doak, and W. F. Morris. 2017. Both life-history plasticity and local adaptation will shape range-wide responses to climate warming in the tundra plant Silene acaulis. Global Change Biology 24 (4):1–12. doi:https://doi.org/10.1111/gcb.13990.
- Doak, D. F., and W. F. Morris. 2010. Demographic compensation and tipping points in climate-induced range shifts. Nature 467 (7318):959–62. doi:https://doi.org/10.1038/nature09439.
- Doi, H., O. Gordo, and I. Katano. 2008. Heterogeneous intra-annual climatic changes drive different phenological responses at two trophic levels. Climate Research 36:181–90. doi:https://doi.org/10.3354/cr00741.
- Donnelly, A., A. Caffarra, E. Diskin, C. T. Kelleher, A. Pletsers, H. Proctor, and R. Stirnemann, et al. 2011. Climate warming results in phenotypic and evolutionary cchanges in spring events: a mini-review. In Climate Change, Ecology and Systematics, 176–200. doi: https://doi.org/10.1017/CBO9780511974540.009.
- Elzinga, J. A., A. Atlen, A. Bierre, L. Gigord, A. E. Weis, and G. Bernasconi. 2007. Time after time: Flowering phenology and biotic interactions. Trends in Ecology and Evolution 22 (8):432–39. doi:https://doi.org/10.1016/j.tree.2007.05.006.
- ESRI. 2016. ArcGIS: A program for geospatial analysis. Redlands, CA: Environmental Systems Research Institute.
- Forrest, J. R. K. 2015. Plant-pollinator interactions and phenological change: What can we learn about climate impacts from experiments and observations?. Oikos 124 (1):4–13. doi:https://doi.org/10.1111/oik.01386.
- Forrest, J. R. K., and J. D. Thomson. 2011. An examination of synchrony between insect emergence and flowering in Rocky Mountain meadows. Ecological Monographs 81 (3):469–91. doi:https://doi.org/10.1890/10-1885.1.
- Forsyth, S. A. 2003. Density-dependent seed set in the Haleakala silversword: Evidence for an Allee effect. Oecologia 136 (4):551–57. doi:https://doi.org/10.1007/s00442-003-1295-3.
- Ghazoul, J. 2006. Floral diversity and the facilitation of pollination. Journal of Ecology 94:295–304. doi:https://doi.org/10.1111/j.1365-2745.2006.01098.x.
- Hegland, S. J., A. Nielson, A. Lazaro, A. L. Bjerknes, and O. Totland. 2009. How does climate warming affect plant-pollinator interactions?. Ecology Letters 12:184–95. doi:https://doi.org/10.1111/j.1461-0248.2008.01269.x.
- Hendry, A. P., and T. Day. 2005. Population structure attributable to reproductive time: Isolation by time and adaptation by time. Molecular Ecology 14 (4):901–16. doi:https://doi.org/10.1111/j.1365-294X.2005.02480.x.
- Hermenutz, L. A., and D. J. Innes. 1994. Gender variation in Silene acaulis (Caryophyllaceae). Plant Systematics and Evolution 191 (1–2):69–81. doi:https://doi.org/10.1007/BF00985343.
- Inouye, D. W. 2008. Effects of climate change on phenology, frost damage, and floral abundance of montane wildflowers. Ecology 89 (2):353–62. doi:https://doi.org/10.1890/06-2128.1.
- Inouye, D. W., and A. D. McGuire. 1991. Effects of snowpack on timing and abundance of flowering in Delphinium nelsonii (Ranunculaceae): Implications for climate change. American Journal of Botany 78 (7):997–1001. doi:https://doi.org/10.1002/j.1537-2197.1991.tb14504.x.
- Inouye, D. W., F. Saavedra, and W. Lee-Yang. 2003. Environmental influences on the phenology and abundance of flowering by Androsace septentrionalis (Primulaceae). American Journal of Botany 90 (6):905–10. doi:https://doi.org/10.3732/ajb.90.6.905.
- Ison, J. L., L. J. Prescott, S. W. Nordstrom, A. Waananen, and S. Wagenius. 2018. Pollinator‐mediated mechanisms for increased reproductive success in early flowering plants. Oikos 00:1–13. doi:https://doi.org/10.1111/oik.04882.
- Jones, V., and P. W. Richards. 1962. Silene Acaulis (L.) Jacq. Journal of Ecology 50 (2):475–87. doi:https://doi.org/10.2307/2257458.
- Kempe, K. 2014. The effect of flowering synchrony on reproductive success in the tundra cushion plant Silene acaulis. M.S. thesis, Uppsala University.
- Kittel, T. G. F., M. W. Williams, K. Chowanski, M. Hartman, T. Ackerman, M. Losleben, and P. D. Blanken. 2015. Contrasting long-term alpine and subalpine precipitation trends in a mid-latitude North American mountain system, Colorado Front Range, USA. Plant Ecology & Diversity 8 (5–6):607–24. doi:https://doi.org/10.1080/17550874.2016.1143536.
- Klinkhamer, P. G. L., and T. J. De Jong. 1990. Effects of plant size, plant density and sex differential nectar reward on pollinator visitation in the protandrous Echium vulgare (Boraginaceae). Nordic Society Oikos 57 (3):399–405. doi: https://doi.org/10.2307/3565970.
- Kudo, G. 1993. Relationships between flowering time and fruit set of the entomophilous alpine shrub, Rhododendron aureum (Ericaceae), inhabiting snow patches. American Journal of Botany 80 (11):1300–04. doi:https://doi.org/10.2307/2445714.
- Kudo, G. 2006. Flowering phenologies of animal-pollinated plants: Reproductive strategies and agents of selection. Ecology and Evolution of Flowers 8:139–58.
- Kudo, G., and T. Y. Ida. 2013. Early onset of spring increases the phenological mismatch between plants and pollinators. Ecology 94 (10):2311–20. doi:https://doi.org/10.1890/12-2003.1.
- Kunin, W. E. 1992. Density of reproductive success in wild populations of Diplotaxis erucoides (Brassicaceae). Oecologia 91:129–33. doi:https://doi.org/10.1007/BF00317251.
- Mahoro, S. 2002. Individual flowering schedule, fruit set, and flower and seed predation in Vaccinium hirtum Thunb. (Ericaceae). Canadian Journal of Botany 80 (1):82–92. doi:https://doi.org/10.1139/b01-136.
- Marr, D. L. 1997. Impact of a pollinator-transmitted disease on reproduction in healthy Silene acaulis. Ecology 78 (5):1471–80. doi:https://doi.org/10.1890/0012-9658(1997)078[1471:IOAPTD]2.0.CO;2.
- Memmott, J., P. G. Craze, N. M. Waser, and M. V. Price. 2007. Global warming and the disruption of plant-pollinator interactions. Ecology Letters 10:710–17. doi:https://doi.org/10.1111/j.1461-0248.2007.01061.x.
- Menzel, A., T. H. Sparks, N. Estrella, E. Koch, A. Aasas, R. Aasas, and K. Alm-Kubler. 2006. European phenological response to climate change matches the warming pattern. Global Change Biology 12:1969–76. doi:https://doi.org/10.1111/j.1365-2486.2006.01193.x.
- Molau, U. 1993. Relationships between flowering phenology and life history strategies in tundra plants. Arctic and Alpine Research 25 (4):391–402. doi:https://doi.org/10.2307/1551922.
- Morris, W. F., and D. F. Doak. 1998. Life history of the long-lived gynodioecious cushion plant Silene acaulis (Caryophyllaceae), inferred from size-based population projection matrices. American Journal of Botany 85 (6):784–93. doi:https://doi.org/10.2307/2446413.
- Munguía-Rasa, M. A., J. Ollerton, V. Parra-Tabla, and J. A. De-Nova. 2011. Meta-analysis of phenotypic selection on flowering phenology suggests that early flowering plants are favoured. Ecology Letters 14 (5):511–21. doi:https://doi.org/10.1111/j.1461-0248.2011.01601.x.
- Ogilvie, J. E., and J. D. Thomson. 2016. Site fidelity by bees drives pollination facilitation in sequentially blooming plant species. Ecology 97 (6):1442–51. doi:https://doi.org/10.1890/15-0903.1.
- Ollerton, J., and A. Diaz. 1999. Evidence for stabilising selection acting on flowering time in Arum maculatum (Araceae): The influence of phylogeny on adaptation. Oecologia 119 (3):340–48. doi:https://doi.org/10.1007/s0044200507.
- Ollerton, J., and A. Lack. 1998. Relationships between flowering phenology, plant size and reproductive success in Lotus corniculatus (Fabaceae). Plant Ecology 139 (1):35–47. doi:https://doi.org/10.1023/A:100979832.
- Parmesan, C. 2007. Influences of species, latitudes and methodologies on estimates of phenological response to global warming. Global Change Biology 13:1860–72. doi:https://doi.org/10.1111/j.1365-2486.2007.01404.x.
- Peñuelas, J., G. Gordon, L. Llorens, T. Nielsen, A. Tietema, C. Beier, P. Bruna, B. Emmett, M. Estiarte, and A. Gorissen. 2004. Nonintrusive field experiments show different plant responses to warming and drought among sites, seasons, and species in a north-south European gradient. Ecosystems 7 (6):598–612. doi: https://doi.org/10.1007/s10021-004-0179-7.
- Pleasants, J. M. 1980. Competition for bumblebee pollinators in Rocky Mountain plant communities. Ecology 61 (6):1446–59. doi:https://doi.org/10.2307/1939053.
- Pyke, G. H., D. W. Inouye, and J. D. Thomson. 2011. Activity and abundance of bumble bees near Crested Butte, Colorado: Diel, seasonal, and elevation effects. Ecological Entomology 36:511–21. doi: https://doi.org/10.1111/j.1365-2311.2011.01295.x.
- R Core Team. 2013. R: A language and environment for statistical computing. Vienna, Austria: R Foundation for Statistical Computing.
- Rafferty, N. E., and A. R. Ives. 2011. Effects of experimental shifts in flowering phenology on plant-pollinator interactions. Ecology Letters 14 (1):69–74. doi:https://doi.org/10.1111/j.1461-0248.2010.01557.x.
- Rathcke, B, and E. P. Lacey. 1985. Phenological patterns of terrestrial plants. Annual Review of Ecology and Systematics 16:179–214. doi:https://doi.org/10.1146/annurev.es.16.110185.001143.
- Robertson, A. W., and M. R. Macnair. 1995. The effects of floral display size on pollinator service to individual flowers of Myosotis and Mimulus. Oikos 72 (1):106–14. doi:https://doi.org/10.2307/3546044.
- Rodriguez-Perez, J., and A. Traveset. 2016. Effects of flowering phenology and synchrony on the reproductive success of a long-flowering shrub. AoB Plants 8:1–15. doi:https://doi.org/10.1093/aobpla/plw007.
- Schoener, T. W. 1970. Nonsynchronous spatial overlap of lizards in patchy habitats. Ecology 51 (3):408–18. doi:https://doi.org/10.2307/1935376.
- Shykoff, J. A. 1988. Maintenance of gynodioecy in Silene acaulis (Caryophyllaceae): Stage-specific fecundity and viability selection. American Journal of Botany 75 (6):844–50. doi:https://doi.org/10.2307/2444003.
- Shykoff, J. A. 1992. Sex polymorphism in Silene acaulis (Caryophyllaceae) and the possible role of sexual selection in maintaining females. American Journal of Botany 79 (2):138–43. doi:https://doi.org/10.2307/2445100.
- Shykoff, J. A., S. O. Kololotronis, C. L. Collin, and M. López-Villavicencio. 2003. Effects of male sterility on reproductive traits in gynodioecious plants: A meta-analysis. Oecologia 135 (1):1–9. doi:https://doi.org/10.1007/s00442-002-1133-z.
- Tarayre, M., G. Bowman, A. Schermann-Legionnet, M. Barat, and A. Atlan. 2007. Flowering phenology of Ulex europaeus: Ecological consequences of variation within and among populations. Evolutionary Ecology 21 (3):395–409. doi: https://doi.org/10.1007/s10682-006-9109–9.
- Thomson, J. D. 1981. Spatial and temporal components of resource assessment by flower-feeding insects. Journal of Animal Ecology 50 (1):49–59. doi:https://doi.org/10.2307/4030.
- Thomson, J. D. 2010. Flowering phenology, fruiting success and progressive deterioration of pollination in an early-flowering geophyte. Philosophical Transactions of the Royal Society 365:3187–99. doi:https://doi.org/10.1098/rstb.2010.0115.