
 ?Mathematical formulae have been encoded as MathML and are displayed in this HTML version using MathJax in order to improve their display. Uncheck the box to turn MathJax off. This feature requires Javascript. Click on a formula to zoom.
ABSTRACT
In this study we assess the total storage, landscape distribution, and vertical partitioning of soil organic carbon (SOC) stocks on the Brøgger Peninsula, Svalbard. This type of high Arctic area is underrepresented in SOC databases for the northern permafrost region. Physico-chemical, elemental, and radiocarbon (14C) dating analyses were carried out on thirty-two soil profiles. Results were upscaled using both a land cover classification (LCC) and a landform classification (LFC). Both LCC and LFC approaches provide weighted mean SOC 0–100 cm estimates for the study area of 1.0 ± 0.3 kg C m−2 (95% confidence interval) and indicate that about 68 percent of the total SOC storage occurs in the upper 30 cm of the soil, and about 10 percent occurs in the surface organic layer. Furthermore, LCC and LFC upscaling approaches provide similar spatial SOC allocation estimates and emphasize the dominant role of “vegetated area” (4.2 ± 1.6 kg C m−2) and “solifluction slopes” (6.7 ± 3.6 kg C m−2) in SOC 0–100 cm storage. LCC and LFC approaches report different and complementary information on the dominant processes controlling the spatial and vertical distribution of SOC in the landscape. There is no evidence for any significant SOC storage in the permafrost layer. We hypothesize, therefore, that the Brøgger Peninsula and similar areas of the high Arctic will become net carbon sinks, providing negative feedback on global warming in the future. The surface area that will have vegetation cover and incipient soil development will expand, whereas only small amounts of organic matter will experience increased decomposition due to active-layer deepening.
Introduction
Cold conditions in permafrost soils hamper organic-matter decomposition by microorganisms, and thereby contribute to the accumulation of large soil organic carbon (SOC) pools. Hugelius et al. (Citation2014) estimated that northern circumpolar permafrost soils store about 1,300 ± 200 Pg Carbon (C), which represents nearly twice as much C as currently present in the atmosphere. As a response to global warming, which is particularly pronounced at high latitudes (Vaughan et al. Citation2013), permafrost thaw is expected to lead to the remobilization of previously frozen soil organic matter (SOM). The resulting SOM decomposition that is the result of increased microbial activity could release large amounts of carbon dioxide (CO2) and methane (CH4) into the atmosphere and provide a positive feedback on global warming by strengthening the greenhouse effect (Schaefer et al. Citation2014; Schuur et al. Citation2015).
The fate of the permafrost SOC pool has been of growing concern in the recent decade because permafrost is expected to considerably degrade under projected global warming (Chadburn et al. Citation2017). Yet, the ability to quantify potential greenhouse-gas release from thawing permafrost is limited, among other things, by the uncertainty in distribution and vulnerability of the permafrost SOC stocks in certain under-sampled areas of the northern circumpolar region (Mishra et al. Citation2013; Hugelius et al. Citation2014).
High Arctic (and high Arctic-Alpine) regions are substantially underrepresented in northern circumpolar SOC inventories, such as the Northern Circumpolar Soil Carbon Database (NCSCD; Tarnocai et al. Citation2009; Horwath Burnham and Sletten Citation2010; Hugelius et al. Citation2014; Palmtag et al. Citation2015). Furthermore, little work has been done to investigate SOC upscaling tools specifically adapted to the high Arctic environment (Horwath Burnham and Sletten Citation2010), where land cover classification (LCC) upscaling approaches that are used in more southern permafrost regions might fail to produce accurate results. Several studies have particularly highlighted the inability of low-resolution remote sensing analyses to produce relevant LCC in the high Arctic (Johansen, Karlsen, and Tømmervik Citation2012; Spjelkavik Citation1995). Furthermore, the relationship between landforms and SOC distribution in the high Arctic has been demonstrated in several studies (Landi, Mermut, and Anderson Citation2004; Horwath Burnham et al. Citation2008; Michaelson et al. Citation2008; Obu et al. Citation2017; Shelef et al. Citation2017; Palmtag et al. Citation2018). In order to fill gaps in the NCSCD (Hugelius et al. Citation2014), this study aims to provide new pedon data on SOC storage and spatial distribution on the Brøgger Peninsula (Svalbard), and to further discuss its potential remobilization under the conditions of future global warming. Another aim is to investigate to what extent geomorphological landform units can be used to upscale SOC estimates in comparison to land cover–based approaches (Hugelius Citation2012).
Study area
The Brøgger Peninsula is located on Spitsbergen, the largest island in the Svalbard Archipelago (). The study area is 165 km2 and is bounded eastward by the Edithbreen and Botnfjellbreen catchments. It borders Kongsfjorden to the north and Engelskbukta to the south.
Figure 1. The study area with sampling sites on the Brøgger Peninsula, located in the northwestern part of the Island of Spitsbergen (Svalbard Archipelago).
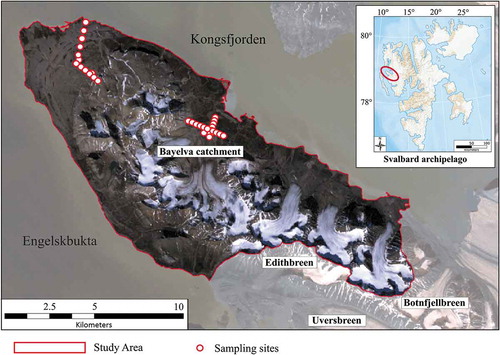
The central part of the study area is mountainous, dominated by a plateau landscape in the northwestern half and by alpine mountains with steep flanks in the southeastern half. It encompasses twelve glaciers and the highest point (Nobilefjellet peak) has an elevation of 876 m above present sea level (a.p.s.l). Apart from glaciers, barren steep bedrock outcrops and colluvial fans, as well as glacial till deposits, prevail in the most elevated part of the study area. At lower altitudes, frost heave and gelifluction action result in the formation of periglacial landforms, such as sorted circle fields on flat terrain and solifluction slopes on gently sloping terrain. Sandurs are widespread in floodplains and consist mostly of glacial till and marine and/or slope materials reworked by glacial meltwater (Dallmann and Elvevold Citation2015). Relict raised beaches are typical landforms of the coastal areas of the Brøgger Peninsula. They were formed as a result of the regional isostatic uplift following deglaciation, and consist mainly of sea-bed deposits.
The bedrock geology of the study area is dominated by Upper Carboniferous and Permian rocks with quartzite and interlayered carbonates. Coal seams are present in the fieldwork area. The surface geomorphology of the Svalbard Archipelago was largely shaped by ice movement during glaciations in the Pleistocene. The last deglaciation occurred stepwise during the late Pleistocene to early Holocene transition. A glacial minimum is recorded from 8000 to 7000 BP and two glacial advances are dated to 2500 BP and 120 BP (Humlum, Instanes, and Sollid Citation2003). Glaciers today occupy about 30 percent of the study area. The glacier Austre Brøggerbreen has a retreat rate of approximately 10–20 m yr−1 (Svendsen et al. Citation2002).
The Brøgger Peninsula is located in the high Arctic, defined as the region north of the 4–6°C mean July temperature isotherm range (Bliss Citation1979). Ny-Ålesund had a mean annual air temperature of −5.8°C, a mean February (coldest month) temperature of −13.8°C, and a mean July temperature of 5.2°C for the period 1981–2010 (Norwegian Meteorological Institute Citation2015). Mean annual precipitation is 385 ± 11 mm per year (Førland et al. Citation2011). Although snow is the most frequent type of precipitation throughout the year, most precipitation occurs as rainfall in August and September (Mann et al. Citation1986; Svendsen et al. Citation2002).
The permafrost of the Brøgger Peninsula is continuous, and has a temperature of approximately −2.8°C and a depth of zero annual temperature variation of 5.5 m (1997–2017; Boike et al. Citation2018). According to Svendsen et al. (Citation2002), however, the zero annual ground temperature amplitude is located within 10–15 m depth. The permafrost is about 100 m close to the sea and up to 500 m in the mountains, but is typically thinner in unconsolidated sediments and thicker in rocks (Humlum, Instanes, and Sollid Citation2003). Roth and Boike (Citation2001) estimated that the active-layer depth ranges between 0.9 m and 1.1 m in Bayleva valley at 30 m a.p.s.l.
Dominant soil types are weakly developed Orthent and Entisols, mostly Lithic Haplorthels (Soil Survey Staff Citation2010). Sites with permafrost within 100 cm of the soil surface are classified as Gelisols. The soils in river beds and glacial fluvial floodplains can be classified as Fluvents and Fluvaquents. Soils are generally poorly developed and shallow, with limited soil genetic horizon development, high stone content, as well limited nutrient availability. Chemical weathering–induced decarbonation of surface horizons is a widespread process.
Materials and methods
Field sampling
Soil profiles were collected in the second half of July 2013, when active-layer depth and biomass development are near their maximum. An additional profile was collected in September 2015.
In total, thirty-two soil profiles were collected along four 1–2 km landscape transects. The location of the transects was established after field reconnaissance to capture all important land cover and landform classes in the study area. The distance between sampling sites is constant along each transect, ranging from 100 m to 200 m depending on the degree of land cover and geomorphological heterogeneity. This semi-random stratified sampling approach ensures that all important landscape units are sampled, but avoids subjective choices of individual sampling locations. Each site was described and photographed, documenting water-table depth (if present) and drainage and topographic conditions (slope and aspect). For later classification and calculation purposes, ground cover (percent of surface area) of plant taxa, bare ground, and stones were recorded within a 10 m radius surrounding each pit.
A total of 180 soil samples were collected in 5–15 cm depth increments. The top soil organic layer (OL, equivalent to O and OA soil genetic horizons) was sampled by cutting out blocks of known volume. Two additional random OL replicates were collected within a 5 m radius from each profile site to capture local microtopographic heterogeneity. Samples in shallow mineral horizons (down to about 30 cm depth) were collected using a 100 cm3 stainless core cutter inserted horizontally into exposed soil pits. For sampling at greater depths, a steel pipe (Ø = 4.2 cm) was hammered into the ground. No soil genetic horizons were observed below the top soil organic layer. The profiles were sampled down to 1 m depth when possible, although sampling often stopped before that because of high stone content or because bedrock was reached. The permafrost table was never reached during the sampling.
Geochemical analyses
The wet bulk density (WBD, g.cm−3) and dry bulk density (DBD, g.cm−3) of all samples were determined using field volume and weight before and after drying at 75°C for a week (Blake Citation1965). The DBD was corrected based on the additional small fraction of water loss when drying subsamples at 105°C for another 24 h. Coarse fragment fraction (CF, %wt) is the proportion of the dry weight of the mineral fraction (exceeding more than 2 mm). Fine fraction bulk density (FFBD, g.cm−3) of all samples was calculated by subtracting the volume and weight of the coarse fraction from the total weight and volume of the sample. The latter was calculated from a mean coarse fraction bulk density of a representative subset of twenty-four samples from various areas and horizons that was measured using water displacement in a measuring cylinder. The FFBD was used in SOC content calculations instead of DBD to prevent SOC overestimation because of the higher bulk density of CF (Horwath Burnham and Sletten Citation2010). It should be noted that a few outlier bulk density values could be attributed to compaction or stone displacement during field sampling. The organic matter content (OM) and carbonate content (CC) of all samples were calculated with equations 1 and 2 (Heiri, Lotter, and Lemcke Citation2001), using the homogenized sample weight after drying 105°C (DW105) and the sample weight after combustion at 550°C for 6 h (DW550) and at 950°C for 3 h (DW950).
A subset of seventy-two homogenized and freeze-dried subsamples were analyzed using an EA 1110 Elemental Analyzer (CE Instruments, Milan, Italy) at the University of Vienna, Austria, Department of Chemical Ecology and Ecosystem Research, to determine the elemental carbon (%C) and total nitrogen (%TN) content as well as the stable isotopic composition of δ13C and δ15N. The δ13C and δ15N were measured to characterize the advancement of SOM decomposition. These samples were selected from profiles in various land cover and landform types, as well as from different soil depths, to capture the diversity of soils in the study area. Subsamples were treated with 10 percent HCl prior the elemental analysis to remove carbonates and prevent organic C overestimation. The detection limit was 0.5 µmol for C and 1 µmol for N. A third-order polynomial regression (R2 = 0.95) between %C and OM was used to estimate the %C for the remaining samples:
Student’s t test was used to assess for differences in mean FFBD, OM, CC, %C, C/N ratio, δ13C, and δ15N between the topsoil organic layer and the mineral horizons. Pearson’s correlation coefficient was used to characterize the correlation between the FFBD, OM, %C, C/N ratio, δ13C, and δ15N with depth, and was considered significant if p < 0.01. All statistical analyses were performed using Microsoft Excel.
Four samples were processed by accelerator mass spectrometry (AMS) in the Poznan Radiocarbon Laboratory (Poland) for 14C dating. The radiocarbon dates were then calibrated using the Oxcal v4.3 software based on the INTCAL13 calibration data set (Ramsey Citation2009; Reimer et al. Citation2013) and are expressed as calendar years before present (cal yr BP). Living roots were removed prior to analysis. These samples were selected for their high OM values in the mineral horizon, which may indicate the presence of buried SOM. No visible contamination with macroscopic coal particles was observed.
Land cover and landform classifications
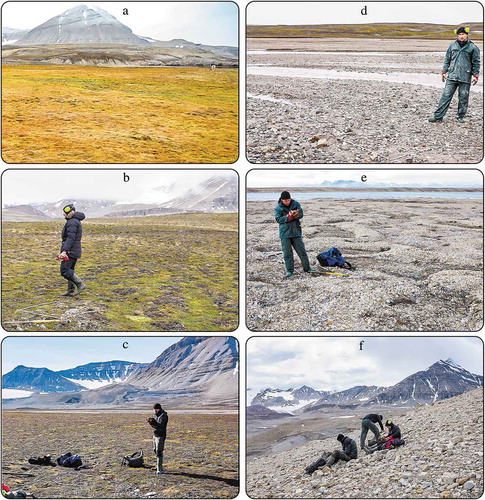
shows examples of sampling sites from major land cover and landform units in Brøgger Peninsula. The boundary of the study area was delineated using the Hydrology Toolbox of ArcGIS on the ASTER G-DEM Version 2. The results of field inventories were then upscaled using both LCC and landform (LFC) classification schemes. The LCC was composed of eight classes and was mostly build using a Landsat 5 TM satellite image. An additional Landsat 8 OLI/TIRS satellite image was used to determine land cover classes in the area of the Landsat 5 TM image classified as shadows (12 percent of the study area). The Landsat 5 TM and Landsat 8 OLI/TIRS images were acquired in the second half of July in both 2006 and 2014, respectively, and both have a 30 × 30 m resolution (US Geological Survey Citation2015).
Figure 2. Typical land cover and landform classes on the Brøgger Peninsula (Svalbard). Land cover classes: the term “vegetated area” is used to group all vegetated land cover classes together: fen tundra (a), dense shrub moss tundra (b), patchy shrub moss tundra, and sparse shrub moss tundra (c). The fraction of the land surface covered with vegetation is within the range 95–100 percent for fen tundra, 75–95 percent for dense shrub moss tundra, 25–75 percent for patchy shrub moss tundra, and 5–25 percent for sparse shrub moss tundra. The fraction of the land surface covered by vegetation is less than 5 percent for the land cover classes: bare glacial fluvial sediment (d), barren gravel (e and f), and shallow open water. Landform classes: both solifluction lobes and solifluction sheets are grouped under “solifluction slopes” (a and b), sandur (d), patterned ground (e), and colluvial fans (f).
In the LCC, the dominant vegetation type “shrub moss tundra” is typically located in plains, from coastal areas up to 70 m a.p.s.l (Spjelkavik Citation1995), and is dominated by dwarfshrubs (Dryas, Salix polaris), forbs (Saxifraga oppositifolia), graminoids (Deschampsia alpina), mosses (Dicranum angustum, Tomentypnum nitens), and lichens (Cetrariella delisei, Cetraria nivalis; Elvebakk Citation1994). Note that in this study, the term shrub does not refer to shrub species but to the dwarfism of the moss tundra found in Brøgger Peninsula compared to other Arctic regions at lower latitudes. The land cover classes “sparse shrub moss tundra,” “patchy shrub moss tundra,” and “dense shrub moss tundra” had similar species composition but were distinguished by the fraction of land surface occupied by vegetation: 5–25%, 25–75%, and 75–95%, respectively (). The remaining fraction of the ground surface not covered by vegetation was bare ground and stones. The land cover type “fen tundra” is typically found in flat and wet lowlands where waterlogged conditions in early summer as well as increased nutrient status by geese droppings promote the development of several centimeter-thick layers of black peaty material. Fen tundra vegetation is dense (covering more than 95 percent of the ground surface in the class) and is dominated by grass (D. alpina), mosses (e.g., Scorpidium cossonii), and aquatic algae (Spjelkavik Citation1995; Johansen and Tømmervik Citation2014). The land cover classes “sparse shrub moss tundra,” “patchy shrub moss tundra,” “dense shrub moss tundra,” and “fen tundra” were mapped using the following range of SAVI values: 0–0.1, 0.1–0.21, 0.21–0.35, and 0.35–0.8 (Qi et al. Citation1994). The land cover of the class “bare glacial fluvial sediment” consists of sediments deposited by glacial meltwater in a floodplain environment. These deposits consist of from coarse- to medium-grain sand as well as poorly sorted and bedded gravel, with numerous cobbles, boulders, and lenses of till. The class “bare glacial fluvial sediment” was mapped by performing a supervised classification using maximum likelihood classification (Campbell and Randolph Citation2011) on the bands 1, 2, and 4 of the Landsat TM image, where the training areas were manually digitized with the help of high-resolution aerial images of the Norwegian Polar Institute. The vegetation of the land cover class “shallow open water” is poorly developed and composed of some sedges and grasses (Soegaard and Nordstroem Citation1999). This land cover class was manually digitized using all the bands of the Landsat TM image as well as the aerial images of the Norwegian Polar Institute. Shadow areas and the class “glacier” were mapped using the normalized difference snow index on the Landsat 5 TM image (Salomonson and Appel Citation2004). The land cover class “barren gravel” is generally found in wind-exposed, poorly drained mountainous areas or marine terraces (Elvebakk Citation1985), and has very sparse vegetation (less than 5 percent of the surface), with forbs (S. oppositifolia), dry herbs, mosses, and epilithic, crustaceous lichens (Elvebakk Citation1994; Yoshitake et al. Citation2011).
All eight classes of the LFC were digitized from legend units used in a geomorphological map of this area (Joly Citation1969; ). The class “solifluction slopes” of the landform classification refers to periglacial sediment affected by solifluction. In Brøgger Peninsula, it occurs on gently sloping terrain on valley bottoms and hill toes (Dallmann and Elvevold Citation2015). Gelifluction mass wasting and cryoturbation can potentially cause the burial of SOC-rich surface horizons (Bockheim and Tarnocai). “Sandurs” landforms are formed by the deposition of secondary glacigenic sediments or slope deposits reworked by meltwater outwash in proglacial terrains (Dallmann and Elvevold Citation2015). Unlike the similar class “bare glacial fluvial sediment” of the LCC, the landform class “sandurs” encompasses both current and ancient glacial fluvial plains. The landform class “colluvial fans” refers to unconsolidated rock-slope debris material deposited at the base of cliffs by rock fall or landslide processes, and consists of unsorted angular mainly coarse-grained materials. “Raised beaches” are near-shore areas elevated above sea level during interglacial periods because of the regional isostatic uplift of the Earth’s crust. This type of landform often occurs as a series of ridges parallel to the shore and consist of marine-rounded gravel deposits (Forman and Miller Citation1984; Dallmann and Elvevold Citation2015). In the LFC, the class “patterned ground” groups periglacial landforms such as sorted circles, sorted stripes, and frost boils (Humlum, Instanes, and Sollid Citation2003; Dallmann and Elvevold Citation2015). Sorted circles are more extensively described in Hallet and Prestrud (Citation1986). “Moraines” are accumulations of primary glacigenic unconsolidated deposits at glacial margins.
LCC and LFC accuracy was tested with 100 randomly distributed ground-truthing points, using high-resolution (40– 50 cm) aerial imageries (Norwegian Polar Institute Citation2015). Results were reported in an error matrix, which enabled the calculation of overall classification accuracy and Kappa index (Foody Citation2002; Campbell and Randolph Citation2011). Kappa index values of 1 indicate correct classification, whereas values close to −1 indicate a high degree of randomness in the classification.
In addition, a profile-based ground-truthing analysis was carried out, comparing the location of each profile in the LCC and LFC with their original field classification.
Soil organic carbon calculations and upscaling
The SOC content (kg C m−2) of each collected sample was calculated based on fine fraction bulk density (FFBD, g.cm−3), the organic carbon content (%C, %wt), the coarse fragment fraction (CF >2 mm, %wt), and sample thickness (T, cm):
For OL replicates, mean properties (FFBD, %C, CF, and T) were used to calculate a single mean SOC value for the OL in each profile (Hugelius et al. Citation2010). In rare cases (n = 4), the SOC content of missing samples was estimated using the mean values of the samples directly below and above. As well, the SOC content of a few samples was corrected based on the estimated fraction of boulders that were too large to be collected during the fieldwork based on in situ visual estimates and photographs.
The SOC mass of all collected samples per profile was added up to determine the total SOC content (kg C m−2) of each profile. The SOC content of each profile was corrected for the fraction of larger stones visible at the surface (within a 10 m radius of the profile site), which we assumed has no soil development and 0 kg C m−2. Mean SOC storage per profile was also calculated separately for OL and mineral layers as well as for the reference depths 0–30 cm (SOC 0–30 cm) and 0–100 cm (SOC 0–100 cm). TN content was calculated using the same method to a depth of 100 cm.
For upscaling purposes, all profiles were grouped into LC and LF classes based on field observations. Mean SOC storage and depth for each land cover and landform class and their different soil horizons were calculated using the arithmetic mean of profiles within the same class. Standard deviation was further used to characterize the range of SOC and depth values for each class and its soil horizons (arithmetic mean ±SD). Permanent snow patches, glaciers, stones, and bedrock were not sampled and are assumed to have 0 kg C m−2 SOC storage. The total SOC storage of each class in the LCC and LFC was calculated by extrapolating the mean SOC content across their areal coverage (estimated using equal-area projection). Landscape mean SOC storage for the entire study area was calculated using the mean SOC storage in each class, weighed by its proportional coverage in the study area. The fraction of the total SOC mass occurring in 0–30 cm, 0–100 cm, and OL or mineral horizons was calculated by dividing the total SOC mass of these horizons by the total SOC mass of the study area.
Following the same method, the TN content of the study area was calculated using land cover and landform upscaling approaches to a depth of 100 cm. To address uncertainties in the upscaling, 95 percent confidence intervals (weighted mean ± 95 percent CI) were calculated for the total study area in LCC and LFC, as well as for the “vegetated area,” which considers all vegetated land cover classes together. These 95 percent CI were calculated following Thompson (Citation1992) using equation 5, where t is the upper a/2 (t ≈ 1.96), ai is the fraction of the whole study area occupied by the class i, SDi is the standard deviation of the class i, and ni is the number of replicates in the class i.
Results
Land cover classification upscaling
The overall LCC accuracy is 78 percent with a Kappa index of agreement of 0.71. If all vegetated classes are merged together, the overall classification accuracy and Kappa index of agreement increases to 84 percent and 0.78, respectively. This is in concordance with the profile-based ground-truthing analysis, which indicated that only 13 percent of the profiles in the LCC were misclassified.
The landscape-level weighed mean SOC 0–100 cm storage for the study area is 1.0 ± 0.3 kg C m−2, if all classes are considered, and 1.3 ± 0.4 kg C m−2, if excluding the class “glacier.” The top 30 cm of the soil stores 66 percent of the total SOC and has a weighed mean SOC 0–30 cm storage of 0.6 ± 0.3 kg C m−2. The OL (weighed mean depth of 1.4 ± 2.2 cm) and mineral horizons have a weighed mean SOC storage of 0.1 ± 0.04 and 0.9 ± 0.2 kg C m−2, respectively, which corresponds to 10 percent and 90 percent of the total SOC 0–100 cm storage in the study area. and show the LCC of the study area and the SOC partitioning based on land-cover class and soil horizon criteria. Mean SOC storage for each land-cover class and soil horizon are presented in . The most widespread land-cover classes in the study area are “barren gravel” (49%) and “glacier” (29%), with 0.4 kg C m−2 and 0.0 kg C m−2, respectively.
Table 1. Mean SOC storage and site characteristics for land cover classes on the Brøgger Peninsula (Svalbard).
Figure 3. Land cover classification of the Brøgger Peninsula (Svalbard).
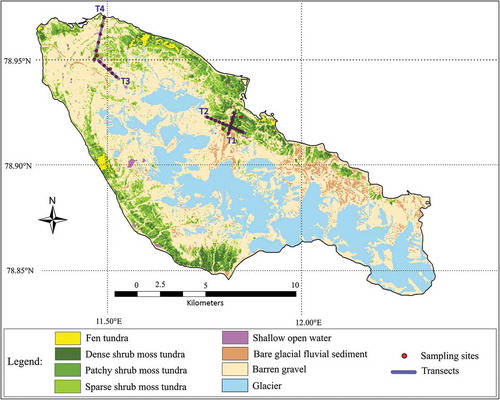
Figure 4. Proportion of area and vertical SOC allocation in each land cover class of the Brøgger Peninsula (Svalbard).
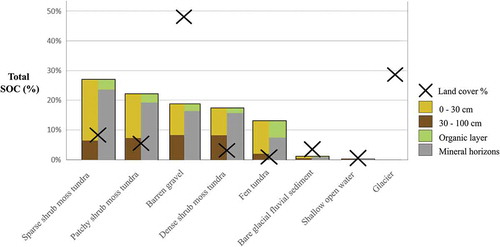
The term “vegetated area” groups all vegetated land-cover classes together (“fen tundra,” “dense shrub moss tundra,” “patchy shrub moss tundra,” and “sparse shrub moss tundra”). Although it extends across only 18 percent of the study area, the amalgamated class “vegetated area” accounts for 80 percent of the total SOC 0–100 cm storage with a weighed mean of 4.2 ± 1.6 kg C m−2. “Vegetated area” is also the class with the greatest average soil depth (68.2 ± 29.0 cm). We estimate that 10 percent of the SOC in “vegetated area” is stored in the OL (weighed mean depth of 2.5 ± 2.6 cm) and 66 percent is stored in the top 30 cm.
The weighed mean TN 0–100 cm storage for the entire study area is 0.2 ± 0.2 kg N m−2 and for the “vegetated area” 0.6 ± 0.7 kg N m−2. As expected, the TN 0–100 cm storage values are higher in densely vegetated classes than in poorly vegetated classes, with values ranging from 1.4 ± 0.8 kg N m−2 in “dense shrub moss tundra” to 0.4 ± 0.2 kg N m−2 in “sparse shrub moss tundra” ().
Landform classification upscaling
The LFC has an overall classification accuracy of 74 percent and a Kappa index of agreement of 0.69. The profile-based ground-truthing analysis indicates similar results, with 20 percent of the profiles being misclassified in the LFC.
With the LFC upscaling, the landscape-level weighed mean SOC 0–100 cm storage is 1.0 ± 0.3 kg C m−2, if all classes included, and 1.5 ± 0.4 kg C m−2, if excluding the class “glaciers.” The top 30 cm contain on average 70 percent of the total SOC, with a weighed mean SOC 0–30 cm storage of 0.7 ± 0.3 kg C m−2. The OL stores only 10 percent of the total SOC, with a weighed mean SOC of 0.1 ± 0.1 kg C m−2.
presents the mean SOC storage for each landform class and their different soil horizons. The classes “glaciers” (covering 31%) and “colluvial fans” (19%), with very low SOC 0–100 cm values, are dominant in the central part of the study area ( and ).
Table 2. Mean SOC storage and site characteristics for landform classes on the Brøgger Peninsula (Svalbard).
Figure 5. Landform classification of the Brøgger Peninsula (Svalbard), adapted from Joly (Citation1969).
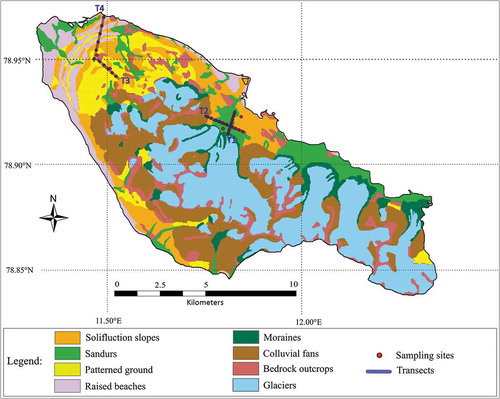
Figure 6. Proportion of area and vertical SOC allocation in each landform class of the Brøgger Peninsula (Svalbard).
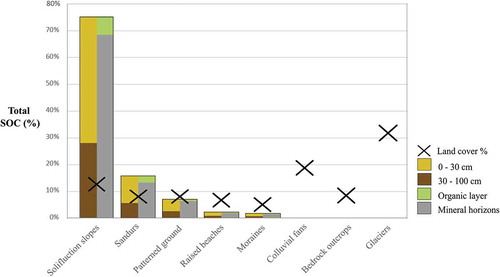
The class “solifluction slopes” in the LFC holds the largest part (75%) of the total SOC storage, although it only covers 12 percent of the study area. It has a mean SOC storage of 5.0 ± 3.9 in 0–30 cm and 6.7 ± 3.6 kg C m−2 in 0–100 cm. The class “solifluction slopes” has a mean profile depth of 76.4 ± 24.6 cm and 76 percent of its SOC is stored in the top 30 cm. We estimated that 8 percent of the SOC in the class “solifluction slopes” is stored in the OL, which has a mean depth of 3.2 ± 3.0 cm.
Overall, the weighed mean TN 0–100 cm is 0.2 ± 0.2 kg N m−2, with the highest values of 1.1 ± 0.8 kg N m−2 found in the “solifluction slopes” class ().
Geochemical analyses
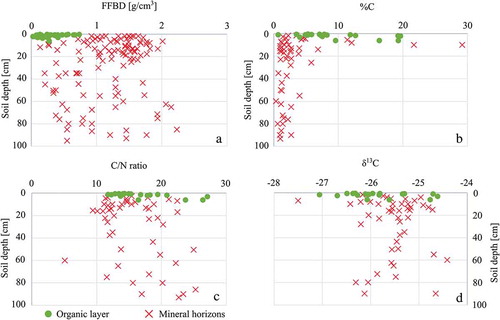
presents a statistical summary of the geochemical and elemental analyses. The student’s t tests indicated that FFBD, OM, and %C of the OL and the mineral subsoil are significantly different (p < 0.05). While the FFBD has a positive correlation (p < 0.01, R2 = 0.05) with depth, both OM content (p < 0.01, R2 = 0.16) and %C (p < 0.01, R2 = 0.10) correlate negatively with depth.
Table 3. Statistical summary of geochemical and elemental analyses.
CC measurements indicate a particularly high mean carbonate content of 8.1 percent ± 9.5 percent (n = 180 samples). The mean CC is statistically significantly different (p < 0.001) between the OL (3.8% ± 4.9%) and mineral horizons (9.8% ± 10.3%).
C/N ratios of OL (16.8 ± 4.4) and mineral horizon (17.6 ± 8.0) samples have no statistically significant difference. As well, no statistically significant differences were found between δ15N of OL (−0.6 ± 1.4) and the mineral horizon (−1.1 ± 4.8) samples. On the contrary, the δ13C was significantly different (p < 0.1) in the OL (−24.6 ± 5.7) and mineral horizons (−23.3 ± 6.3). Neither C/N ratios (p > 0.01, R2 = 0.02), δ15N, nor δ13C (p > 0.01, R2 = 0.05) showed any correlation with depth ().
Figure 7. Results of the geochemical analyses of soil samples of the Brøgger Peninsula. The fine fraction bulk density (a) was plotted using all of the 180 samples collected. The percentage of organic carbon (b), the C/N weight ratio (c), and the isotopic composition of δ13C were plotted using the seventy-two samples analyzed, using an Elemental Analyzer.
Four samples collected from soil profiles in the vegetated area affected by solifluction were submitted for radiocarbon dating (). The calibrated ages for the samples in profiles NA T1-1 (2,079 ± 131) and NA T1-4 (5,190 ± 136) have dates corresponding to the Late to Middle Holocene period, whereas samples from profiles NA T2-2 (30,566 ± 1,180) and NA T2-1 (30,865 ± 1,140) are dated to the Late Pleistocene period.
Table 4. Radiocarbon dating results.
Discussion
Comparison of SOC estimates with previous studies
Yoshitake et al. (Citation2011) estimated that the Bayelva catchment () had a mean SOC 0–100 cm of 4.3 kg C m−2. In our study this area is dominated by the land cover classes “vegetated area” (weighed mean SOC 0–100 cm storage of 4.2 ± 1.6 kg C m−2) and “bare fluvial glacial sediment” (mean SOC 0–100 cm storage of 0.3 ± 0.1 kg C m−2). Based on geomorphology, the LFC classes “solifluction slopes” and “sandurs” are dominant in this area and have a mean SOC 0–100 cm storage of 6.7 ± 3.6 and 2.0 ± 2.4 kg C m−2. Yoshitake et al. (Citation2011) further provided a SOC 0–100 cm storage estimate of 0.4 kg C m−2 for the vegetation type equivalent to our class “barren gravel” (SOC 0–100 cm of 0.4 ± 0.4 kg C m−2). The results of our study show similar vertical SOC allocation patterns for the different classes. Yoshitake et al. (Citation2011) found that a higher proportion of SOC is stored in the top 10 cm in the early successional-stage bare ground than in the developed lowland vegetated areas on the Bayelva catchment.
Similar SOC estimates to those obtained for this study have also been reported by Fuchs, Kuhry, and Hugelius (Citation2015) in the alpine permafrost environment of Tarfala valley (northwestern Sweden). Mean SOC 0–100 cm storage was 4.6 ± 1.2 for vegetated areas and 0.9 ± 0.2 kg C m−2 for the whole study area. Our results are also supported by a mountainous high Arctic tundra site in northeast Greenland (Palmtag et al. Citation2018), with an estimated mean SOC storage for the 0–100 cm soil depth of 4.8 kg C m−2, by using landform-based upscaling.
The vegetation units Polar Semi-Desert and Polar Desert of the Arctic Vegetation Classification introduced by Bliss (Citation1979) can be considered as equivalent to the land cover classes “vegetated area” and “barren gravel” in our study, respectively. Horwath Burnham and Sletten (Citation2010) provided mean SOC 0–100 cm values of 7.9 and 2.2 kg C m−2 for Polar Semi-Desert and Polar Desert in the Thule region (northwest Greenland). These estimates are slightly higher than the mean SOC 0–100 cm for the entire high Arctic region, as presented by Miller, Kendall, and Oechel (Citation1983) for Polar Semi-Desert (7.2 kg C m−2) and Polar Desert (0.09 kg C m−2). Bliss and Matveyeva (Citation1992) estimated that the high Arctic region has a mean SOC 0–100 cm storage of 1.2 kg C m−2, based on weighed means for the vegetation units implemented by Miller, Kendall, and Oechel (Citation1983).
Hugelius et al. (Citation2014) provided a mean SOC storage for Svalbard, ranging from 0.1 to 20 kg C m−2 for depths of 0–3 m in the Northern Circumpolar Soil Carbon Database (NCSCD). Just recently, Weiss et al. (Citation2017) provided a new regional estimate for Spitsbergen, amounting to a weighed mean SOC 0–100 cm storage of approximately 5.3 ± 5.5 kg C m−2, which includes the vegetated areas, bare grounds, and stone surfaces, as well as the glaciated parts of the island. Using profile-based upscaling in large-scale SOC inventories for the high Arctic tends to overestimate the mean SOC storage, because sampling is often biased toward vegetated areas and neglect the most carbon-poor classes. Palmtag et al. (Citation2015) and Fuchs, Kuhry, and Hugelius (Citation2015) emphasize the importance of including all land cover classes for weighed landscape upscaling to provide more realistic SOC estimates, especially in highly heterogeneous high Arctic and Arctic-Alpine regions. To facilitate the comparability of results between studies, however, it is relevant to also provide weighed mean SOC storage estimates for exposed ground area, excluding glaciers and water. If the class “glacier” is excluded (about 30 percent of the study area), the weighed mean SOC 0–100 cm storage of our study area is 1.3 ± 0.4 kg C m−2 in the LCC and 1.5 ± 0.4 kg C m−2 in the LFC.
Land cover and landform classifications for SOC upscaling
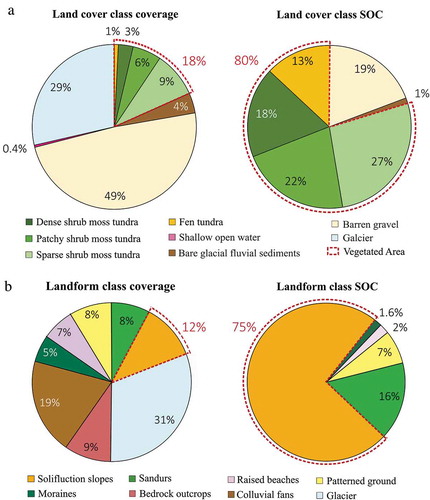
The LCC- and LFC-based SOC upscaling both provided SOC 0–100 cm storage estimates of 1.0 ± 0.3 kg C m−2. The classes “vegetated area” of the LCC and “solifluction slopes” of the LFC have the highest mean SOC 0–100 cm storages of 4.2 ± 1.6 and 6.7 ± 3.6 kg C m−2, respectively. They store 80 percent and 75 percent of the total SOC 0–100 cm in the study area, although they only cover 18 percent and 12 percent of the study area (). Therefore, the accuracy of the landscape SOC inventory largely depends on the SOC estimate for these classes.
Figure 8. Proportion of area and total SOC 0–100 cm storage for land cover (a) and landform (b) classes on the Brøgger Peninsula (Svalbard).
LCC and LFC approaches report complementary information on the different dominant processes controlling the spatial and vertical distribution of SOC in the landscape. The use of LCCs for SOC upscaling is based on the observation that plant primary production is the paramount process controlling SOC enrichment in soils. Our results corroborate this observation by showing a clear positive correlation between SOC storage and the fraction of land surface occupied by vegetation: “sparse shrub moss tundra” has a mean SOC 0–100 cm of 2.9 ± 2.1, “patchy shrub moss tundra” is 3.7 ± 2.7, “dense shrub moss tundra” is 5.9 ± 1.2, and “fen tundra” is 15.6 kg C m−2. LCC-based SOC upscaling methods have been widely used in the lowland permafrost environments of the low Arctic (e.g., Kuhry et al. Citation2002; Hugelius et al. Citation2011; Hugelius Citation2012; Siewert et al. Citation2015). Yet, LCC-based SOC upscaling becomes less relevant in high Arctic regions such as the Brøgger Peninsula, where the vegetation cover is too poorly developed and diversified to be adequately captured by low-resolution satellite images alone (Raynolds, Walker, and Maier Citation2006; Mora et al. Citation2015).
Besides plant cover, using landform units as a spatial support to predict the distribution of SOC is relevant in high Arctic terrains because it can be used to characterize the origin, removal, and deposition as well as the physical and chemical alteration of sediments and SOM (Palmtag et al. Citation2018). Recently deglaciated morainic environments are typically barren or associated with early successional vegetation/soil stages, and therefore hold little amount of SOM (Bradley, Singarayer, and Anesio Citation2014). Glacial fluvial landforms sustain more developed yet more heterogeneous ecosystems than moraines because of the formation of dynamic braided drainage patterns by erosional hydrological disturbances (Moreau et al. Citation2008; Wojcik et al. Citation2019). Periglacial processes play a central role in controlling the spatial and vertical distribution of SOM (e.g., via cryoturbation) and their importance for predicting SOC storage in Arctic regions has been emphasized in previous studies (Palmtag et al. Citation2015; Obu et al. Citation2017; Weiss et al. Citation2017). As well, slope-controlled geomorphological processes have previously successfully been used to predict the spatial distribution of SOC in a variety of terrains (e.g., Moorman et al. Citation2004; Schwanghart and Jarmer Citation2011), with the highest SOM content typically found at slope toes because of the preservation of buried SOM (Yoo et al. Citation2006; Berhe et al. Citation2008; Hancock, Murphy, and Evans Citation2010; Palmtag et al. Citation2018). Continuous mass wasting landforms such as solifluction and soil-creep processes associated with periglacial processes have been found particularly prone to the accumulation of thick SOM deposits at hill toes (Lewkowicz and Clarke Citation1998; Obu et al. Citation2017; Shelef et al. Citation2017). In accordance with these observations, the LFC-based SOC upscaling emphasized the important SOC storage of “solifluction slopes” in our study. We further found that the mean soil depth in solifluction slopes (76.4 ± 24.6 cm) is higher than the landscape weighed mean (44.3 ± 35.9 cm), reflecting the processes of soil vertical accretion and SOM accumulation. Alternatively, some slope-controlled landforms are too steep to support the establishment of vegetation such as “colluvial fans,” which have little supply of SOM and therefore a poor SOC storage.
The long-term geomorphological processes relative to the burial and accumulation of SOM are essential to correctly predict SOC storage, but can hardly be captured by satellite image–based LCCs (Obu et al. Citation2017). The use of LFCs for SOC upscaling purposes is primarily limited by the scarcity of geomorphological maps. Nevertheless, where available, they can be used to compare SOC estimates as it reports a complementary perspective on SOC distribution patterns compared to those obtained through satellite imagery–derived land-cover schemes.
Geochemical characteristics and future dynamics of SOM
Compared to lower latitude areas of the northern circumpolar permafrost region, the Brøgger Peninsula stores little SOC. The combination of stony ground, short growing season, and nutrient scarcity enables only discontinuous vegetation and soil development. Both LCC- and LFC-based SOC upscaling approaches indicate shallow soils where the largest part of the total SOC mass is found in the top 30 cm (~70%) and in mineral horizons (~90%). The main reasons for this are the bedrock close to the surface and the occurrence of large stones, limiting soil depth to a mean of 44.3 ± 35.9 cm. SOC storage shows a negative correlation with soil depth.
We dated four samples that showed C-enrichment deeper down in the soil profiles. Based on the Pleistocene dates of two soil samples with unusually high OM content values, we assume that these local C-enrichments are caused by fine-dust coal contamination, rather than burial of SOM. During the Late Pleistocene, the study area was completely glaciated. Similarly, Nakatsubo et al. (Citation2008) reported that radiocarbon age discrepancies between a seashell (11,080 yr BP) and SOM (22,380 yr BP) in one and the same profile (at 44 cm depth) in the Bayelva catchment were most likely the result of the contamination with coal particles. Nakatsubo et al. (Citation2008) also suggested that cryoturbation may be the cause of the reversed 14C ages that were observed in the shallow horizons of their soil profiles (less than 42.5 cm). We consider it likely that our two C-enriched mineral subsoil samples with Late to Middle Holocene ages could be the result of burial through slope processes or cryoturbation (Ping et al. Citation1998).
The absence of correlation between C/N and δ13C and δ15N with depth indicates relatively homogeneous and advanced stages of SOM decomposition in the different soil horizons (Ping et al. Citation1998; Hugelius et al. Citation2012). Nakatsubo et al. (Citation2005) reported similar C/N values ranging from seventeen in the vegetated lowland of the Bayelva catchment up to eighty in the most recently deglaciated areas (about 1 km from the Austre Brøggerbreen ice front). Fuchs, Kuhry, and Hugelius (Citation2015) also found similar C/N ratio means of 23.3 ± 11.4 and 14.6 ± 4.05 and δ13C means of −26.8 ± 1.0 and −25.6 ± 1.0, respectively, for the OL and mineral horizons of soils in the mountain permafrost environment of Tarfala Valley (northern Sweden). However, it should be noted that C/N ratio values also depend on vegetation composition, and therefore comparison of values should be interpreted with care (Ping et al. Citation1998).
None of our soil profiles reached down to the permafrost table. However, most of the SOC is presumably stored in the active layer, down to depths ranging from 0.9 m to 1.1 m in the Bayelva catchment (Roth and Boike Citation2001) and only a very small to negligible amount in the permafrost. Based on active-layer depths and SOC stocks, we suggest that projected temperature increases and subsequent deepening of the active layer will not result in the remobilization of large amounts of previously frozen SOC in the Brøgger Peninsula and similar high Arctic environments. Instead, we expect that the little C loss from thawing permafrost will be outweighed by the ecosystem C uptake from increasing plant primary productivity and soil development as a result of the lengthening of the growing season and wetting of the high Arctic (Sharp et al. Citation2013; Lupascu et al. Citation2014). The Brøgger Peninsula and similar high Arctic environments are likely to become net ecosystem C sinks and provide negative feedback on future global warming.
Conclusions
The present study provides new data on the total storage as well as spatial and vertical distribution of SOC in the Brøgger Peninsula, a high Arctic mountainous area located in the Svalbard Archipelago.
This study also aims to investigate the benefits of using landform geomorphological units for SOC upscaling in comparison to satellite-based land-cover approaches. Land-cover and landform upscaling approaches provided comparable SOC stocks and spatial distribution estimates and emphasized the importance of “vegetated areas” and “solifluction slope” landforms for SOC storage. Our study shows that the LFC-based SOC upscaling approach reports a complementary perspective to the satellite-based LCC approach because it provides essential information on the geomorphological processes controlling the accumulation and burial of SOC. Together, both LCC and LFC approaches allow us to fully comprehend the processes controlling SOC distribution in the landscape. We suggest that future work should focus on investigating the value of using LFC to predict the SOC distribution in high Arctic and Arctic-Alpine regions.
The Brøgger Peninsula stores little SOC compared to most lower latitude permafrost regions. Most SOC is stored at shallow depth in the active layer and only limited evidence of SOM burial through cryoturbation was found. The C/N ratios further reflected an advanced stage of SOM decomposition in the different soil horizons. Based on these findings, we expect that future global warming and subsequent degradation of permafrost will result in the remobilization of only small amounts of C. Instead, it is more likely that the Brøgger Peninsula and similar ecosystems of the high Arctic become carbon sinks in the future as the result of increasing biomass production and soil development.
Large areas of the high Arctic and high Arctic-Alpine regions remain underrepresented in SOC databases such as the NCSCD (Hugelius et al. Citation2014), with limited amounts of sampled soil pedons. This study emphasizes that more quantitative SOC storage estimates will be required in the future to better predict the response of the high Arctic SOC pool to climate warming.
Disclosure statement
No potential conflict of interest was reported by the authors.
Additional information
Funding
References
- Berhe, A. A., J. W. Harden, M. S. Torn, and J. Harte. 2008. Linking soil organic matter dynamics and erosion‐induced terrestrial carbon sequestration at different landform positions. Journal of Geophysical Research: Biogeosciences 113:G04039. doi:10.1029/2008JG000751.
- Blake, G. R. 1965. Bulk density. In Agronomy Monograph, 374–90. Madison: American Society of Agronomy, Soil Science Society of America.
- Bliss, L. C. 1979. Vascular plant vegetation of the southern circumpolar region in relation to the Antarctic, alpine and Arctic vegetation. Canadian Journal of Botany 57:2167–78. http://www.nrcresearchpress.com/doi/abs/10.1139/b79-270?journalCode=cjb1.
- Bliss, L. C., and N. V. Matveyeva. 1992. Circumpolar Arctic vegetation. Arctic ecosystems in a changing climate: An ecophysiological perspective, 59–89. San Diego: Academic Press. doi:10.1016/B978-0-12-168250-7.50010-9.
- Bockheim, J. G., L. R. Everett, K. M. Hinkel, F. E. Nelson, and J. Brown. 1999. Soil organic carbon storage and distribution in arctic tundra, Barrow. Alaska. Soil Science Society of America Journal 63:934–40. doi:10.2136/sssaj1999.634934x.
- Boike, J., I. Juszak, S. Lange, S. Chadburn, E. Burke, P. P. Overduin, K. Roth, O. Ippisch, N. Bornemann, and L. Stern. 2018. A 20-year record (1998–2017) of permafrost, active layer and meteorological conditions at a high Arctic permafrost research site (Bayelva, Spitsbergen). Earth System Science Data 10 (1):355. doi:10.5194/essd-10-355-2018.
- Bradley, J. A., J. S. Singarayer, and A. M. Anesio. 2014. Microbial community dynamics in the forefield of glaciers. Proceedings of the Royal Society B: Biological Sciences 281 (1795):20140882. doi:10.1098/rspb.2014.0882.
- Campbell, J. B., and H. W. Randolph. 2011. Introduction to remote sensing, 667. 5th ed. New York, NY: Guilford Press.
- Chadburn, S., E. Burke, P. Cox, P. Friedlingstein, G. Hugelius, and S. Westermann. 2017. An observation-based constraint on permafrost loss as a function of global warming. Nature Climate Change 7 (5):340. doi:10.1038/nclimate3262.
- Dallmann, W., and S. Elvevold. 2015. Chapter 7: Bedrock geology. Geoscience Atlas of Svalbard. Norwegian Polar Institute Report Series 148:133–74.
- Elvebakk, A. 1985. Higher phytosociological syntaxa on Svalbard and their use in subdivision of the Arctic. Nordic Journal of Botany 5 (3):273–84. doi:10.1111/j.1756-1051.1985.tb01656.x.
- Elvebakk, A. 1994. A survey of plant associations and alliances from Svalbard. Journal of Vegetation Science 5:791–802. doi:10.2307/3236194.
- Foody, G. M. 2002. Status of land cover classification accuracy assessment. Remote Sensing of Environment 80 (1):185–201. doi:10.1016/S0034-4257(01)00295-4.
- Førland, E. J., R. Benestad, I. Hanssen-Bauer, J. E. Haugen, and T. E. Skaugen. 2011. Temperature and precipitation development at Svalbard 1900–2100. Advances in Meteorology 2011:893790. doi:10.1155/2011/893790
- Forman, S. L., and G. H. Miller. 1984. Time-dependent soil morphologies and pedogenic processes on raised beaches, Bröggerhalvöya, Spitsbergen, Svalbard Archipelago. Arctic and Alpine Research 16 (4):381–94. doi:10.2307/1550900.
- Fuchs, M., P. Kuhry, and G. Hugelius. 2015. Low below-ground organic carbon storage in a subarctic Alpine permafrost environment. The Cryosphere 9:427–38. doi:10.5194/tc-9-427-2015.
- Hallet, B., and S. Prestrud. 1986. Dynamics of periglacial sorted circles in western Spitsbergen. Quaternary Research 26 (1):81–99. doi:10.1016/0033-5894(86)90085-2.
- Hancock, G., D. Murphy, and K. Evans. 2010. Hillslope and catchment scale soil organic carbon concentration: An assessment of the role of geomorphology and soil erosion in an undisturbed environment. Geoderma 155 (1):36–45. doi:10.1016/j.geoderma.2009.11.021.
- Heiri, O., A. F. Lotter, and G. Lemcke. 2001. Loss on ignition as a method for estimating organic and carbonate content in sediments: Reproducibility and comparability of results. Journal of Paleolimnology 25:101–10. doi:10.1023/A:1008119611481.
- Horwath Burnham, J., and R. S. Sletten. 2010. Spatial distribution of soil organic carbon in northwest Greenland and underestimates of high Arctic carbon stores. Global Biogeochemical Cycles 24 :GB3012. doi:10.1029/2009GB003660.
- Horwath Burnham, J., R. S. Sletten, B. Hagedorn, and B. Hallet. 2008. Spatial and temporal distribution of soil organic carbon in nonsorted striped patterned ground of the High Arctic. Journal of Geophysical Research: Biogeosciences 113:1–16. doi:10.1029/2007JG000511.
- Hugelius, G. 2012. Spatial upscaling using thematic maps: An analysis of uncertainties in permafrost soil carbon estimates. Global Biogeochemical Cycles GB2026. doi:10.1029/2011GB004154.
- Hugelius, G., J. Routh, P. Kuhry, and P. Crill. 2012. Mapping the degree of decomposition and thaw remobilization potential of soil organic matter in discontinuous permafrost terrain. Journal of Geophysical Research 117:G02030. doi:10.1029/2011JG001873.
- Hugelius, G., J. Strauss, S. Zubrzycki, J. W. Harden, E. A. G. Schuur, C. L. Ping, L. Schirrmeister, G. Grosse, G. J. Michaelson, C. Koven, et al. 2014. Estimated stocks of circumpolar permafrost carbon with quantified uncertainty ranges and identified data gaps. Biogeosciences 11:6573–93. doi:10.5194/bg-11-6573-2014.
- Hugelius, G., P. Kuhry, C. Tarnocai, and T. Virtanen. 2010. Soil organic carbon pools in a periglacial landscape: A case study from the central Canadian Arctic. Permafrost and Periglacial Processes 21:16–29. doi:10.1002/ppp.677.
- Hugelius, G., T. Virtanen, D. Kaverin, A. Pastukhov, F. Rivkin, S. Marchenko, V. Romanovsky, and P. Kuhry. 2011. High‐resolution mapping of ecosystem carbon storage and potential effects of permafrost thaw in periglacial terrain, European Russian Arctic. Journal of Geophysical Research: Biogeosciences 116 (G3). doi:10.1029/2010JG001606.
- Humlum, O., A. Instanes, and J. L. Sollid. 2003. Permafrost in Svalbard: A review of research history, climatic background and engineering challenges. Polar Research 22 (2):191–215. doi:10.1111/j.1751-8369.2003.tb00107.
- Johansen, B., and H. Tømmervik. 2014. The relationship between phytomass, NDVI and vegetation communities on Svalbard. International Journal of Applied Earth Observation and Geoinformation 27:20–30. doi:10.1016/j.jag.2013.07.001.
- Johansen, B. E., S. R. Karlsen, and H. Tømmervik. 2012. Vegetation mapping of Svalbard utilising Landsat TM/ETM+ data. Polar Record 48:47–63. doi:10.1017/S0032247411000647.
- Joly, P. F. 1969. Carte Géomorphologique de reconnaissance de la presqu’île de Brögger (Spitsberg). 1:50.000. Paris: Service de documentation et de cartographie géographiques du C.N.R.S. Institut du Géographie.
- Kuhry, P., G. Mazhitova, P. A. Forest, S. Deneva, T. Virtanen, and S. Kultti. 2002. Upscaling soil organic carbon estimates for the Usa Basin (Northeast European Russia) using GIS-based landcover and soil classification schemes. Geografisk Tidsskrift-Danish Journal of Geography 102 (1):11–25. doi:10.1080/00167223.2002.10649462.
- Landi, A., A. R. Mermut, and D. W. Anderson. 2004. Carbon distribution in a hummocky landscape from Saskatchewan, Canada. Soil Science Society of America Journal 68:175–84. doi:10.2136/sssaj2004.1750.
- Lewkowicz, A. G., and S. Clarke. 1998. Late-summer solifluction and active layer depths, Fosheim Peninsula, Ellesmere Island, Canada. In PERMAFROST – Seventh International Conference (Proceedings), Yellowknife (Canada), Collection Nordica No. 55. Centre d’études nordiques, Université Laval, Yellowknife, Canada, 641–66.
- Lupascu, M., J. M. Welker, U. Seibt, K. Maseyk, X. Xu, and C. I. Czimczik. 2014. High Arctic wetting reduces permafrost carbon feedbacks to climate warming. Nature Climate Change 4:51–55. doi:10.1038/nclimate2058.
- Mann, D., R. Sletten, and F. Ugolini. 1986. Soil development at Kongsfjorden, Spitsbergen. Polar Research 4 (1):1–16. doi: 10.3402/polar.v4i1.6914.
- Michaelson, G. J., C. L. Ping, H. Epstein, J. M. Kimble, and D. A. Walker. 2008. Soils and frost boil ecosystems across the North American Arctic Transect. Journal of Geophysical Research 113:G03S11. doi:10.1029/2007JG000672.
- Miller, P. C., R. Kendall, and W. C. Oechel. 1983. Simulating carbon accumulation in northern ecosystems. Simulation 40 (4):119–31. doi:10.1177/003754978304000402.
- Mishra, U., J. D. Jastrow, R. Matamala, G. Hugelius, C. D. Koven, J. W. Harden, C. L. Ping, G. J. Michaelson, Z. Fan, R. M. Miller, et al. 2013. Empirical estimates to reduce modeling uncertainties of soil organic carbon in permafrost regions: A review of recent progress and remaining challenges. Environmental Research Letters 8 (3):35020. doi:10.1088/1748-9326/8/3/035.
- Moorman, T., C. Cambardella, D. James, D. Karlen, and L. Kramer. 2004. Quantification of tillage and landscape effects on soil carbon in small Iowa watersheds. Soil and Tillage Research 78 (2):225–36. doi:10.1016/j.still.2004.02.014.
- Mora, C., G. Vieira, P. Pina, M. Lousada, and H. H. Christiansen. 2015. Land cover classification using high-resolution aerial photography in Adventdalen, Svalbard. Geografiska Annaler: Series A, Physical Geography 97:473–88. doi:10.1111/geoa.12088.
- Moreau, M., D. Mercier, D. Laffly, and E. Roussel. 2008. Impacts of recent paraglacial dynamics on plant colonization: A case study on Midtre Lovénbreen foreland, Spitsbergen (79 N). Geomorphology 95 (1–2):48–60. doi:10.1016/j.geomorph.2006.07.031.
- Nakatsubo, T., S. Yoshitake, M. Uchida, M. Uchida, Y. Shibata, and H. Koizumi. 2008. Organic carbon and microbial biomass in a raised beach deposit under terrestrial vegetation in the High Arctic, Ny-Ålesund, Svalbard. Polar Research 27 (1):23–27. doi:10.1111/j.1751-8369.2008.00037.x.
- Nakatsubo, T., Y. S. Bekku, M. Uchida, H. Muraoka, A. Kume, T. Ohtsuka, T. Masuzawa, H. Kanda, and H. Koizumi. 2005. Ecosystem development and carbon cycle on a glacier foreland in the high Arctic, Ny-Ålesund, Svalbard. Journal of Plant Research 118 (3):173–79. doi:10.1007/s10265-005-0211-9.
- Norwegian Meteorological Institute. Meteorological data, 25 March 2015. Accessed April 24, 2015. https://www.yr.no/place/Norway/.
- Norwegian Polar Institute. Aerial photos TopoSvalbard data, 25 March 2015. Accessed February 24, 2015. http://toposvalbard.npolar.no/last.
- Obu, J., H. Lantuit, I. Myers‐Smith, B. Heim, J. Wolter, and M. Fritz. 2017. Effect of terrain characteristics on soil organic carbon and total nitrogen stocks in soils of Herschel Island, western Canadian Arctic. Permafrost and Periglacial Processes 28 (1):92–107. doi:10.1002/ppp.v28.1.
- Palmtag, J., G. Hugelius, N. Lashchinskiy, M. P. Tamstorf, A. Richter, B. Elberling, and P. Kuhry. 2015. Storage, landscape distribution and burial history of soil organic matter in contrasting areas of continuous permafrost. Arctic, Antarctic, and Alpine Research 47 (1):71–88. doi:10.1657/AAAR0014-027.
- Palmtag, J., S. Cable, H. H. Christiansen, G. Hugelius, and P. Kuhry. 2018. Landform partitioning and estimates of deep storage of soil organic matter in Zackenberg, Greenland. The Cryosphere 12:1735–44. doi:10.5194/tc-12-1735-2018.
- Ping, C. L., J. G. Bockheim, J. M. Kimble, G. J. Michaelson, and D. A. Walker. 1998. Characteristics of cryogenic soils along a latitudinal transect in arctic Alaska. Journal of Geophysical Research: Atmospheres 103 (D22):28917–28. doi:10.1029/98JD02024.
- Qi, J., A. Chehbouni, K. Y. H. Huete, and S. Sorooshian. 1994. A modified soil adjusted vegetation index. Remote Sensing of Environment 48 (2):119–26. doi:10.1016/0034-4257(94)90134-1.
- Ramsey, C. B. 2009. Bayesian analysis of radiocarbon dates. Radiocarbon 51 (1):337–60. doi:10.1017/S0033822200033865.
- Raynolds, M. K., D. A. Walker, and H. A. Maier. 2006. NDVI patterns and phytomass distribution in the circumpolar Arctic. Remote Sensing of Environment 102:271–81. doi:10.1016/j.rse.2006.02.016.
- Reimer, P. J., E. Bard, A. Bayliss, J. W. Beck, P. G. Blackwell, C. B. Ramsey, C. E. Buck, H. Cheng, R. L. Edwards, and M. Friedrich. 2013. IntCal13 and Marine13 radiocarbon age calibration curves 0–50,000 years cal BP. Radiocarbon 55 (4):1869–87. doi:10.2458/azu_js_rc.55.16947.
- Roth, K., and J. Boike. 2001. Quantifying the thermal dynamics of a permafrost site near Ny-Ålesund, Svalbard. Water Resources Research 37 (12):2901–14. doi:10.1029/2000WR000163.
- Salomonson, V. V., and I. Appel. 2004. Estimating fractional snow cover from MODIS using the normalized difference snow index. Remote Sensing of Environment 89 (3):351–60. doi:10.1016/j.rse.2003.10.016.
- Schaefer, K., H. Lantuit, V. E. Romanovsky, E. A. G. Schuur, and R. Witt. 2014. The impact of the permafrost carbon feedback on global climate. Environmental Research Letters 9 (8):085003. doi:10.1088/1748-9326/9/8/085003.
- Schuur, E. A. G., A. D. McGuire, C. Schädel, G. Grosse, J. W. Harden, D. J. Hayes, G. Hugelius, C. D. Koven, P. Kuhry, D. M. Lawrence, et al. 2015. Climate change and the permafrost carbon feedback. Nature 520 (7546):171–79. doi:10.1038/nature14338.
- Schwanghart, W., and T. Jarmer. 2011. Linking spatial patterns of soil organic carbon to topography—A case study from south-eastern Spain. Geomorphology 126 (1–2):252–63. doi:10.1016/j.geomorph.2010.11.008.
- Sharp, E. D., P. F. Sullivan, H. Steltzer, A. Z. Csank, and J. M. Welker. 2013. Complex carbon cycle responses to multi-level warming and supplemental summer rain in the high Arctic. Global Change Biology 19 (6):1780–92. doi:10.1111/gcb.12149.
- Shelef, E., J. C. Rowland, C. J. Wilson, G. Hilley, U. Mishra, G. L. Altmann, and C. L. Ping. 2017. Large uncertainty in permafrost carbon stocks due to hillslope soil deposits. Geophysical Research Letters 44 (12):6134–44. doi:10.1002/2017GL073823.
- Siewert, M. B., J. Hanisch, N. Weiss, P. Kuhry, T. C. Maximov, and G. Hugelius. 2015. Comparing carbon storage of Siberian tundra and taiga permafrost ecosystems at very high spatial resolution. Journal of Geophysical Research: Biogeosciences 120 (10):1973–94.
- Soegaard, H., and C. Nordstroem. 1999. Carbon dioxide exchange in a high arctic fen estimated by eddy covariance measurements and modelling. Global Change Biology 5 (5):547–62. doi:10.1046/j.1365-2486.1999.00250.x.
- Soil Survey Staff. 2010. Keys to Soil Taxonomy. 11th ed. Washington, DC: USDA–Natural Resources Conservation Service.
- Spjelkavik, S. 1995. A satellite-based map compared to a traditional vegetation map of Arctic vegetation in the Ny-Ålesund area, Svalbard. Polar Record 31 (177). doi: 10.1017/S0032247400013760.
- Svendsen, H., A. Beszczynska-Møller, J. O. Hagen, B. Lefauconnier, V. Tverberg, S. Gerland, J. B. Ørbøk, K. Bischof, C. Papucci, M. Zajaczkowski, et al. 2002. The physical environment of Kongsfjorden–Krossfjorden, an Arctic fjord system in Svalbard. Polar Research 21 (1):133–66. doi:10.1111/j.1751-8369.2002.tb00072.
- Tarnocai, C., J. G. Canadell, E. A. G. Schuur, P. Kuhry, G. Mazhitova, and S. Zimov. 2009. Soil organic carbon pools in the northern circumpolar permafrost region. Global Biogeochemical Cycles 23:1–11. doi:10.1029/2008GB003327.
- Thompson, S. K. 1992. Sampling, 343. New York, NY: John Wiley.
- US Geological Survey: Earth Resources Observation and Science Center (EROS), USGS Global Visualization Viewer, Landsat 5 TM satellite image, Accessed March 25, 2015. http://glovis.usgs.gov/.
- Vardy, S. R., B. G. Warner, J. Turunen, and R. Aravena. 2000. Carbon accumulation in permafrost peatlands in the northwest territories and Nunavut, Canada. The Holocene 10:273–80. doi:10.1191/095968300671749538.
- Vaughan, D. G., J. C. Comiso, I. Allison, J. Carrasco, G. Kaser, R. Kwok, P. Mote, T. Murray, F. Paul, J. Ren, et al. 2013. Observations: Cryosphere. In Climate change 2013: The physical science basis. contribution of working group I to the fifth assessment report of the intergovernmental panel on climate change, Intergovernmental Panel on Climate Change, ed., 317–82. Cambridge and New York: Cambridge University Press.
- Weiss, N., S. Faucherre, N. Lampiris, and R. Wojcik. 2017. Elevation-based upscaling of organic carbon stocks in High-Arctic permafrost terrain: A storage and distribution assessment for Spitsbergen, Svalbard. Polar Research 36 (1):1400363. doi:10.1080/17518369.2017.1400363.
- Wojcik, R., J. Donhauser, S. Holm, L. Malard, A. Holland, B. Frey, D. Wagner, P. Pearce, A. Anesio, and L. G. B. Benning. 2019. Linkages between geochemistry and microbiology in a proglacial terrain in Svalbard. Annals of Glaciology. doi: 10.1017/aog.2019.1.
- Yoo, K., R. Amundson, A. M. Heimsath, and W. E. Dietrich. 2006. Spatial patterns of soil organic carbon on hillslopes: Integrating geomorphic processes and the biological C cycle. Geoderma 130 (1–2):47–65. doi:10.1016/j.geoderma.2005.01.008.
- Yoshitake, S., M. Uchida, T. Ohtsuka, and H. Kanda. 2011. Vegetation development and carbon storage on a glacier foreland Ny-Ålesund, Svalbard in the High Arctic, Ny-Ålesund. Polar Science 5 (3):391–97. doi:10.1016/j.polar.2011.03.002.