
 ?Mathematical formulae have been encoded as MathML and are displayed in this HTML version using MathJax in order to improve their display. Uncheck the box to turn MathJax off. This feature requires Javascript. Click on a formula to zoom.
ABSTRACT
Ongoing responses to climate change in arctic-alpine ecosystems, including the increasing dominance of deciduous shrubs, involve major shifts in plant functional group composition. Because rates of photosynthesis and respiration and their responses to temperature may vary among plant functional groups, a better understanding of their contributions to carbon fluxes will help improve predictions of how ecosystem changes will affect carbon source-sink relations in globally important tundra regions. We used a sequential harvest method to estimate growing season functional group contributions to net ecosystem exchange (NEE), ecosystem respiration (ER), and gross photosynthesis (GP) in alpine heath-, meadow-, and Salix-dominated shrub communities. We also partitioned ER into aboveground and belowground components in all three communities. Belowground efflux was the dominant component of ER in the heath and meadow communities (63 percent and 88 percent of ER, respectively) but contributed only approximately 40 percent of ER in the shrub community. The dominant functional group in each community contributed most to aboveground exchanges. Estimates for cryptogams were uncertain, but indicated a minor role for bryophytes and lichens in overall exchange. The results of our novel method of partitioning gas-exchange measurements suggest strong differences in the relative proportions of soil versus aboveground respiration and in the contributions of different functional groups in the net carbon exchange of three important arctic-alpine community types, with implications for changes in carbon dynamics as these systems respond to environmental change.
Introduction
Climate change is expected to result in changes in functional group composition in terrestrial ecosystems (Condit, Hubbell, and Foster Citation1996; Diaz and Cabido Citation1997). In arctic regions, where warming has been greatest, shrub cover is expanding at the expense of other functional groups (Myers-Smith et al. Citation2011). These changes may be accompanied by changes in ecosystem processes, including nutrient cycling and carbon (C) fluxes and storage (Sørensen et al. Citation2018b), as well as effects on energy balance via boundary layer, sensible heat exchange, albedo, and snow cover, which may then feed back on global temperature and precipitation patterns (Dormann and Woodin Citation2002; Cornelissen et al. Citation2007; De Deyn, Cornelissen, and Bardgett Citation2008; Chapin et al. Citation2009; Wookey et al. Citation2009).
Arctic and alpine ecosystems cover about eleven million square kilometers, or 2 percent, of the Earth’s land surface, with about five million square kilometers in arctic tundra, three million square kilometers in alpine tundra, and the remainder in intermediate northern highlands (Virtanen et al. Citation2016). They are critical reservoirs in the global C cycle, with as much as 50 percent of the global belowground C pool stored in organic soils and deeper organic deposits in permafrost regions alone (Tarnocai et al. Citation2009).
On a global scale, gross and net photosynthesis in arctic-alpine ecosystems is generally low primarily because of low temperatures (Christensen et al. Citation2000; Grogan and Chapin Citation2000; Biasi et al. Citation2008; Beer et al. Citation2010; Parker, Subke, and Wookey Citation2015; Sørensen et al. Citation2018b). Low temperature, often combined with water-saturated surface conditions that are the result of topography or permafrost, also strongly limits decomposition and ecosystem respiration, resulting in a net influx and long-term net C accumulation in organic soils. Shifts in the balance between C uptake and respiration in these systems could result in a strong positive feedback on global warming, and there is evidence that this is already happening (Oechel et al. Citation2000; Wilmking, Harden, and Tape Citation2006; Hartley et al. Citation2012; Parker, Subke, and Wookey Citation2015)
A more detailed understanding of how respiration is divided among these sources in different communities and among functional groups will help us understand and predict the effects of vegetation changes on C balance in arctic-alpine ecosystems.
Plants in arctic and northern alpine ecosystems are often grouped into plant functional groups based on growth form and functional traits (Chapin et al. Citation1996; Dormann and Woodin Citation2002). Species in these groups are assembled into an array of community types, occurring on sites with different microclimate and soil conditions. The dynamics of C exchange, sequestration, and mineralization vary among the functional groups and communities composed of them, with relatively high productivity and C turnover in predominantly herbaceous communities as compared to the slower-growing and slower-decomposing evergreen shrubs and bryophytes (Cornelissen et al. Citation2007; Lang et al. Citation2009; Ward et al. Citation2009; Parker, Subke, and Wookey Citation2015). Shifts in functional group composition, such as the recent and ongoing increases in the dominance of deciduous shrubs in arctic-alpine regions (Tape, Sturm, and Racine Citation2006; Cannone, Sgorbati, and Guglielmin Citation2007; Tommervik et al. Citation2009; Myers-Smith et al. Citation2011; Epstein et al. Citation2012; McManus et al. Citation2012), may be an important factor in changes in C balance (De Deyn, Cornelissen, and Bardgett Citation2008; Wookey et al. Citation2009).
Numerous studies in arctic-alpine ecosystems have explored the dynamics of C exchange at leaf level (e.g., Johnson and Tieszen Citation1976; Oberbauer and Oechel Citation1989; Muraoka et al. Citation2008) or in whole communities (e.g., Grogan and Chapin Citation2000; Biasi et al. Citation2008; Parker, Subke, and Wookey Citation2015; Virkkala et al. Citation2018; Sørensen et al. Citation2018b), but relatively little is known about the middle ground: the relative contributions of the different functional groups to total ecosystem fluxes. Scaling up from leaf-level measurements can introduce large errors, while whole-system exchange measurements do not yield information on functional group contributions. This gap can be filled by the direct measurement of canopy fluxes following the experimental manipulation of community composition. For example, Ward et al. (Citation2009) experimentally removed each of the three dominant functional groups in a temperate, ombrotrophic peatland throughout two years and found that the removal of dwarf shrubs resulted in dramatic increases in CO2 fluxes and turnover. Douma et al. (Citation2007) measured gas exchange both before and after the removal of vascular plants in several arctic community types in plots selected for high bryophyte ground cover and found that bryophytes accounted for a mean of 60 percent of net ecosystem exchange (NEE). To our knowledge, these are the only previous studies that have used this approach.
Some studies indicate that variation in respiration rather than primary productivity more strongly affects net C balance in arctic and boreal ecosystems (Jung et al. Citation2011). Ecosystem respiration is the sum of respiration by leaves, stems, and other aboveground plant parts and belowground activity of plant roots and soil microorganisms. Partitioning of gas exchange by functional group and aboveground and belowground contributions can be used to inform large-scale C dynamic models and help resolve questions about, for example, the net effect of well-documented increases in deciduous shrub dominance (Tape, Sturm, and Racine Citation2006; Cannone, Sgorbati, and Guglielmin Citation2007; Tommervik et al. Citation2009; Myers-Smith et al. Citation2011; Epstein et al. Citation2012; McManus et al. Citation2012).
To provide baseline data on the contributions of deciduous shrubs and other functional groups on C balance in arctic-alpine ecosystems, we used a sequential harvest method to estimate the aboveground contributions of plant functional groups and belowground respiration to ecosystem respiration (ER), NEE, and gross photosynthesis (GP) in heath, meadow, and Salix shrub communities in the Dovre Mountains of central Norway. We focused on the following questions: (1) What are the relative contributions of belowground and aboveground biotic processes to ecosystem respiration in arctic-alpine plant communities? and (2) What are the relative contributions of the major functional groups, including cryptogams, to ER, NEE, and GP in these communities? In addition, we discuss how changes in functional group composition may affect C source-sink activity as arctic-alpine ecosystems respond to environmental change with an increased abundance of deciduous shrubs.
Materials and methods
Study site
Measurements were made in conjunction with a long-term experiment on the effects of grazing and shrub expansion on alpine community composition and C balance (Sørensen et al. Citation2018a, Citation2018b). The Dovre Mountains in Norway are a high plateau with moderate, rolling relief. We selected study sites on south-facing slopes with representative examples of heath-, herbaceous-, and Salix-dominated communities, designated heath, meadow, and shrub (Figure S1). For further details about the study site and community composition, as well as C pools in the soil and vegetation, see Sørensen et al. (Citation2018a, Citation2018b). We analyzed six plots within each community. Before harvest, functional group cover and plant height were measured using the point intercept method (Jonasson Citation1988) during the second and third weeks of July 2015.
Gas-exchange measurements were conducted on nine working days during the height of the growing season between July 17 and August 13, 2015. For logistic reasons all the plots in each of the three communities were measured during a period of two to four days. While none of the measurements were made in rain or wet conditions, there was variation in cloud cover and temperature, resulting in variation in environmental conditions at community, plot, and functional group levels ().
Table 1. Environmental conditions during CO2 flux measurement in 2015. Mean ± SD, n = 6 plots in each community.
Gas-exchange measurements and harvest
For sequential harvest measurements in the shrub community, we used a collapsible 0.5 × 0.5 × 0.6 m gas flux chamber (Sørensen et al. Citation2018b). In the heath and the meadow we used a 0.25 × 0.25 × 0.30 m closed-system Plexiglas chamber with a rubber skirt attached to the base. The chamber skirts were held down and sealed by a length of chain during each measurement. A sampling tube and a return tube entered the center of the chamber roof and sampled 0.2 m above the soil surface. A fan mixed the air inside the chamber 30 s prior to and during each measurement. Air temperature was measured with a PT100 sensor inside the chamber at a height of 0.2 m above the soil surface, and by a second sensor outside the chamber. Soil temperature was measured at a depth of 8 cm (digital dial thermometer, Traceable® Ultra™, VWR International). During all flux measurements, photosynthetically active radiation (PAR) was measured with a LI-190S quantum sensor (LI-COR Inc., Lincoln, Nebraska, USA) placed within a distance of 1 m from the plexiglass chamber. In the collapsible gas flux chamber, the light sensor was placed 0.2 m from the chamber leg and 0.45 m above the soil surface. After measurement under available light conditions (NEE), the chamber was lifted for at least 30 s to allow ambient air in, and was then darkened with an opaque hood for the measurement of dark respiration (ER). In both the light and the dark, CO2 concentration was recorded every second for 120 s, including a 30–60 s acclimation period. Carbon dioxide fluxes were calculated by linear regression (Jasoni, Smith, and Arnone Citation2005), based on the last 60–90 s (best linear fit according to R2) of the measurement period, and are expressed on a plot surface area basis in μmol m−2 s−1.
After the initial C flux measurements, the first vegetation compartment was harvested by cutting plants at the base without taking up roots and soil. This was followed by another pair of C flux measurements, and this procedure continued until all the vegetation compartments were harvested (Figure S2). The vegetation functional groups were harvested in the following order: (1) dwarf shrubs (evergreen shrubs and the deciduous shrubs Vaccinium uliginosum, V. myrtilis, Salix herbacea, and S. reticulatum), (2) herbs (graminoids, forbs, and seedless vascular plants), (3) cryptogams (bryophytes and lichens), (4) deciduous erect shrubs (Betula nana, Salix lapponum, S. glauca), and (5) litter (identifiable dead leaves, stems, and thalli). Bryophytes and lichens were cut at the soil surface and any litter lying on top of the cryptogam layer was removed at the same time and saved as litter. In our plots, the soil surface was identified as a transition from loose cryptogam thalli or plant litter to a compact surface bound together by living plant roots; there was not a gradual transition, as found in Sphagnum-covered or similar soils. Finally, a measurement was conducted on the bare soil, including organic horizons, in both the light and the dark, to obtain respiration rate from the soil. The sequential harvest was typically completed in 4–6 h on a single day, but was interrupted by 1–2 d in five plots because of adverse weather conditions.
Carbon-flux measurements were also made on four other plots of the same block, and light curve measurements were done on the control plot for each block during the growing season. One light curve measurement consisted of one measurement in full light, measurements at three increasing levels of shading, and one measurement in full darkness (Williams et al. Citation2006; Street et al. Citation2007). The shading was done with three layers of black tulle.
To correct minor errors in identifying and sorting plant material during harvest, it was resorted in the lab before drying and weighing for biomass determination, and bryophytes were separated into mosses and lichens and herbaceous plants into forbs and graminoids. The biomass was oven dried at 70°C for 72 h before weighing to an accuracy of 0.001 g. After drying, deciduous shrubs were sorted into stems and leaves.
Data analysis
Net respiration is expressed as a negative value and net photosynthesis is positive. In principle, removal of a vegetation compartment should result in reduced respiration as measured in the dark, and reduced net photosynthesis in the light, because vegetation contributes to both processes. Subtracting the ER and NEE measurements after removal of a compartment from those made before removal gives a raw estimate of the contribution of the removed compartment to the total measured at the outset. However, this was not always the case, so we made adjustments to the raw data, as described further on, to compensate for some of these anomalous results as well as for variations in light and temperature during measurement.
We modified the data and calculated estimates of gas exchange for the functional group layers in the following steps:
Inspection of the raw data for each plot showed unexpected increases in respiration after removal of cryptogams or herbaceous plants in two heath, two meadow, and four shrub plots (Figure S3). Because of the sequential harvest subtraction algorithm, these measurements affect gas-exchange estimates for both the removed and the subsequent layer. To provide better estimates for the latter, we replaced these anomalous values with the mean of the measurements on either side. This method was also applied to a single case where removal of the evergreen layer in a shrub plot was followed by a large increase in NEE. In two plots in the meadow, ER was greater after removal of all biomass than in the intact vegetation (Figure S3). Other than the temperature correction described further on, we did not attempt to correct for this anomaly.
There was little difference in ER or NEE before and after removal of the litter layer or in light and dark (Figure S3). We used the mean of these four measurements as a robust estimate of belowground respiration and the mean soil temperatures for these four measurements as the reference temperature for this initial estimate of belowground respiration.
In cases where the amount of biomass removed in a layer was less than 5 g m−2 we used the mean of the values before and after removal to provide a more robust estimate of gas exchange before removal of the next layer. We then set all gas-exchange estimates for the low biomass layer to 0, but included these null estimates in the calculation of community means.
Because temperature has a direct effect on respiration and varied between about 5°C and 10°C in the soil and 10°C and 25°C in the canopy during measurement of different blocks (), we used an assumed Q10 of 2 (Tjoelker et al Citation2001) to adjust belowground respiration estimates to a common temperature of 10°C and plant canopy respiration measurements to 20°C, the approximate average soil and aboveground temperatures across all three communities in 2015, respectively. The mean value calculated in step 2 gives a straightforward estimate of soil respiration. Temperature-corrected estimates of belowground respiration at the soil temperature during measurement of each layer (RTbelow) and at the common soil temperature (R10below) were calculated using the Q10 formula:
where Radj is RTbelow or R10below, Rbelow is the measured ER for bare soil, and Tsoil is the respective soil temperature.
RTbelow for each harvest step was subtracted from the corresponding ER measurement to give an estimate of respiration due to plants only (Rabove). For each layer, Rabove after removal was subtracted from that before removal to give an estimate of aboveground respiration attributed to each functional group. Using the air temperature in the chamber and the Q10 equation, these estimates were then adjusted to 20°C, designated Rdec, Reve, Rher, and Rcry for deciduous shrubs, evergreen and dwarf shrubs, graminoids and other herbaceous plants, and cryptogams, respectively.
As described earlier, a raw estimate of NEE for each layer was obtained by subtracting the NEE after layer removal from that of before layer removal. Layer NEE – Layer R gives an initial estimate of layer GP. Photosynthetically active radiation during NEE measurements varied between about 200 μmol and 1,700 μmol m−2 s−1 (). To correct GP for these variations, a single light response curve was fitted to data for eight control plots in each community using nls functions in R:
Where GP = NEE – R, I = incident PAR (μmol m−2s−1), Pmax = rate of light saturated photosynthesis, and k = half saturated constant of photosynthesis.The expected community GP at 600 μmol m−2 s−1 and at the measurement PAR for each layer were calculated, and the ratio of these was used as a correction factor. Gross photosynthesis estimates were corrected for temperature using a Q10 of 2 and then multiplied by the correction factor to give an estimate of layer GP at 20°C and 600 μmol m−2 s−1 PAR.
The temperature and light-corrected estimates of ER and GP were summed to give a revised estimate of NEE for each layer.
All gas-exchange estimates that were obtained after data modification and temperature adjustment are designated “adjusted,” while those obtained from the original data are designated “raw.” Although the adjustments were minor, we present summaries of both to show that the data are robust to these alterations.
The productivity per biomass for each functional group in each community was calculated as GP/biomass, using leaf biomass only for deciduous shrubs and total biomass for the other functional groups.
We tested for differences among communities in raw and adjusted ER, NEE, and GP using one-way ANOVA and Tukey’s HSD. All data processing and analysis was carried out in R (R Core Team Citation2017).
Results
Overall ecosystem fluxes
As in our previous study (Sørensen et al. Citation2018b), pre-harvest rates of NEE and initial estimates of GP differed significantly among communities (; NEE: F2,15 = 4.77; GP: F2,15 = 3.8, p < 0.05, ANOVA). Net ecosystem exchange in the shrub community was significantly higher (p < 0.05) than in the heath community, and marginally higher (p = 0.06, TukeyHSD) than in the meadow community. However, pairwise comparisons were not significantly different for initial estimates of GP, because values were only marginally higher in the shrub community than in the other two communities (p < 0.10, TukeyHSD) (). Raw ER did not differ significantly among communities (F2,15 = 1.85, p = 0.19, ANOVA). Because of increased variability in NEE and GP after adjustment (), there were no significant differences among communities in adjusted ER, NEE, and GP. The adjusted data suggest that gross photosynthesis and net exchange in the meadow may be intermediate—lower than in the shrub community and higher than in the heath community.
Table 2. Partitioning of growing season daytime ecosystem respiration (ER) and gross photosynthesis (GP) into aboveground and belowground respiration (R) and net ecosystem exchange (NEE) in three arctic-alpine communities, expressed as mean CO2 flux (μmol m−2 s−1) and as mean proportion of ER (%ER) or GP (%GP), based on adjusted estimates (n = 6).
Figure 1. Total CO2 fluxes in three arctic-alpine plant communities calculated from raw measurements and after adjustment for anomalous measurements and differences in temperature and light conditions during measurement. Mean ± standard deviation of six plots per community.
Based on the pre-harvest measurements of NEE and ER, the mean proportion of GP consumed by ER was approximately 73 percent in the heath, 66 percent in the meadow, and 55 percent in the shrub community. In the adjusted estimates for common temperature and light conditions, these become 78 percent, 46 percent, and 49 percent, respectively (). The differences between these estimates are largely a result of adjustments for excess respiration after removal of herb or cryptogam layers in several plots (Figure S3). The effects of adjustments for temperature and light are relatively minor.
Based on the adjusted estimates, aboveground respiration contributed approximately 37 percent, 13 percent, and 60 percent of total ER in the heath, meadow, and shrub communities, respectively, with the remainder as belowground respiration (). In the heath and meadow communities, most of the aboveground respiration was attributed to the respective dominant functional group, while in the shrub community aboveground respiration was more evenly divided among all four functional groups. In the heath and meadow, belowground respiration consumed approximately 49 percent and 41 percent of GP, respectively, while in the shrub community this was approximately 20 percent. Aboveground respiration consumed approximately 29 percent of GP in the heath and shrub communities and approximately 6 percent of GP in the meadow.
Functional group contributions
Plant contributions to ER, NEE, and GP were dominated by the respective dominant functional group in each ecosystem (). Non-dominant vascular plant functional groups contributed proportionally more to gas exchange in the shrub community than in the heath and meadow (approximately 30 percent versus 10 percent and 14 percent of plant NEE, respectively). The adjustments to the data did not affect this general picture (Figure S4), with the exception of a reduction in NEE and GP in deciduous shrubs in the shrub community, which was a result of the correction for the strong increase in efflux after the removal of cryptogams in four of the six shrub plots (Figure S3).
Figure 2. a–c: Adjusted soil and functional group contributions to ecosystem CO2 fluxes in three arctic-alpine plant communities based on sequential harvest and closed-system measurements in light and dark after removal of each functional group. d: Functional group biomass, with deciduous and dwarf shrub leaf and woody stem biomass separated and herbaceous plants and cryptogams divided into subgroups. Means of six plots per community, including null values for plots where a functional group was absent.
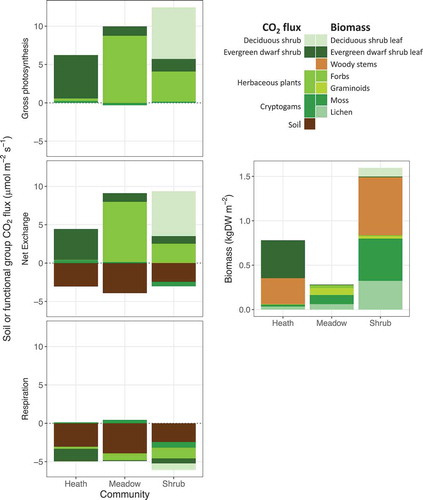
Because our data adjustments involved changing the flux estimates after the removal of cryptogams in several plots, we do not think the adjusted estimates for cryptogams in are reliable. However, the raw NEE results indicate a minimal contribution of cryptogams to overall gas exchange, even though they comprise a large proportion of total biomass in the meadow and shrub communities. Mean cryptogam NEE was negative (net efflux) in the raw data for the meadow and shrub communities (Figure S4).
Most of the deciduous shrub (willow) biomass and a substantial proportion of dwarf shrub biomass were in woody parts (d). Using the GP estimates and biomass data, we calculated productivity as μmol CO2 fixed per dry weight of leaf tissue for all functional groups present in the three communities. Estimates based on only a few grams of leaf tissue were highly variable, presumably because of error propagation based on the very small amounts of tissue. The estimates (in μmol kgDW−1 ± SD) for the dominant functional group in each community are as follows: 13.6 ± 5.2 for dwarf shrub leaves in the heath; 83.6 ± 28.8 for herbaceous plants in the meadow, and 71.0 ± 33.4 for deciduous leaves in the shrub community.
Discussion
This study confirms that the NEE of shrub communities is higher than that of heaths and meadows in alpine ecosystems. The respiration from the three communities did not differ significantly but far more of the respiration in the shrubs came from aboveground compartments and not from the belowground pool as we had expected (Sørensen et al. Citation2018b). Although cryptogams may comprise a high proportion of ground cover, our data do not suggest that they are major contributors to the carbon budget of any of the three communities. The herbaceous vegetation turned out to be very efficient in capturing C without losing much to total or especially aboveground respiration. Comparison of soil and aboveground carbon pools suggests that shrub invasion of heath or meadow communities could result in a net loss of soil C that exceeds aboveground biomass gains, resulting in a long-term net loss of C that could aggravate global warming (Sørensen et al. Citation2018b).
The pre-harvest rates of ER, NEE, and GP are within the broad range defined by previous studies of diurnal growing season CO2 fluxes in arctic-alpine ecosystems (Johnson et al. Citation2000; Shaver et al. Citation2007; Street et al. Citation2007; Nobrega and Grogan Citation2008). In these studies, Betula- or Salix-dominated deciduous shrub communities are most productive with NEE at approximately 10 μmol m−2 s−1, moist sedge meadows are intermediate at about 8 μmol m−2 s−1, and heaths are on par with or sometimes considerably lower than the meadows depending on type and perhaps moisture status (Shaver et al. Citation2007; Susiluoto et al. Citation2008). Fluxes modeled or integrated during longer periods, from days to full seasons via small-scale closed-chamber methods or eddy covariance, are from one to two orders of magnitude lower when expressed in μmol m−2 s−1, with some sites showing a net loss of C to the atmosphere during a growing season or year (Jones et al. Citation1998; Natali et al. Citation2011; Kittler et al. Citation2017).
Under growing season daytime conditions, in moderate light and at average summer temperatures, more than 75 percent of photosynthesis in the heath was consumed by ER, while this is more on the order of 45–50 percent in the meadow and shrub communities (). The remaining proportions as represented by NEE are available for growth, reproduction, storage, or respiratory consumption. Respiratory losses were dominated by belowground processes in the heath and meadow, while aboveground layers consumed a greater proportion of GP in the willow shrub community. Because respiration continues in low light and during night hours, 24 h and longer-term respiratory losses are likely much greater, with the possibility that any of the three systems may be net C sources on an annual basis.
The respective dominant functional group in each community dominates aboveground ecosystem exchanges. In the heath and meadow the nondominant vascular plant groups accounted for less than 10 percent of total ER. However, in the shrub community, the nondominant herbs and dwarf shrubs together accounted for roughly 40 percent and 45 percent of NEE and GP, respectively, but approximately 56 percent of aboveground respiration and 34 percent of total ER (), and thus have a disproportionate role in overall respiratory losses in this system.
Despite lower productivity than vascular plants, bryophytes and lichens are important components of boreal and arctic ecosystems. Explicit consideration of cryptogam fluxes may help improve the accuracy of regional and global models of GP and NEE (Yuan et al. Citation2014). Miller, Webber, and Oechel (Citation1980) reported that cryptogams contribute an average of approximately 30 percent of total NEE across a broad range of arctic community types at Barrow, Alaska, ranging from less than 5 percent in a Dupontia meadow to 48 percent in a Carex-Poa meadow. Despite the problems arising from unexpected efflux after cryptogam removal, our results indicate that cryptogams are minor players in overall C fluxes in our communities, presumably because of intrinsically low productivity (Frolking Citation1997; Goulden and Crill Citation1997).
The large increases in CO2 efflux after ground-cover removal may be the result of rapid responses to disturbance at the soil surface. We were careful to minimize perturbation of the soil surface during removal of ground cover and litter layers but cannot rule out that aeration of the soil surface may stimulate respiration even in the short term. Alternatively, the increased efflux may indicate a so-called lid effect, involving the release of belowground CO2. In an experiment involving removal of all vascular plants in a single step, Douma et al. (Citation2007) found that mosses may account for an average of 60 percent of NEE in a range of heath, meadow, and deciduous shrub (Betula nana) dominated plots, all selected for nearly 100 percent moss cover at ground level. They attributed the increases in efflux after removal of vascular plants to “wound respiration,” and consequently based their estimates of moss productivity on changes in GP rather than NEE after vascular plant removal. In our study, increases in efflux occurred mainly after removal of cryptogams, or in some cases graminoids, rather than other vascular plant layers, and so cannot be attributed to respiration from cut stems or roots, at least in the former case. Possible reasons for the lid effect include soil disturbance, reduced resistance to efflux from the soil surface, and reduced photosynthetic absorption (“recycling”) of soil-derived CO2 by dense vascular or cryptogam ground layers (Smolders et al. Citation2001). The latter process is an intriguing possibility. Uptake of soil-derived CO2 would not be reflected in NEE measurements, but would result in higher cryptogam biomass productivity than predicted from in situ estimates of cryptogam NEE. This could be resolved by repeated, season-long measurement and integration of NEE and biomass accumulation. It would also be of interest to measure CO2 concentrations within the cryptogam layer.
Estimates of GP per leaf mass for the dominant functional group in each community show that gross CO2 uptake per leaf mass was highest for herbaceous plants, intermediate for deciduous shrubs, and least for dwarf shrubs. This corresponds to expectations based on community weighted means of specific leaf area, which were highest in the meadow, intermediate in the shrub community, and lowest in the heath community (Sørensen et al. in review). This overall fit with the leaf economic spectrum (Reich, Walters, and Ellsworth Citation1997; Wright et al. Citation2004) confirms that the use of functional groups based on growth form can be useful in relation to C studies and potentially for future predictions, as was suggested by Chapin et al. (Citation1996). Future studies could measure the temperature responses of C fluxes in the specific groups to predict responses to future climate change (Dormann and Woodin Citation2002; Dorrepaal Citation2007). A preliminary study of leaf-level temperature responses at our sites showed decreases in net photosynthesis at temperatures higher than 17°C in three Salix species: Betula nana, Empetrum nigrum, and Vaccinium vitis-idaea (Eckert Citation2015).
In this study, we quantified the relative contributions of aboveground and belowground processes and of the main functional groups in three alpine plant communities. To the extent that our sites are representative of other arctic-alpine community types, our results illustrate the differing roles of the main arctic-alpine plant functional groups in growing season carbon dynamics. Other studies indicate that the ongoing expansion of deciduous shrubs into heath- and graminoid-dominated communities in arctic-alpine regions may already be altering source-sink relations in these regions (Oechel et al. Citation2000; Wilmking, Harden, and Tape Citation2006; Hartley et al. Citation2012; Parker, Subke, and Wookey Citation2015). Our measurements show higher rates of daytime growing season NEE in the shrub community than in the other two community types, attributable largely to the more productive deciduous shrubs and herbaceous plants, which would suggest higher long-term rates of sequestration. However, the shrub community has less total ecosystem C because of lower organic soil C pools in the shrub than in the heath and meadow (Sørensen et al. Citation2018b), suggesting that there could be a long-term net loss of soil and total C as a consequence of shrub expansion, likely the result of soil respiration continuing during winter or periods of low productivity. Seasonal data from arctic ecosystems suggests that winter fluxes may comprise 30–50 percent of total annual belowground respiration (Grogan and Chapin Citation1999) and may be strongly affected by warming (Mikan, Schimel, and Doyle Citation2002). While GP and aboveground respiration are seasonal and strongly affected by variation in air temperature, belowground respiration continues year-round, where temperatures are buffered by vegetation and snow and are higher in winter in the shrub than heath or meadow communities (Sørensen et al. Citation2018a). Differences in root density and soil microbial communities among the three communities and as affected by functional group composition may also contribute to source-sink relations outside of the growing season in these regions. More detailed studies of functional group effects on winter fluxes, microbes, and soil processes, including further exploration of the lid effect, will help to clarify the effects of functional group changes on C cycling and sequestration in arctic-alpine ecosystems.
Supplemental Material
Download Zip (22.7 MB)Acknowledgments
We thank the field team in ECOSHRUB (https://www.ntnu.edu/biology/research/ecology/graae-lab/ecoshrub) for assisting with sampling (Astrid Raunsgaard, Andreas Baele, Pieter de Frenne, Lisa Sandal, Montserrat Badia, Øystein Opedal, Thomas Vanneste) and the Norsk Villreinsenter for logistical support. We also thank Brian J. Enquist and his lab for useful discussions on methodology and The Norwegian Research Council, Norklima project No 230606/E10, for support. Finally, we thank two anonymous reviewers and the editor for valuable comments on the manuscript.
Disclosure statement
No potential conflict of interest was reported by the authors.
Supplemental material
Supplemental data for this article can be accessed here.
Related Research Data
References
- Beer, C., M. Reichstein, E. Tomelleri, P. Ciais, M. Jung, N. Carvalhais, C. Rodenbeck, M. A. Arain, D. Baldocchi, G. B. Bonan, et al. 2010. Terrestrial gross carbon dioxide uptake: Global distribution and covariation with climate. Science 329 (5993):834–38. doi:10.1126/science.1184984.
- Biasi, C., H. Meyer, O. Rusalimova, R. Haemmerle, C. Kaiser, C. Baranyi, H. Daims, N. Lashchinsky, P. Barsukov, and A. Richter. 2008. Initial effects of experimental warming on carbon exchange rates, plant growth and microbial dynamics of a lichen-rich dwarf shrub tundra in Siberia. Plant and Soil 307 (1–2):191–205. doi:10.1007/s11104-008-9596-2.
- Cannone, N., S. Sgorbati, and M. Guglielmin. 2007. Unexpected impacts of climate change on alpine vegetation. Frontiers in Ecology and the Environment 5 (7):360–64. doi:10.1890/1540-9295(2007)5[360:UIOCCO]2.0.CO;2.
- Chapin, F. S., J. McFarland, A. D. McGuire, E. S. Euskirchen, R. W. Ruess, and K. Kielland. 2009. The changing global carbon cycle: Linking plant-soil carbon dynamics to global consequences. Journal of Ecology 97 (5):840–50. doi:10.1111/jec.2009.97.issue-5.
- Chapin, F. S., M. S. BretHarte, S. E. Hobbie, and H. L. Zhong. 1996. Plant functional types as predictors of transient responses of arctic vegetation to global change. Journal of Vegetation Science 7 (3):347–58. doi:10.2307/3236278.
- Christensen, T. R., T. Friborg, M. Sommerkorn, J. Kaplan, L. Illeris, H. Soegaard, C. Nordstroem, and S. Jonasson. 2000. Trace gas exchange in a high-arctic valley 1. Variations in CO2 and CH4 flux between tundra vegetation types. Global Biogeochemical Cycles 14 (3):701–13. doi:10.1029/1999GB001134.
- Condit, R., S. P. Hubbell, and R. B. Foster. 1996. Assessing the response of plant functional types to climatic change in tropical forests. Journal of Vegetation Science 7 (3):405–16. doi:10.2307/3236284.
- Cornelissen, J. H. C., P. M. van Bodegom, R. Aerts, T. V. Callaghan, R. S. P. van Logtestijn, J. Alatalo, F. S. Chapin, R. Gerdol, J. Gudmundsson, D. Gwynn-Jones, et al. 2007. Global negative vegetation feedback to climate warming responses of leaf litter decomposition rates in cold biomes. Ecology Letters 10 (7):619–27. doi:10.1111/j.1461-0248.2007.01051.x.
- De Deyn, G. B., J. H. C. Cornelissen, and R. D. Bardgett. 2008. Plant functional traits and soil carbon sequestration in contrasting biomes. Ecology Letters 11 (5):516–31. doi:10.1111/j.1461-0248.2008.01164.x.
- Diaz, S., and M. Cabido. 1997. Plant functional types and ecosystem function in relation to global change. Journal of Vegetation Science 8 (4):463–74. doi:10.2307/3237198.
- Dormann, C. F., and S. J. Woodin. 2002. Climate change in the Arctic: Using plant functional types in a meta-analysis of field experiments. Functional Ecology 16 (1):4–17. doi:10.1046/j.0269-8463.2001.00596.x.
- Dorrepaal, E. 2007. Are plant growth-form-based classifications useful in predicting northern ecosystem carbon cycling feedbacks to climate change? Journal of Ecology 95 (6):1167–80. doi:10.1111/jec.2007.95.issue-6.
- Douma, J. C., M. T. van Wijk, S. I. Lang, and G. R. Shaver. 2007. The contribution of mosses to the carbon and water exchange of arctic ecosystems: Quantification and relationships with system properties. Plant Cell and Environment 30 (10):1205–15. doi:10.1111/j.1365-3040.2007.01697.x.
- Eckert, D. 2015. Photosynthetic response to temperature — A comparison between prostrate and erect alpine shrubs. Trondheim, Norway: Department of Biology, Norwegian University of Science and Technology.
- Epstein, H. E., M. K. Raynolds, D. A. Walker, U. S. Bhatt, C. J. Tucker, and J. E. Pinzon. 2012. Dynamics of aboveground phytomass of the circumpolar Arctic tundra during the past three decades. Environmental Research Letters 7:1. doi:10.1088/1748-9326/7/1/015506.
- Frolking, S. 1997. Sensitivity of spruce/moss boreal forest net ecosystem productivity to seasonal anomalies in weather. Journal of Geophysical Research: Atmospheres 102 (D24):29053–64. doi:10.1029/96JD03707.
- Goulden, M. L., and P. M. Crill. 1997. Automated measurements of CO2 exchange at the moss surface of a black spruce forest. Tree Physiology 17 (8–9):537–42.
- Grogan, P., and F. S. Chapin. 1999. Arctic soil respiration: Effects of climate and vegetation depend on season. Ecosystems 2 (5):451–59. doi:10.1007/s100219900093.
- Grogan, P., and F. S. Chapin. 2000. Initial effects of experimental warming on above- and belowground components of net ecosystem CO2 exchange in arctic tundra. Oecologia 125 (4):512–20. doi:10.1007/s004420000490.
- Hartley, I. P., M. H. Garnett, M. Sommerkorn, D. W. Hopkins, B. J. Fletcher, V. L. Sloan, G. K. Phoenix, and P. A. Wookey. 2012. A potential loss of carbon associated with greater plant growth in the European Arctic. Nature Climate Change 2 (12):875–79. doi:10.1038/nclimate1575.
- Jasoni, R. L., S. D. Smith, and J. A. Arnone. 2005. Net ecosystem CO2 exchange in Mojave Desert shrublands during the eighth year of exposure to elevated CO2. Global Change Biology 11 (5):749–56. doi:10.1111/gcb.2005.11.issue-5.
- Johnson, D. A., and L. L. Tieszen. 1976. Aboveground biomass allocation, leaf growth, and photosynthesis patterns in tundra plant forms in Arctic Alaska. Oecologia 24 (2):159–73. doi:10.1007/BF00572757.
- Johnson, L. C., G. R. Shaver, D. H. Cades, E. Rastetter, K. Nadelhoffer, A. Giblin, J. Laundre, and A. Stanley. 2000. Plant carbon-nutrient interactions control CO2 exchange in Alaskan wet sedge tundra ecosystems. Ecology 81 (2):453–69.
- Jonasson, S. 1988. Evaluation of the point intercept method for the estimation of plant biomass. Oikos 52 (1):101–06. doi:10.2307/3565988.
- Jones, M. H., J. T. Fahnestock, D. A. Walker, M. D. Walker, and J. M. Welker. 1998. Carbon dioxide fluxes in moist and dry arctic tundra during season: Responses to increases in summer temperature and winter snow accumulation. Arctic and Alpine Research 30 (4):373–80. doi:10.2307/1552009.
- Jung, M., M. Reichstein, H. A. Margolis, A. Cescatti, A. D. Richardson, M. A. Arain, A. Arneth, C. Bernhofer, D. Bonal, J. Q. Chen, et al. 2011. Global patterns of land-atmosphere fluxes of carbon dioxide, latent heat, and sensible heat derived from eddy covariance, satellite, and meteorological observations. Journal of Geophysical Research: Biogeosciences 116:G(3). doi:10.1029/2010JG001566.
- Kittler, F., W. Eugster, T. Foken, M. Heimann, O. Kolle, and M. Goeckede. 2017. High-quality eddy-covariance CO2 budgets under cold climate conditions. Journal of Geophysical Research: Biogeosciences 122 (8):2064–84.
- Lang, S. I., J. H. C. Cornelissen, T. Klahn, R. S. P. van Logtestijn, R. Broekman, W. Schweikert, and R. Aerts. 2009. An experimental comparison of chemical traits and litter decomposition rates in a diverse range of subarctic bryophyte, lichen and vascular plant species. Journal of Ecology 97 (5):886–900. doi:10.1111/j.1365-2745.2009.01538.x.
- McManus, K. M., D. C. Morton, J. G. Masek, D. D. Wang, J. O. Sexton, J. R. Nagol, P. Ropars, and S. Boudreau. 2012. Satellite-based evidence for shrub and graminoid tundra expansion in northern Quebec from 1986 to 2010. Global Change Biology 18 (7):2313–23. doi:10.1111/j.1365-2486.2012.02708.x.
- Mikan, C. J., J. P. Schimel, and A. P. Doyle. 2002. Temperature controls of microbial respiration in arctic tundra soils above and below freezing. Soil Biology & Biochemistry 34 (11):1785–95. doi:10.1016/S0038-0717(02)00168-2.
- Miller, P. C., P. J. Webber, and W. C. Oechel. 1980. Biophysical processes and primary production. In An Arctic ecosystem: The coastal tundra at Barrow, Alaska, ed. J. Brown., P. C. Miller, and L. L. Tieszen, 66–101. Strudsberg, PA: Dowden, Hamilton, and Ross, Inc.
- Muraoka, H., H. Noda, M. Uchida, T. Ohtsuka, H. Koizumi, and T. Nakatsubo. 2008. Photosynthetic characteristics and biomass distribution of the dominant vascular plant species in a high Arctic tundra ecosystem, Ny-Ålesund, Svalbard: Implications for their role in ecosystem carbon gain. Journal of Plant Research 121 (2):137–45. doi:10.1007/s10265-007-0134-8.
- Myers-Smith, I. H., B. C. Forbes, M. Wilmking, M. Hallinger, T. Lantz, D. Blok, K. D. Tape, M. Macias-Fauria, U. Sass-Klaassen, E. Levesque, et al. 2011. Shrub expansion in tundra ecosystems: Dynamics, impacts and research priorities. Environmental Research Letters 6:4. doi:10.1088/1748-9326/6/4/045509.
- Natali, S. M., E. A. G. Schuur, C. Trucco, C. E. H. Pries, K. G. Crummer, and A. F. B. Lopez. 2011. Effects of experimental warming of air, soil and permafrost on carbon balance in Alaskan tundra. Global Change Biology 17 (3):1394–407. doi:10.1111/j.1365-2486.2010.02303.x.
- Nobrega, S., and P. Grogan. 2008. Landscape and ecosystem-level controls on net carbon dioxide exchange along a natural moisture gradient in Canadian low arctic tundra. Ecosystems 11 (3):377–96. doi:10.1007/s10021-008-9128-1.
- Oberbauer, S. F., and W. C. Oechel. 1989. Maximum Co-2-assimilation rates of vascular plants on an alaskan arctic tundra slope. Holarctic Ecology 12 (3):312–16.
- Oechel, W. C., G. L. Vourlitis, S. J. Hastings, R. C. Zulueta, L. Hinzman, and D. Kane. 2000. Acclimation of ecosystem CO2 exchange in the Alaskan Arctic in response to decadal climate warming. Nature 406 (6799):978–81. doi:10.1038/35023137.
- Parker, T. C., J.-A. Subke, and P. A. Wookey. 2015. Rapid carbon turnover beneath shrub and tree vegetation is associated with low soil carbon stocks at a subarctic treeline. Global Change Biology 21 (5):2070–81. doi:10.1111/gcb.12793.
- R Core Team. 2017. R: A language and environment for statistical computing. Vienna, Austria: R Foundation for Statistical Computing.
- Reich, P. B., M. B. Walters, and D. S. Ellsworth, 1997: From tropics to tundra: Global convergence in plant functioning. Proceedings of the National Academy of Sciences of the United States of America 94:13730–34.
- Shaver, G. R., L. E. Street, E. B. Rastetter, M. T. van Wijk, and M. Williams. 2007. Functional convergence in regulation of net CO2 flux in heterogeneous tundra landscapes in Alaska and Sweden. Journal of Ecology 95 (4):802–17. doi:10.1111/jec.2007.95.issue-4.
- Smolders, A. J. P., H. B. M. Tomassen, H. W. Pijnappel, L. P. M. Lamers, and J. G. M. Roelofs. 2001. Substrate‐derived CO2 is important in the development of Sphagnum spp. New Phytologist 152 (2):325–32. doi:10.1046/j.0028-646X.2001.00261.x.
- Sørensen, M. V., B. J. Graae, D. Hagen, B. J. Enquist, K. O. Nystuen, and R. Strimbeck. 2018a. Experimental herbivore exclusion, shrub introduction, and carbon sequestration in alpine plant communities. BMC Ecology 18:29.
- Sørensen, M. V., R. Strimbeck, K. O. Nystuen, R. E. Kapas, B. J. Enquist, and B. J. Graae. 2018b. Draining the pool? Carbon storage and fluxes in three alpine plant communities. Ecosystems 21 (2):316–30. doi:10.1007/s10021-017-0158-4.
- Street, L. E., G. R. Shaver, M. Williams, and M. T. van Wijk. 2007. What is the relationship between changes in canopy leaf area and changes in photosynthetic CO2 flux in arctic ecosystems? Journal of Ecology 95 (1):139–50. doi:10.1111/jec.2007.95.issue-1.
- Susiluoto, S., T. Rasilo, J. Pumpanen, and F. Berninger. 2008. Effects of grazing on the vegetation structure and carbon dioxide exchange of a Fennoscandian fell ecosystem. Arctic, Antarctic, and Alpine Research 40 (2):422–31. doi:10.1657/1523-0430(07-035)[SUSILUOTO]2.0.CO;2.
- Tape, K., M. Sturm, and C. Racine. 2006. The evidence for shrub expansion in Northern Alaska and the Pan-Arctic. Global Change Biology 12 (4):686–702. doi:10.1111/gcb.2006.12.issue-4.
- Tarnocai, C., J. G. Canadell, E. A. G. Schuur, P. Kuhry, G. Mazhitova, and S. Zimov. 2009. Soil organic carbon pools in the northern circumpolar permafrost region. Global Biogeochemical Cycles 23 (2):GB2023. doi:10.1029/2008GB003327.
- Tjoelker, M. G, J. Oleksyn, and P. B. Reich. 2001. Modelling respiration of vegetation: Evidence for a general temperature-dependent Q(10). Global Change Biology 7:23–230.
- Tommervik, H., B. Johansen, J. A. Riseth, S. R. Karlsen, B. Solberg, and K. A. Hogda. 2009. Above ground biomass changes in the mountain birch forests and mountain heaths of Finnmarksvidda, northern Norway, in the period 1957-2006. Forest Ecology and Management 257 (1):244–57. doi:10.1016/j.foreco.2008.08.038.
- Virkkala, A.-M., T. Virtanen, A. Lehtonen, J. Rinne, and M. Luoto. 2018. The current state of CO2 flux chamber studies in the Arctic tundra: A review. Progress in Physical Geography 42 (2):162–84. doi:10.1177/0309133317745784.
- Virtanen, R., L. Oksanen, T. Oksanen, J. Cohen, B. C. Forbes, B. Johansen, J. Kayhko, J. Olofsson, J. Pulliainen, and H. Tommervik. 2016. Where do the treeless tundra areas of northern highlands fit in the global biome system: Toward an ecologically natural subdivision of the tundra biome. Ecology and Evolution 6 (1):143–58. doi:10.1002/ece3.1837.
- Ward, S. E., R. D. Bardgett, N. P. McNamara, and N. J. Ostle. 2009. Plant functional group identity influences short-term peatland ecosystem carbon flux: Evidence from a plant removal experiment. Functional Ecology 23 (2):454–62. doi:10.1111/fec.2009.23.issue-2.
- Williams, M., L. E. Street, M. T. van Wijk, and G. R. Shaver. 2006. Identifying differences in carbon exchange among arctic ecosystem types. Ecosystems 9 (2):288–304. doi:10.1007/s10021-005-0146-y.
- Wilmking, M., J. Harden, and K. Tape. 2006. Effect of tree line advance on carbon storage in NW Alaska. Journal of Geophysical Research: Biogeosciences 111 (G2):G02023. doi:10.1029/2005JG000074.
- Wookey, P. A., R. Aerts, R. D. Bardgett, F. Baptist, K. A. Brathen, J. H. C. Cornelissen, L. Gough, I. P. Hartley, D. W. Hopkins, S. Lavorel, et al. 2009. Ecosystem feedbacks and cascade processes: Understanding their role in the responses of Arctic and alpine ecosystems to environmental change. Global Change Biology 15 (5):1153–72. doi:10.1111/j.1365-2486.2008.01801.x.
- Wright, I. J., P. B. Reich, M. Westoby, D. D. Ackerly, Z. Baruch, F. Bongers, J. Cavender-Bares, T. Chapin, J. H. C. Cornelissen, M. Diemer, et al. 2004. The worldwide leaf economics spectrum. Nature 428 (6985):821. doi:10.1038/nature02437.
- Yuan, W., S. Liu, W. Dong, S. Liang, S. Zhao, J. Chen, W. Xu, X. Li, A. Barr, T. A. Black, et al. 2014. Differentiating moss from higher plants is critical in studying the carbon cycle of the boreal biome. Nature Communications 5:4270.