
 ?Mathematical formulae have been encoded as MathML and are displayed in this HTML version using MathJax in order to improve their display. Uncheck the box to turn MathJax off. This feature requires Javascript. Click on a formula to zoom.
ABSTRACT
Recent vegetation changes in arctic-alpine tundra ecosystems may affect several ecosystem processes that regulate microbe and soil functions. Such changes can alter ecosystem carbon (C) cycling with positive feedback to the atmosphere if plant C uptake is less than the amount of soil C released. Here, we examine how differences in plant functional traits, microbial activity, and soil processes within and across Salix-dominated shrub, dwarf shrub–dominated heath, and herb- and cryptogam-dominated meadow communities influence C cycling. We develop a hypothesized framework based on a priori model selection of variation in daytime growing season gross ecosystem photosynthesis (GEP) and above- and belowground respiration. The fluxes were standardized to light and temperature.
Gross ecosystem photosynthesis was primarily related to soil moisture and secondarily to plant functional traits and aboveground biomass, and belowground respiration was dependent on the community weighted mean of specific leaf area (SLACWM). Similarly, microbial activity was linked with SLACWM and was highest in meadows, and carbon-degrading microbial activity decreased with vegetation woodiness. These results suggest that shrub expansion may influence summer C cycling differently depending on plant community, as belowground respiration might increase in the heath and decrease in the meadow communities.
Introduction
In response to climate change, fluctuations in herbivory, and human land-use changes, shrub cover is increasing in high-latitude arctic and alpine tundra ecosystems, and the rate of shrub expansion is predicted to increase (Tape, Sturm, and Racine Citation2006; Post and Pedersen Citation2008; Tømmervik et al. Citation2009; Ravolainen et al. Citation2011; Speed et al. Citation2013; Settele et al. Citation2014; Epstein et al. Citation2015; Myers-Smith et al. Citation2015; Martin et al. Citation2017; Normand et al. Citation2017). It is unclear how shrub expansion will affect the carbon balance of these ecosystems (Virkkala et al. Citation2017). While high-latitude tundra ecosystem soils currently store more than half of global soil carbon (C; Tarnocai et al. Citation2009), these systems are predicted to be highly sensitive to climate warming, with the potential for some of the greatest C losses globally (Crowther et al. Citation2016). Plant-microbial-soil feedbacks regulate soil C (Wardle et al. Citation2004; De Deyn, Cornelissen, and Bardgett Citation2008). If shrub expansion leads to more soil C release than plant C uptake, these vegetation changes may alter ecosystem C cycling with potential positive feedback to the atmosphere (Wilmking, Harden, and Tape Citation2006; Cahoon et al. Citation2012; Parker, Subke, and Wookey Citation2015). Understanding the response of C cycling to climate and vegetation changes requires unraveling the influence of plants, microbes, and soil processes on C cycling (Bardgett Citation2011), and these links are largely unknown in tundra ecosystems (Myers-Smith et al. Citation2011).
Arctic and alpine tundra vegetation is a mosaic of plant communities created by variations in microclimate (snow depth, moisture, temperature) and underlying bedrock types that form major gradients in soil pH and soil nutrient availability (Sonesson, Wielgolaski, and Kallio 1975; Eskelinen, Stark, and Männistö Citation2009; Sundqvist et al. Citation2011). Dwarf shrub–dominated heath and herb-dominated meadow are two common tundra communities that are subject to shrub expansion via both colonization and increased canopy dominance (Molau and Alatalo Citation1998; Björk and Molau Citation2007; Cannone, Sgorbati, and Guglielmin Citation2007). In a previous study on alpine tundra vegetation, we found that the soil C stocks in meadow and heath communities were much larger than in a Salix shrub community, even though gross ecosystem photosynthesis (GEP) was similar in the meadow and shrub communities (Sørensen et al. Citation2017).
The balance between the competing processes of photosynthesis and total respiration will determine if an ecosystem is a net carbon absorber or emitter. Net ecosystem exchange of CO2 can be divided into three dynamic processes: GEP, aboveground respiration, and belowground respiration. All of these may be affected by the changes in plant and soil microbial community composition associated with shrub expansion via effects on both the abiotic environment and biotic processes.
Photosynthesis is carried out by vascular plant leaves and cryptogam thalli. Shrub expansion involves increases in leaf biomass and is generally expected to increase primary production (Gould, Raynolds, and Walker Citation2003; Wookey et al. Citation2009; Cahoon et al. Citation2012; Sørensen et al. Citation2017; Michaletz, Kerkhoff, and Enquist Citation2018). Photosynthetic rate may be directly affected by air temperature and soil moisture (Körner Citation2003; Berdanier and Klein Citation2011), which may in turn be affected by changes in community composition via effects on albedo, evapotranspiration, winter snow accumulation, and spring and summer snowmelt (Sturm et al. Citation2001; Grogan and Jonasson Citation2006; Myers-Smith and Hik Citation2013). Photosynthetic rates in leaves are tightly linked to leaf traits, including specific leaf area (SLA) and leaf nitrogen (N) content according to the well-documented leaf economic spectrum (Wright et al. Citation2004). These traits vary among the main functional groups in arctic-alpine ecosystems, with deciduous leaves and graminoids generally having higher rates of photosynthesis, SLA, and leaf nitrogen as compared to evergreen dwarf shrub leaves. The overall trait composition of a community can be summarized using community weighted means (CWM) of the various leaf traits (Grime Citation1998; Lavorel and Garnier Citation2002; Garnier et al. Citation2004; Lavorel Citation2012; Enquist et al. Citation2015; Garnier, Navas, and Grigulis Citation2016). Increasing dominance of deciduous shrubs might shift leaf trait CWMs toward higher photosynthetic rates. Soil nutrient availability and dynamics, discussed further on, may also affect aboveground productivity by affecting the availability of N or other nutrients for the production of leaves and their photosynthetic machinery.
All aboveground plant parts respire, including living cells in wood and bark, so that aboveground respiration depends on the aboveground biomass of both leaves and herbaceous and woody stems, which increase during shrub expansion. Respiration rates are directly affected by temperature, which is affected by community composition as noted earlier. Rates of respiration in leaves also vary in concert with leaf economic traits (Wright et al. Citation2004).
Because most of the carbon in arctic-alpine systems is stored belowground as soil organic matter that may either accumulate or decompose, belowground respiration is a critical component of overall gas exchange. In principle, belowground respiration can be further divided into plant root and microbial respiration, but given the tight coupling of roots and soil microflora independent measurement of these two sources is difficult if not impossible to achieve in practice. Changes in aboveground plant community composition may be accompanied by changes in litter quality, temperature, soil moisture, and soil pH and aeration, all of which may affect respiration more or less directly or via changes in soil microflora (Schinner Citation1983; Sinsabaugh, Moorhead, and Linkins Citation1994; Illeris, Michelsen, and Jonasson Citation2003; De Deyn, Cornelissen, and Bardgett Citation2008; Karhu et al. Citation2014). In comparison to other ecosystems, tundra ecosystems are nutrient poor, and heath vegetation in particular is more nutrient poor than meadow vegetation (Makarov et al. Citation2003; Björk and Molau Citation2007). The dominant plants in heath, meadow, and deciduous shrub communities associate with ericoid (ERM), arbuscular-vesicular (AM), and ectomycorrhiza (ECM), respectively (Väre, Vestberg, and Eurola Citation1992; Michelsen et al. Citation1998; Becklin and Galen Citation2009). These different mycorrhizal types may differ in biomass, respiration rates, and nutrient delivery to plant roots, affecting primarily belowground respiration and secondarily the aboveground gas-exchange processes. Recent studies suggest that ECM contribute to the loss of soil C from ecosystems by acting as decomposers, especially in arctic and boreal systems (Talbot, Allison, and Treseder Citation2008; Lindahl and Tunlid Citation2015). It is reasonable to expect shifts in soil microbial communities during shrub expansion as well. Relative soil microbial activity can be assessed by measuring the activities of extracellular enzymes in soil samples (Hernández and Hobbie Citation2010).
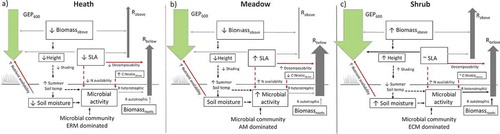
The aim of this study was to explore how plant functional traits, microbial activity, and abiotic properties affect C cycling (). We measured daytime growing-season ecosystem respiration (ER) and GEP in a Salix-dominated shrub community, a dwarf shrub–dominated heath, and an herb-, bryophyte-, and lichen-dominated meadow in central Norway, and hypothesized (see ) that:
Figure 1. Hypothesized framework for growing-season C fluxes: gross ecosystem photosynthesis depends on total aboveground biomass (Biomassabove), community-weighted mean of specific leaf area (SLACWM), and soil moisture (Hypothesis 1). Aboveground respiration (Rabove) depends on Biomassabove and SLACWM (Hypothesis 2a). Belowground respiration (Rbelow) depends on root biomass (Biomassroots), microbial activity, and SLACWM, where SLACWM in this context represents leaf decomposability (Hypothesis 2b). Microbial activity depends on vegetation woodiness, represented by the C:N ratio of aboveground vegetation (C:Nratio above), and on nutrient availability and leaf recalcitrance as represented by SLACWM (Hypothesis 3). Dashed lines between variables indicate important relationships not tested in this study. The framework is based on Wookey et al. (Citation2009); Clemmensen et al. (Citation2015); Veen, Sundqvist, and Wardle (Citation2015); Parker, Subke, and Wookey (Citation2015); and Becklin, Pallo, and Galen (Citation2012).
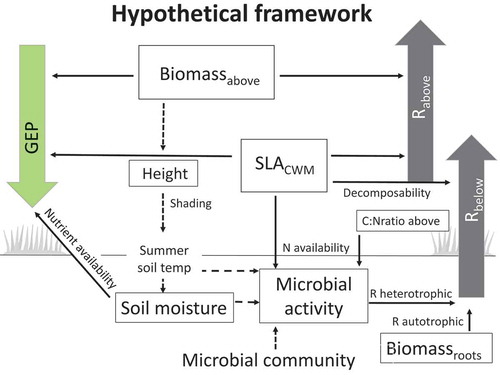
Hypothesis 1: GEP across communities is primarily controlled by the community-weighted mean of SLA (SLACWM), total aboveground biomass (Biomassabove), and soil moisture with SLACWM being the strongest driver.
Hypothesis 2: (a) The aboveground component of ER is influenced by SLACWM and Biomassabove with Biomassabove having the greatest effect. (b) Belowground respiration is controlled by root biomass (Biomassroots), microbial activity, and SLACWM. We expect microbial activity to be the strongest driver in the meadow and SLACWM to be the strongest driver in the heath and shrub communities.
Hypothesis 3: Carbon-degrading microbial activity related to cellulose and lignin degradation decreases with vegetation woodiness, represented by C:N ratio of aboveground vegetation, and decreases with leaf recalcitrance, represented by SLACWM.
Materials and methods
Study area and sampling design
The field sites were located above the forest line in the low-alpine vegetation zone approximately 1,100 m a.s.l. in Dovrefjell, central Norway (62°N, 9°E) in an Empetrum-dominated heath; an herb-, bryophyte-, and lichen-dominated meadow; and a Salix-dominated shrub community (Figure S1). The climate in the area is continental (Moen Citation1998), with annual and summer mean temperatures of −1°C and 7.1°C and 700 mm and 298 mm of precipitation for the period from 1960 to 1990 (New, Hulme, and Jones Citation2000). In 2015, the annual and growing-season mean temperatures were 1.58°C and 8.15°C, respectively, and the total precipitation for the same periods was 667 mm and 265 mm at the closest weather station at Hjerkinn, 1,012 m a.s.l. (Norwegian Meteorological Institute, eklima.met.no). Large areas of homogeneous vegetation were chosen for each community and therefore situated on different but neighboring mountain slopes, while keeping variation in other abiotic variables to a minimum; that is, aspect and slope. The three communities differed in the surrounding topography, as the heath was more wind exposed and the meadow and shrub communities were more sheltered, presumably influencing the vegetation composition (). For a more detailed list of dominant species see Table S1 in Sørensen et al. (Citation2017).
Table 1. Community means ± SD for alpine Empetrum-dominated heath, meadow, and Salix-shrub plant communities in Dovre Mountains, central Norway.
Soils were podzolic in all sites, with a partial albic horizon in the shrub community and a well-developed albic horizon in the heath (Sjögersten and Wookey Citation2009). Soils were developed from ground moraine over metavolcanic rock in the heath and shrub community and shale in the meadow (NGU Citation2015).
The sampling design of this study was part of a larger experiment with four different treatments in each of eight blocks for each community (Sørensen et al. Citation2018; Figure S1). In the present study, six replicate blocks from each community were randomly selected for measurements. The average distance among blocks within community was 23.0 m in the shrub community, 21.7 m in the meadow community, and 28.1 m in the heath community. Across communities the average distance ±SD between neighboring plots was 24.4 ± 3.4 m.
In each block, C fluxes, microclimate, and leaf traits were measured on 0.5 × 0.5 m plots and aboveground biomass was harvested for chemical analysis in neighboring harvest plots, measuring 0.25 × 0.25 m in the heath and meadow communities and 0.5 × 0.5 m in the shrub community, to capture the heterogeneity of woody biomass in the latter. Additionally, the belowground properties microbial activity, root biomass, pH, and soil C:N ratios were measured in a soil pit in early September 2015 (details further on). Six blocks were studied in the meadow and heath communities, whereas only five blocks where included in the shrub community because of logistics, resulting in a total of seventeen across the three communities.
Flux measurements and microclimate
In mid-growing season in 2015, on sunny days only, CO2 flux was measured in a closed system composed of a collapsible 0.5 m × 0.5 m × 0.6 m (L × W × H) polyethylene chamber and a LI-840A CO2/H2O infrared gas analyzer (LI-COR Inc., Lincoln, NE, USA). The chamber was sealed with a canvas skirt along the base of the tent, which was covered with a 5 m long chain weighing 5 kg, and four fans mixed the air inside the chamber for 30 s prior to and during each measurement. The CO2 concentration was recorded every second throughout a 120 s light measurement followed by a 120 s dark measurement, so that in total the chamber remained on each plot for 240 s. From the light measurement net ecosystem exchange (NEE) was determined, and from the dark measurements ER was determined.
We corrected the CO2 concentration for water content (C´) and then used linear regression to find the CO2 flux (Jasoni, Smith, and Arnone 2005).
Where V = volume chamber (m2), P = air pressure (kPa; estimated to be 90 kPa at our sites at 1,100 m elevation), R = the ideal gas constant (8.314 J mol −1 K–1), Tair = average air temperature (°C) during the measurement, S = surface area (m2), d′C/dt = the slope of linear regression of C′ on time. Gross ecosystem photosynthesis was calculated by subtracting ER from NEE. We performed light-curve measurements one time on all plots. One light-curve measurement consisted of one measurement in full light, measurements at three increasing levels of shading, and one measurement in full darkness (Williams et al. Citation2006; Street et al. Citation2007). There was a gap of at least 30 s between each measurement period. The shading was done with three layers of black tulle. For dark measurements, we used an opaque hood to block out the light (Street et al. Citation2007). In the period from July 16 to August 20, we measured NEE and ER from one to two times per plot on fourteen different days, and light-curve measurements were done once per plot on eight different days. We found no statistical difference between normal GEP and GEP standardized to 600 µmol m2 s–1 based on the light-curve measurements (Sørensen et al. Citation2017), and we used the standardized estimates based on the light-curve measurements in the final data set.
For more details on the flux measurement methods see Sørensen et al. (Citation2017).
During all flux measurements, we measured light (PAR, µmol m2 s–1) with a LI-190S quantum sensor (LI-COR Inc., Lincoln, NE, USA), air temperature with PT100 sensors inside (at 40 cm height) and outside the chamber (at 60 cm), soil temperature at 8 cm depth (digital dial thermometer, Traceable® Ultra™, VWR International), and soil moisture at 5 cm depth with a TRIME-PICO32 sensor (IMKO, Germany). Additionally, soil moisture was measured in early, mid-, and late-growing season. Surface temperature (at 1 cm depth) was recorded every four hours with temperature sensors (iButtons, Maxim Integrated Products, Sunnyvale, CA, USA). The surface temperatures during the flux measurements were estimated by interpolation. Snow depth was measured four times per plot with an avalanche probe in March 2015 and April 2016; if marking sticks were not visible, plots were located by a handheld GPS receiver (3 m precision).
Above- and belowground respiration
To separate ER into above- and belowground respiration, we identified the specific fractions of above- and belowground respiration with CO2 flux measurements before and after harvest of biomass in harvest plots as described in Strimbeck et al. (Citation2019). The measurements were performed on six plots in each community during nine different days between July 17 and August 13. To minimize flux because of additional root decomposition, we tried to complete the harvest in four or six hours, and measured soil respiration immediately after removing the last layer. On five plots, however, measurements were interrupted by one or two days because of unpredictable weather conditions. The same measurement equipment as described earlier was used, except that a smaller plexiglas chamber (0.25 m × 0.25 m × 0.3 m) was used in the heath and meadow communities. A rubber skirt was attached to the base of the chamber and it was sealed by the chain. A sampling tube, a return tube, and a PT100 sensor to measure air were placed 0.2 m above the soil surface. After initial measurements, the vegetation was harvested sequentially by functional group with a knife or scissor. Bryophytes and lichens were cut at the soil surface and the litter was removed last, leaving the bare soil surface. The CO2 fluxes were measured after the removal of each layer. There was little difference in ER or NEE before and after removal of the litter layer (or in light and dark), so a mean of the four measurements was used as a robust estimate of belowground respiration. The aboveground respiration was found by subtracting belowground respiration from ecosystem respiration before harvest. Because of differences in temperature during the day, respiration was standardized to temperature following the same method as described further on. The specific ratios of above- and belowground respiration were then identified based on means across community. For more details see Strimbeck et al. (Citation2019).
Aboveground plant traits
Leaf traits
Samples for SLA and leaf dry matter content (LDMC) of the dominant vascular species were collected in each block outside of the experimental plots in each plant community during the peak growing seasons of 2013, 2014, and 2016. Dominant species were those that collectively made up 80 percent of cumulative relative abundance in each plant community (Pérez-Harguindeguy et al. Citation2013), based on vegetation analysis performed in 2013. Between three and twenty leaves per species from two individuals per block were sampled. Leaves (on twigs when possible) were placed in plastic bags with moist paper towels and stored at 4°C (Cornelissen et al. Citation2003; Pérez-Harguindeguy et al. Citation2013). Fresh leaves, including petioles, were weighed to ±0.1 mg, scanned at 600 dpi, and the area was measured with Image J software (National Institutes of Health, Bethesda, MD, USA). The leaves were then oven dried at 70°C for 72 h and weighed again (Cornelissen et al. Citation2003).
Community weighted means were calculated (Garnier et al. Citation2004; Violle et al. Citation2007) for SLA (SLACWM) and LDMC (LDMCCWM) for each plot in each community, based on the mean trait value per species per block in each community and the relative abundance in the plots. The relative abundances of species were recorded with the point intercept method (Goodall Citation1952) in July 2015 during mid-growing season with a 25 × 25 cm quadrat and twenty-five pins.
Aboveground biomass harvest
Aboveground biomass (Biomassabove) was destructively sampled from harvest plots during the mid-growing season in July 2015. All plant material was oven dried at 70°C for 72 h before weighing to ±0.001 g. Leaves were separated from the woody stem for deciduous and evergreen shrubs. Aboveground plant and litter C and N pools (g C m–2) were estimated by multiplying the oven-dry weight (g) by the average C and N concentration (mg–1 g) per functional group. The C concentration per functional group was determined from plant material harvested in an earlier study in 2013 from the same sites (see appendix 2 in Sørensen et al. Citation2017).
Belowground properties
Each soil pit was dug to bedrock or the BC horizon. The mean total depth of the soil pits was 56 ± 8 cm and ranged from 42 cm to 70 cm. Duplicate soil samples were extracted from each horizon, identified by color and texture. Each sample was extracted for a defined volume (5 × 5 × 5 cm) using a knife. The duplicate samples were analyzed in two different laboratory locations. One sample was used for measurements of microbial activity, root biomass, and soil pH and the other was used to determine soil and root C and N content. The samples were stored at 4°C for a maximum of five days before being processed.
Root biomass, carbon, and nitrogen
To determine root biomass (Biomassroots), all visible roots (living and dead) were manually extracted from fresh soil samples for 15 min per sample. In nearly all samples this meant extracting every root visible to the naked eye. The collected roots were oven dried at 60°C for 48 h and weighed. To determine root C and N content from the other duplicate sample, roots were washed, oven dried, and homogenized by grinding (MF 10 basic IKA Werke) prior to elemental combustion (ECS 4100, Costech).
Soil properties
To determine total soil C and N content, soils were oven dried at 60°C for 48 h. Roots and stones (>2 mm) were removed by sieving the soil. Soil organic matter was determined for each soil sample from all horizons via loss on ignition (LOI) in a furnace at 550°C for 5 h. Soil samples were then bulked per horizon to determine C and N concentrations via elemental combustion (ECS 4100, Costech). Average LOI per horizon (FractionLOI (%)) was significantly correlated with bulked soil C concentration—C concentration (%): C concentration (%) = 0.44 × FractionLOI (%) – 0.26, p < 0.0001, R2 = 0.92, n = 74). This relationship between FractionLOI (%) and C concentration (%) was used to calculate C concentrations for eight soil horizons that were not included in our soil C concentration determination. For all soil samples we found no evidence of inorganic C in the form of carbonates, determined by effervescence following the addition of 1 M HCl (see Hodgson 1997). Soil organic carbon (SOC; kg C m–2) was calculated by multiplying the C concentration (%) per horizon by horizon thickness (m) and bulk density (kg m–3). Following these calculations, horizons were then pooled into organic versus mineral based on a threshold of 80 percent LOI for organic soils (Hodgson 1997). Soil pH was measured using 0.01 M CaCl2 in a 1:3 soil-to-solution mixture for each soil horizon in each soil pit.
Microbial activity
We assessed the activity of the soil community by assaying the potential extracellular enzyme activity of α-glucosidase (a-gluc), β-glucosidase (b-gluc), cellobiohydrolase, β-xylosidase (xylo), cellobiohydrolase (cbh), and N-acetylglucosaminidase (nag) for each soil horizon in all of the soil pits. Enzymes that are important in C degradation (a-gluc, b-gluc, cbh, and xylo) break down carbohydrates and polysaccharides and nag mineralizes nitrogen from chitin (Read and Perez-Moreno Citation2003; Bell et al. Citation2013).
From one to two grams of soil from each sample were mixed in 125 mL 0.5 M sodium acetate buffer (pH 5) on a stir plate. We added substrates in eight analytical replicates in ninety-six well plates: 4-MUB-α-D-glucoside, 4-MUB-β-D-glucoside, 4-MUB-β-D-cellobioside, 4-MUB-β-D-xyloside, and 4-MUB-N-acetyl-β-D-glucosaminide, respectively. The plates were incubated in a dark environment at room temperature before the activity was analyzed with a fluorimeter/spectrophotometer (Synergy HT; Biotek Inc, Winooski, VT, USA). Fluorescence of the enzymes was measured at an excitation of 365 nm and an emission of 450 nm. Potential enzyme activity is expressed in the units of nmol h–1 g–1 dry soil. To get the total enzyme activity for the full soil depth, as recommended by Hernández and Hobbie (Citation2010), we used soil bulk density to convert the activity per horizon from nmol g–1 h–1 to nmol h–1 m–2 and then summed up the enzyme activity across all horizons (Microbessum).
Hyphal ingrowth
Mycorrhizal ingrowth bags (5 × 3.5 cm, 50 µm nylon to allow hyphal ingrowth but too fine for plant roots) were buried 2–11 cm below the soil surface between the organic and mineral soil horizon for thirteen weeks from mid-June to September in each block in the three communities. Each bag contained approximately 30 g autoclaved quartz sand (Moore et al. Citation2015). Hyphal biomass was measured by extracting hyphae from the ingrowth bags within two weeks after collection, using standard floating techniques (Wallander, Göransson, and Rosengren Citation2004). The extracted hyphae were freeze dried at −20°C prior to weighing (Moore et al. Citation2015) and the biomass was reported as mg of hyphal biomass per g sand (Wallander, Göransson, and Rosengren Citation2004). These data were insufficient for analysis because there was poor ingrowth in some plots, but the results are reported in as background data.
Data analysis
Flux analysis
Ecosystem respiration was separated into aboveground (Rabove) and belowground respiration (Rbelow) based on the sequential harvest measurements decribed earlier. Because we know from earlier studies that shrub expansion has an effect on canopy and soil temperature (Sturm et al. Citation2005; Myers-Smith and Hik Citation2013; Sørensen et al. Citation2017) and to limit the number of factors in statistical models (a result of the few data points), we standardized ER to a specific temperature (ERtemp) using Q10 = 2 (Tjoelker, Oleksyn, and Reich Citation2001). Aboveground respiration was standardized to 20°C (Rabove), corresponding to mean air temperature inside the chamber during flux measurements (Tair), whereas belowground respiration was standardized to 10°C (Rbelow), corresponding to mean soil temperature at 8 cm depth during the measurements (Tsoil).
The above- and belowground components of ER were estimated using the mean ratio of above- and belowground respiration for each community (fabovecommunity and fbelowcommunity; Strimbeck et al. Citation2019). To standardize GEP to a photosynthetically active radiation (PAR) of 600 (μmol m–2s–1; GEP600), we used light-response curves for each plot, derived using the nls functions in R (R Core Team Citation2017):
Where GEP = ERtemp – NEE, I = incident PAR (μmol m–2s–1), Pmax = rate of light saturated photosynthesis, and k = half saturated constant of photosynthesis. If we did not have any saturation from the light-response curve, we used a fixed value of Pmax. We tried with different values of Pmax, and chose the one with the best fit according to the observed data and to the p value for Pmax. Even though GEP600 was not significantly different from nonstandardized GEP measurements (Sørensen et al. Citation2017), we chose to use GEP600 to reduce the variance between the plots.
Hypothesis testing
To test the hypothesized framework of ecosystem controls of C fluxes, we used multiple linear models with z-standardized variables (x – mean (x))/sd (x). Variables included in the final full models followed the a priori models described in Hypotheses 1–3: SLACWM, Biomassabove, soil moisture, Biomassroots, and Microbessum. Variables excluded because of collinearity (following Alain et al. Citation2010) were LDMCCWM and Community type. The flux data were ln-transformed to meet model assumptions. We used backward model selection (drop1 function in R) to identify the significance of each predictor variable. Additionally, we used exhaustive model selection on the a priori models (Burnham and Anderson Citation2002), with AICc as the selection criterion (glmulti package and MuMIn package; Grueber et al. Citation2011). We visualized the different ecosystem controls across and within the three communities by keeping two variables constant by their means and plotting the third variable against the C fluxes.
Because of limited degrees of freedom, we did not test interaction effects in the model selection.
To test if microbial activity beneath woody vegetation differed from that in non-woody vegetation (the meadow) we summed up the activity of enzymes degrading recalcitrant litter (b-gluc, cbh, xylo). The activity of those C-degrading enzymes was tested for correlation with C:N ratios of total ecosystem, aboveground vegetation, soil, and roots and SLACWM, respectively. We used one-way ANOVAs to test for community differences in microbial activity, and tested significance using multiple comparisons with a Tukey’s honest significant difference test (p < 0.05).
The enzyme activities were estimated per m2, but to test if any were driven by the content of C in the soil, we also converted the enzyme activity to per g soil C per m2 (Stone, DeForest, and Plante Citation2014). There were some outliers in the enzyme data, which we decided to keep because of the small sample size, except for one, agluc H4_P1B1 (Figure S4).
All analyses were performed in the R programing environment (R Core Team Citation2017).
Results
Soil moisture had the greatest effect on gross ecosystem photosynthesis
Soil moisture had the greatest effect and was the only significant predictor of GEP across community ( and ). Biomassabove and SLACWM had less effect on GEP but made strong contributions to the explanation of variance (). The model with the lowest AICc contained only soil moisture and Biomassabove and explained 52 percent of the variance, whereas the full model containing all three variables SLACWM, moisture, and Biomassabove explained slightly more variation (R2 = 0.55; ).
Table 2. Effects (µmol m–2 s–1) SD–1of each variable in full models across community. Explanatory variables were z-standardized (x – mean(x))/sd(x) so one unit change corresponds to one SD. Models were run without log transformation to ease understanding of the effects. Sum of squares (2) and p values were derived from a likelihood-ratio test (Chi-square test) performed on backward model selection (drop1 function in R; n = 17). Significant effects are bold.
Table 3. Gross ecosystem photosynthesis model selection based on AICc on multiple linear models, testing Hypothesis 1. GEP was standardized to 600 PAR (GEP600) and log-transformed. Soil moisture (%), specific leaf area (SLACWM; mm–2 mg–1), and aboveground biomass (Biomassabove; g DW m–2) were z-standardized. Akaike weight values (w) is the probability a model is best, given the set of models considered. R2 adjusted was calculated for each model (n = 17).
Figure 2. Full model variable relationships when plotting one variable and keeping the others constant. Relationships are across community and within community, based on growing-season measurements in alpine Empetrum-heath, meadow, and Salix-shrub plant communities in Dovre Mountains, central Norway (n = 17). Lines drawn are for significant variables across (red) and within community (black dashed line), tested with a likelihood-ratio test (Chi-square test) performed on backward model selection (drop1 function in R). Top (A–C): Gross ecosystem photosynthesis standardized to 600 PAR (GEP600; µmol m−2 s−1) and the variables community-weighted means of specific leaf area (SLACWM; mm−2 mg−1), total aboveground biomass (Biomasabove; g DW m–2), and soil moisture (%). Middle (D,E): Estimated aboveground respiration standardized to 20°C (Rabove; µmol m–2 s–1) and the variables SLACWM and Biomassabove (g DW m–2). Bottom (F–H): Estimated belowground respiration standardized to 10°C (Rbelow) and the variables SLACWM, root biomass (Biomassroots; g DW m–2), sum of all measured microbial activity (Microbessum; nmol h–1 m–2). Biomass roots and Microbessum was summed across the total soil pit with mean depth 56 ± 8 cm.
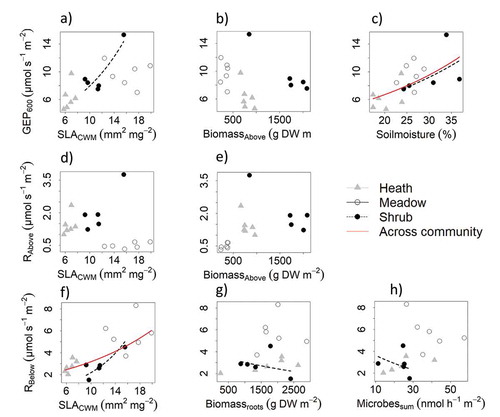
Within communities, models were overall very poor, with high uncertainty because of the few data points. Soil moisture and SLACWM were significant predictors in the shrub community only (, Table S1).
Aboveground biomass was the best predictor of aboveground respiration
Aboveground respiration (Rabove) was highest in the shrub community, intermediate in the heath community, and lowest in the meadow community (). Biomassabove had the greatest effect on Rabove, but was nonsignificant in backwards model selection (). Biomassabove alone constituted the best model with lowest AICc, explaining 32 percent of the variance. The full model with both Biomassabove and SLACWM was second best and explained slightly more (R2 = 0.36; ). The effect of SLAcwm on Rabove across the community was nonsignificant ( and ).
Table 4. Aboveground respiration (Rabove) model selection based on AICc on multiple linear models, testing Hypothesis 2a. Rabove was standardized to 20°C and log-transformed. Specific leaf area (SLACWM; mm–2 mg–1) and aboveground biomass (Biomassabove; g DW m–2) were z-standardized. Akaike weight values (w) is the probability a model is best, given the set of models considered. R2 adjusted were calculated for each model (n = 17).
Within the community, we expected Biomassabove to have the greatest effects on Rabove, although this effect was only marginally significant (p = 0.055) and only in the heath community (Table S1).
Specific leaf area predicts belowground respiration
Belowground soil respiration (Rbelow) was highest in the meadow and lowest in the heath and shrub communities. Specific leaf area (SLACWM) had the greatest effect and was the only significant predictor of Rbelow ( and ). The best model with the lowest AICc scores only contained SLACWM (R2 = 0.45; ). However, slightly more variation was explained when the model also contained microbial activity (R2 = 0.51) or Biomassroots (R2 = 0.50; and ).
Table 5. Belowground respiration (Rbelow) model selection based on AICc on multiple linear models, testing Hypothesis 2b. Rbelow was standardized to 10°C and log-transformed. Specific leaf area (SLACWM; mm–2 mg–1), the sum of microbial activity (Microbessum; nmol h–1 m–2), and standing root biomass (Biomassroots; g DW m–2) were z-standardized. Akaike weight values (w) is the probability a model is best, given the set of models considered. R2 adjusted were calculated for each model (n = 17).
Within the shrub community, SLACWM, Biomassroots, and Microbessum were significant, but SLACWM had the greatest effect on Rbelow (Table S1). Unexpectedly, there was a negative relationship between Rbelow and Biomassroots and Microbessum in the shrub community (–H).
Carbon degrading microbial activity was highest in the meadow and related to specific leaf area
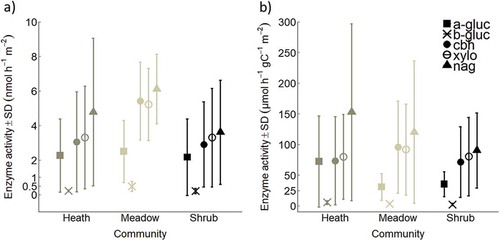
Microbial activity was similar in the woody heath and shrub communities, and the carbon-degrading enzyme activity related to cellulose and lignin degradation (cbh and xylo) in the soils was lowest in the woody communities and highest in the meadow (p < 0.05, TukeyHSD; and ). In the organic horizon, the activities of all enzymes except a-gluc were highest in the meadow community (p < 0.001, TukeyHSD; , Figure S2a). We tested if this could be because of the high carbon content in the meadow soil by controlling for amount of SOC. This evened out the differences, except for the potential enzyme activities of a-gluc and b-gluc, which were marginally higher in the heath than the other communities (a-gluc per gram C: mineral horizon: p ≤ 0.05, total horizon: p ≤ 0.07, TukeyHSDand b-gluc per gram C: mineral horizon: p = 0.05, Total horizon: p = 0.06, TukeyHSD; , Figure S2d, Table S2).
Table 6. F value, degrees of freedom(df), and p value from one-way ANOVA tests of differences among enzyme activities (nmol h–1 m–2) between communities. The enzymes were from organic and mineral horizons, and total across the soil pit. The significant differences are bold. In the organic horizon b-gluc, cbh, xylo, and nag were significantly higher in the meadow than in the heath and shrub communities (p < 0.001, TukeyHSD). Activity of a-gluc in the meadow was only higher than the shrub community (p < 0.05, TukeyHSD).
Figure 3. Mean enzyme activity ±SD of α-glucosidase (a-gluc), β-glucosidase (b-gluc), cellobiohydrolase (cbh), β-xylosidase (xylo), and N-acetylglucosaminidase (nag), (A) in nmol h–1 m–2 and (B) in µmol h–1 gC–1 m–2 for alpine Empetrum-dominated heath, meadow, and Salix-shrub plant communities in Dovre Mountains, central Norway. Activity for each enzyme is the sum across the total soil pit with mean depth 56 ± 8 cm (n = 17). See activities in organic and mineral horizons in Figure S2, and statistical differences in and Table S2.
Vegetation woodiness, represented by the C:N ratio of aboveground vegetation, was negatively related to carbon-degrading microbial activity (R2 = 0.28, p < 0.05). However, more variation was explained by SLACWM (R2 = 0.34, p < 0.01), which was positively related to carbon-degrading microbial activity (). The C:N ratios of soil, roots, and total ecosystem (aboveground vegetation, roots, and soil) were also negatively related to carbon-degrading microbial activity, although the relationships were weak (C:N ratiosoil: R2 = −0.0075, p = 0.36; C:Nratioroots: R2 = 0.059, p = 0.18; C:N ratiototal ecosystem: R2 = 0.15, p = 0.07).
Figure 4. Total enzyme activity of β-glucosidase (b-gluc), cellobiohydrolase (cbh), β-xylosidase (xylo) (C enzyme activitysum) (nmol h–1 m–2) correlated with “vegetation woodiness” across alpine Empetrum-dominated heath, meadow, and Salix-shrub plant communities in Dovre Mountains, central Norway. Left, community-weighted mean of SLA (SLACWM; p = 0.009) and right, C:N ratio of aboveground vegetation (C:N ratioAbove-ground; n = 17).
Discussion
This study demonstrates the varying importance of ecosystem controls of C cycling in three alpine plant communities when CO2 flux estimates are controlled for temperature and light (). Gross ecosystem photosynthesis was least driven by plant functional traits, whereas soil moisture and aboveground biomass were more important. Aboveground respiration was also driven by the amount of aboveground biomass, whereas belowground respiration was dependent on the community-weighted mean of SLA (SLACWM). Potential microbial activity was highest in the meadow, and carbon-degrading microbial activity decreased with vegetation woodiness and increased with SLACWM. The results suggest that changes in community composition associated with shrub expansion, acting via these control points, may cause significant changes in gas-exchange processes and carbon source-sink dynamics.
Figure 5. Summary of results with respect to hypothesized mechanisms based on actual measurements of growing-season summer C fluxes GEP600) and ecosystem respiration partitioned into estimated aboveground (Rabove) and belowground respiration (Rbelow) in alpine Empetrum-heath, meadow, and Salix-shrub plant communities in Dovre Mountains, central Norway (n = 17). Up and down arrows indicate high or low values. Arrow style indicates a significant variable in the full model across community (red line), significant variable in simple correlation (red dashed line), significant variable within the community (black line), presumed relationship not tested in this study (black dashed line), nonsignificant variable across community (grey). The flux arrow width is proportional to its measured flux size transformed to gC m–2 h–1.
Soil moisture and aboveground biomass controls aboveground C fluxes
Soil moisture was the best predictor of GEP and the effect is probably related to the shift in vegetation composition along the moisture gradient with heath vegetation at the driest end and shrub community at the wettest. Soil moisture was even more important than the aboveground standing biomass (Biomassabove) of the system. Other studies also identified soil moisture as limiting GEP in arctic-alpine ecosystems (Sjögersten, van der Wal, and Woodin Citation2006; Dahl et al. Citation2017; Martin et al. Citation2017; Westergaard-Nielsen et al. Citation2017). Soil moisture may affect GEP via stomatal conductance. On exposed sites in alpine regions, the selective pressure for dealing with drought stress events is clearly seen in many plants that have low growth, small leaves, and high content of leaf dry matter (Körner Citation2003). Soil moisture may also affect GEP indirectly via nutrient mineralization and availability. Desiccation of soils limits the flow of nutrients to the roots and also microbial activity and nutrient mineralization (Körner Citation2003; Berdanier and Klein Citation2011).
Contrary to expectations and Hypothesis 1 (Lavorel and Garnier Citation2002; Klumpp and Soussana Citation2009), we can conclude that SLACWM was a less important predictor of GEP across communities. Community-weighted means of SLA for vascular plants do not capture the amount of leaf area in a community, and may therefore be inferior to LAI, which is often used to predict GEP (Chapin 2003; Street et al. Citation2007).
The high fraction of bryophytes and lichens in the communities (Sørensen et al. Citation2017) may have played a role in the importance of soil moisture and the lack of importance of vascular leaf traits for the GEP. Cryptogams survive desiccation by their poikilohydric strategies, and the importance of soil moisture on GEP may have been related to the high abundance of cryptogams (Sancho et al. Citation2016; Chadburn et al. Citation2017). Some studies suggest that cryptogams may be important contributors to NEE in spring and autumn seasons (Douma et al. Citation2007; Sancho et al. Citation2016), but in our sites cryptogams contribute little to gas exchange during peak growing season (Strimbeck et al. Citation2019).
Consistent with Hypothesis 2a, Rabove followed the same trend as Biomassabove, highest in the shrub community, intermediate in the heath, and lowest in the meadow, but the relationship was not a linear fit (). The nonsignificant influence of Biomassabove could potentially be explained by the relatively large woody biomass component in the shrub community and heath communities (see more on fluxes and biomass in Strimbeck et al. Citation2019). In the shrub community, deciduous shrub leaves made up only 8–18 percent of the deciduous biomass, whereas evergreen leaves in the heath community made up 52–65 percent of total evergreen shrub biomass. Also, the high biomass and low productivity of cryptogams in some of our sites may contribute to the lack of correlation between Biomassabove and Rabove.
Specific leaf area drives soil respiration across the community
Community-weighted means of SLA had the greatest effect on belowground respiration (Rbelow). High SLACWM indicates labile leaves that decompose fast and should therefore increase heterotrophic respiration (Garnier et al. Citation2004; Questad et al. Citation2007; De Deyn, Cornelissen, and Bardgett Citation2008; Bardgett Citation2017), but few studies have confirmed this effect. SLA is also strongly correlated with leaf nitrogen (Wright et al. Citation2004), and can be a surrogate for nitrogen availability (Hodgson et al. Citation2011), which may in turn relate to microbial activity and heterotrophic respiration.
SLACWM, Biomassroots, and Microbessum were significantly important for Rbelow, supporting Hypothesis 2b. Across communities there was a positive relationship between SLACWM and Rbelow within the shrub community (), and this variable showed the strongest effect on Rbelow. Unexpectedly, there was a negative relationship between Rbelow and Microbessum and Biomassroots in this community. We suspect, however, that the significance of these relationships could be because of type 1 error, caused by the very small sample size in this community. Given the high variability of the systems, and in the shrub community in particular, higher intensity sampling is needed for full delineation of these relationships. Ideally, sampling of fluxes and potential enzyme activity should also be measured concurrently (German, Chacon, and Allison Citation2011), but this was prevented by logistics in our study.
In this study, Rbelow was not separated into autotrophic and heterotrophic respiration. Biomassroots was not significantly different among the communities and SLACWM and not Biomassroots had the greatest effect on Rbelow. This could imply that the difference among communities consists primarily in the heterotrophic respiration compartment and not so much in the autotrophic respiration.
Microbial activity was related to SLA and was highest in the meadow
Mycorrhizal fungi should be common members of the microbial community in all the plant communities we studied, and we found hyphal growth in both the ERM heath and ECM shrub community, but not in the AM-dominated meadow community (). We predicted that microbial enzyme activity would be highest where plant root and fungal production were also the highest, because an increase in inputs should increase microbial activity overall (e.g., priming). We found that the C:N ratio in plant material, here an indication of woodiness, was negatively correlated with potential microbial enzyme activity ( and ), supporting Hypothesis 3. Interestingly, we found that the function of the microbial community was more related to a key functional plant trait, as the C-degrading microbial activity was positively correlated with SLACWM. This finding is supported by the proposed Mycorrhizal Associated Nutrient Economy Framework that was suggested for AM- and ECM-dominated temperate forests, which states that AM-dominated vegetation has higher rates of decomposition and higher chemical quality litter, as compared to ECM-dominated vegetation with lower quality litter (Phillips, Brzostek, and Midgley Citation2013). Indeed, microbial activity was highest in the meadow ecosystem and likely reflects the more labile inputs and higher root production found in meadow ecosystems relative to the woody heath and shrub ecosystems (Stark and Väisänen Citation2014; German, Chacon, and Allison Citation2011; Iversen et al. Citation2015) together with higher nitrogen availability (Garnier et al. Citation2004; Hodgson et al. Citation2011). Additionally, the meadow had twice as much SOC and total soil nitrogen as well as higher minimum pH compared to in the heath and shrub communities (; Sørensen et al. Citation2017). An alternative source of N in both the meadow and the shrub communities could be provided by cryptogams (Pleurozium schreberi, Hylocomium splendens, and Peltigera) that are associated with N-fixing cyanobacteria (Knowles, Pastor, and Biesboer Citation2006; Jonsson et al. Citation2015). When we corrected our measured activities for SOC, the differences among the three communities were eliminated, suggesting that the enzyme activities were positively related to total soil carbon.
Proposed mechanisms for changes in C cycling under shrub expansion
Understanding the ecosystem processes of arctic-alpine plant communities is important for predicting the impacts of the ongoing deciduous shrub expansion. The results from this study are best estimates based on few data points. The shrub community is very heterogeneous not only because of the patchy nature of the shrubs both above- and belowground, but also because of a gradient in shrub cover throughout the blocks, with the result that one point appears to drive the patterns within this community (). Further studies are needed to refine these results and to corroborate the findings. synthesizes the knowledge gained from our and others’ studies (e.g., Wookey et al. Citation2009; Becklin, Pallo, and Galen Citation2012; Clemmensen et al. Citation2015; Parker, Subke, and Wookey Citation2015; Veen, Sundqvist, and Wardle Citation2015) on how shrub expansion may affect growing-season C cycling in alpine heath and meadow vegetation.
Figure 6. Summary of results with respect to suggested implications of shrub expansion based on actual measurements of growing-season summer C fluxes (GEP600 and ecosystem respiration partitioned into estimated aboveground (Rabove) and belowground respiration (Rbelow) in alpine Empetrum-heath, meadow, and Salix-shrub plant communities in Dovre Mountains, central Norway (n = 17). Up and down arrows indicate an increase or decrease in variables because of shrub expansion in the respective community. Arrow style indicates a significant variable within the community (black line), presumed relationship not tested in this study (black dashed line), nonsignificant variable across community (grey). The flux arrow width is proportional to its measured flux size transformed to gC m–2 h–1. The transparent arrows correspond to the flux in the community invaded by shrubs.
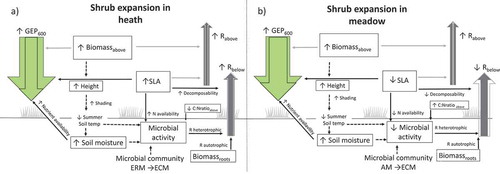
Shrub expansion in heath and meadow would increase mid-growing season C sequestration (GEP), in the heath most likely because of increased SLA, and in both communities because of increased soil moisture (). In Norway, temperature, precipitation, and growing-season lengths are expected to increase during the next century (Hanssen-Bauer et al. Citation2015). We standardized respiration to a fixed temperature to limit the number of factors in our models. However, arctic-alpine summer soil temperatures decrease with shrub expansion (; Sturm et al. Citation2005; Myers-Smith and Hik Citation2013), and we would therefore expect slightly lower Rbelow in the shrub community than presented in this study if we had not standardized to a similar temperature. Some studies have found that shrub expansion conserves soil moisture (Mann et al. Citation2002; Naito and Cairns Citation2011; Myers-Smith et al. Citation2015), while others found that soil moisture decreased as evapotranspiration increased (Christiansen et al. Citation2018). This highlights the need for more species- and community-specific studies about the effects of shrub expansion on soil moisture.
Shrub expansion into the heath could also decrease the local growing-season length or growing degree hours because of deeper and more persistent snow cover ().
Shrub expansion could have different effects on above- and belowground respiration in heath versus meadow ecosystems. As shrub cover expands, aboveground respiration might increase in both heath and meadow, because of increased aboveground biomass. However, in heath communities, belowground respiration may increase with shrub expansion () because of increased decomposability of the litter (reflected by higher SLA), whereas in meadows belowground respiration may decrease () because of lower root productivity and lower decomposability of leaf, woody stems, and roots (Cornelissen et al. Citation2007; Iversen et al. Citation2015; Veen, Sundqvist, and Wardle Citation2015; Christiansen et al. Citation2018). This might seem counterintuitive because we previously found greater soil C pools in the meadow than in the shrub community (; Sørensen et al. Citation2017), but shrubs could easily reduce these pools because of seasonal changes in belowground respiration (Bardgett et al. Citation2005; Grogan and Jonasson Citation2006). More knowledge is needed on how C cycling and stocks relate to mycorrhizal abundance of ECM, ERM, and AM in arctic-alpine ecosystems (Soudzilovskaia et al. Citation2015; Myers-Smith et al. Citation2015).
In this study, we offer a framework for understanding the role of ecosystem controls on C dynamics in a changing arctic. We recommend further studies to test the framework and corroborate the predicted C-budget consequences in specific plant communities.
We demonstrated that the use of plant traits related to the leaf economic spectrum is useful when analyzing C cycling, and we have demonstrated the importance of including both above- and belowground processes and pools when looking at ecosystem properties and processes related to carbon dynamics. Our results illustrate how shrub expansion into alpine tundra communities may influence summer C cycling (ecosystem respiration) differently depending on plant community, as belowground respiration might increase in the heath and decrease in the meadow communities.
Authors’ contributions
MVS, ATC, BJG, RS conceived and designed study. MVS performed fieldwork, lab work, and statistical analysis. ATC analyzed enzyme and hyphal data. BJE and ATC contributed to new methods. MVS wrote the article with input from all coauthors.
Supplemental Material
Download Zip (1.1 MB)Acknowledgments
We are grateful for the ECOSHRUB field teams that have contributed to all the data sampling (Kristin Nystuen Odden, Andreas Baele, Astrid Raunsgaard, Pieter de Frenne, Lisa Sandal, Montserrat Badia, Øystein Opedal, Diana Eckert, Rozalia Kapas, Sigrid Lindmo, Simone Lang, Håkon Holien, Simen Dille, Karl Andreas Johannessen, Lars Uphus, Nick Stam, Jolanta Rieksta, Kenna Elisabeth Rewcastle). We gratefully acknowledge Aimee Classen’s lab for assistance and collaboration on root, soil, and enzyme activity analysis. We thank Norsk Villreinsenter for accommodation. We thank Øystein Opedal for discussions of data analysis and presentation, and Stuart Smith and two anonymous reviewers for valuable comments on the manuscript.
Supplementary material
Supplementary data for this article can be accessed here.
Additional information
Funding
References
- Alain, Z., F. Elena, N. Ieno, and C. S. Elphick. 2010. A protocol for data exploration to avoid common statistical problems. Methods in Ecology and Evolution 1 (1):3–14. doi:10.1111/j.2041-210X.2009.00001.x.
- Bardgett, D. R. 2017. Plant trait-based approaches for interrogating belowground function. Biology and Environment: Proceedings of the Royal Irish Academy 117B (1):1–13. doi:10.3318/bioe.2017.03.
- Bardgett, R. D. 2011. Plant-soil interactions in a changing world. F1000 Biology Reports 3 (16). doi: 10.3410/B3-16.
- Bardgett, R. D., W. D. Bowman, R. Kaufmann, and S. K. Schmidt. 2005. A temporal approach to linking aboveground and belowground ecology. TRENDS in Ecology and Evolution 20 (11):634–41. doi:10.1016/j.tree.2005.08.005.
- Becklin, K. M., and C. Galen. 2009. Intra- and interspecific variation in mycorrhizal associations across a heterogeneous habitat gradient in alpine plant communities. Arctic, Antarctic, and Alpine Research 41 (2):183–90. doi:10.1657/1938-4246-41.2.183.
- Becklin, K. M., M. L. Pallo, and C. Galen. 2012. Willows indirectly reduce arbuscular mycorrhizal fungal colonization in understorey communities. Journal of Ecology 100 (2):343–51. doi:10.1111/j.1365-2745.2011.01903.x.
- Bell, C. W., B. E. Fricks, J. D. Rocca, J. M. Steinweg, S. K. McMahon, and M. D. Wallenstein. 2013. High-throughput fluorometric measurement of potential soil extracellular enzyme activities. Journal of Visualized Experiments: JoVE 81:50961. doi:10.3791/50961.
- Berdanier, A. B., and J. A. Klein. 2011. Growing season length and soil moisture interactively constrain high elevation aboveground net primary production. Ecosystems 14 (6):963–74. doi:10.1007/s10021-011-9459-1.
- Björk, R. G., and U. Molau. 2007. Ecology of alpine snowbeds and the impact of global change. Arctic, Antarctic, and Alpine Research 39 (1):34–43. doi:10.1657/1523-0430(2007)39[34:EOASAT]2.0.CO;2.
- Burnham, K. P., and D. R. Anderson. 2002. Model selection and multimodel inference. 2nd ed. New York: Springer.
- Cahoon, S. M., P. F. Sullivan, G. R. Shaver, J. M. Welker, and E. Post. 2012. Interactions among shrub cover and the soil microclimate may determine future Arctic carbon budgets. Ecology Letters 15:1415–22. doi:10.1111/j.1461-0248.2012.01865.x.
- Cannone, N., S. Sgorbati, and M. Guglielmin. 2007. Unexpected impacts of climate change on alpine vegetation. Frontiers in Ecology and the Environment 5 (7):360–64. doi:10.1890/1540-9295(2007)5[360:UIOCCO]2.0.CO;2.
- Chadburn, S. E., G. Krinner, P. Porada, A. Bartsch, C. Beer, L. Belelli Marchesini, J. Boike, A. Ekici, B. Elberling, T. Friborg, et al. 2017. Carbon stocks and fluxes in the high latitudes: Using site-level data to evaluate Earth system models. Biogeosciences 14 (22):5143–69. doi:10.5194/bg-14-5143-2017.
- Chapin III, F. S. 2003. Responses of arctic tundra to experimental and observed changes in climate. Annals of Botany 91:455–63.
- Christiansen, C. T., M. C. Mack, J. DeMarco, and P. Grogan. 2018. Decomposition of senesced leaf litter is faster in tall compared to low birch shrub tundra. Ecosystems. doi:10.1007/s10021-018-0240-6.
- Clemmensen, K. E., R. D. Finlay, A. Dahlberg, J. Stenlid, D. A. Wardle, and B. D. Lindahl. 2015. Carbon sequestration is related to mycorrhizal fungal community shifts during long-term succession in boreal forests. New Phytologist 205 (4):1525–36. doi:10.1111/nph.13208.
- Cornelissen, J. H. C., P. M. van Bodegom, R. Aerts, T. V. Callaghan, R. S. P. van Logtestijn, J. Alatalo, F. S. Chapin, R. Gerdol, J. Gudmundsson, D. Gwynn-Jones, et al. 2007. Global negative vegetation feedback to climate warming responses of leaf litter decomposition rates in cold biomes. Ecology Letters 10:619–27. doi:10.1111/j.1461-0248.2007.01051.x.
- Cornelissen, J. H. C., S. Lavorel, E. Garnier, S. Díaz, N. Buchmann, D. E. Gurvich, P. B. Reich, H. Ter Steege, H. D. Morgan, M. G. A. van der Heijden, et al. 2003. A handbook of protocols for standardised and easy measurement of plant functional traits worldwide. Australian Journal of Botany 51:335–80. doi:10.1071/BT02124.
- Crowther, T. W., K. E. O. Todd-Brown, C. W. Rowe, W. R. Wieder, J. C. Carey, M. B. Machmuller, B. L. Snoek, S. Fang, G. Zhou, S. D. Allison, et al. 2016. Quantifying global soil carbon losses in response to warming. Nature 540:104. doi:10.1038/nature20150.
- Dahl, M. B., A. Priemé, A. Brejnrod, P. Brusvang, M. Lund, J. Nymand, M. Kramshøj, H. Ro-Poulsen, and M. S. Haugwitz. 2017. Warming, shading and a moth outbreak reduce tundra carbon sink strength dramatically by changing plant cover and soil microbial activity. Scientific Reports 7 (1):16035. doi:10.1038/s41598-017-16007-y.
- De Deyn, G. B., J. H. C. Cornelissen, and R. D. Bardgett. 2008. Plant functional traits and soil carbon sequestration in contrasting biomes. Ecology Letters 11:516–31. doi:10.1111/j.1461-0248.2008.01164.x.
- Douma, J. C., M. T. Van Wijk, S. I. Lang, and G. R. Shaver. 2007. The contribution of mosses to the carbon and water exchange of arctic ecosystems: Quantification and relationships with system properties. Plant, Cell & Environment 30 (10):1205–15. doi:10.1111/j.1365-3040.2007.01697.x.
- Enquist, B. J., J. Norberg, S. P. Bonser, C. Violle, C. T. Webb, A. Henderson, L. L. Sloat, and V. M. Savage. 2015. Scaling from traits to ecosystems: Developing a general trait driver theory via integrating trait-based and metabolic scaling theories. Advances in Ecological Research, vol. 52, pp. 249–318.
- Epstein, H. E., U. S. Bhatt, M. K. Raynolds, D. A. Walker, B. C. Forbes, T. Horstkotte, M. Macias-Fauria, A. Martin, G. Phoenix, J. Bjerke, et al. 2015. Tundra greenness. NOAA. Accessed April 27, 2018.
- Eskelinen, A., S. Stark, and M. Männistö. 2009. Links between plant community composition, soil organic matter quality and microbial communities in contrasting tundra habitats. Oecologia 161 (1):113–23. doi:10.1007/s00442-009-1362-5.
- Garnier, E., J. Cortez, G. Billès, M.-L. Navas, C. Roumet, M. Debussche, G. Laurent, A. Blanchard, D. Aubry, A. Bellmann, et al. 2004. Plant functional markers capture ecosystem properties during secondary succession. Ecology 85 (9):2630–37. doi:10.1890/03-0799.
- Garnier, E., M. Navas, and K. Grigulis. 2016. Plant functional diversity organism traits, community structure, and ecosystem properties. 1st ed. Oxford: Oxford University Press.
- German, D. P., S. S. Chacon, and S. D. Allison 2011. Substrate concentration and enzyme allocation can affect rates of microbial decomposition. Ecology 92 (7):1471–80. doi:10.1890/10-2028.1.
- Goodall, D. 1952. Some considerations in the use of point quadrats for the analysis of vegetation. Australian Journal of Biological Sciences 5:1–41. doi:10.1071/BI9520001.
- Gould, W. A., M. Raynolds, and D. A. Walker. 2003. Vegetation, plant biomass, and net primary productivity patterns in the Canadian Arctic. Journal of Geophysical Research: Atmospheres 108:D2. doi:10.1029/2001JD000948.
- Graae, B. J., P. De Frenne, A. Kolb, J. Brunet, O. Chabrerie, K. Verheyen, N. Pepin, T. Heinken, A. Zobel, A. Shevtsova, I. Nijs, and A. Milbau. 2012. On the use of weather data in ecological studies along altitudinal and latitudinal gradients. Oikos 121:3–19.
- Grime, J. P. 1998. Benefits of plant diversity to ecosystems: immediate, filter and founder effects. Journal of Ecology 86 (6):902–10. doi:10.1046/j.1365-2745.1998.00306.x.
- Grogan, P., and S. Jonasson. 2006. Ecosystem CO2 production during winter in a Swedish subarctic region: The relative importance of climate and vegetation type. Global Change Biology 12 (8):1479–95. doi:10.1111/j.1365-2486.2006.01184.x.
- Grueber, C. E., S. Nakagawa, R. J. Laws, and I. G. Jamieson. 2011. Multimodel inference in ecology and evolution: Challenges and solutions. Journal of Evolutionary Biology 24 (4):699–711. doi:10.1111/j.1420-9101.2010.02210.x.
- Hanssen-Bauer, I., E. J. Førland, I. Haddeland, H. Hisdal, S. Mayer, A. Nesje, J. E. Ø. Nilsen, S. Sandven, A. B. Sandø, A. Sorteberg, et al. 2015. Klima i Norge 2100. Miljødirektoratet.
- Hernández, D. L., and S. E. Hobbie. 2010. The effects of substrate composition, quantity, and diversity on microbial activity. Plant and Soil 335 (1):397–411. doi:10.1007/s11104-010-0428-9.
- Hodgson, J. G., G. Montserrat-Martí, M. Charles, G. Jones, P. Wilson, B. Shipley, M. Sharafi, B. E. L. Cerabolini, J. H. C. Cornelissen, S. R. Band, et al. 2011. Is leaf dry matter content a better predictor of soil fertility than specific leaf area? Annals of Botany 108 (7):1337–45. doi:10.1093/aob/mcr225.
- Hodgson, J. M. 1997. Soil survey field handbook, Edited by J. M. Hodgson 3rd. Technical monograph No. 5. Silsoe: Cranfield University.
- Illeris, L., A. Michelsen, and S. Jonasson. 2003. Soil plus root respiration and microbial biomass following water, nitrogen, and phosphorus application at a high arctic semi desert. Biogeochemistry 65 (1):15–29. doi:10.1023/A:1026034523499.
- Iversen, C. M., V. L. Sloan, P. F. Sullivan, E. S. Euskirchen, A. David McGuire, R. J. Norby, A. P. Walker, J. M. Warren, and S. D. Wullschleger. 2015. The unseen iceberg: Plant roots in arctic tundra. New Phytologist 205 (1):34–58. doi:10.1111/nph.13003.
- Jasoni, R. L., S. D. Smith, and J. A. Arnone III. 2005. Net ecosystem CO2 exchange in Mojave Desert shrublands during the eighth year of exposure to elevated CO2. Global Change Biology 11:749–56. doi:10.1111/gcb.2005.11.issue-5.
- Jonsson, M., P. Kardol, M. Gundale, S. Bansal, M.-C. Nilsson, D. B. Metcalfe, and D. A. Wardle. 2015. Direct and indirect drivers of moss community structure, function, and associated microfauna across a successional gradient. Ecosystems 18 (1):154–69. doi:10.1007/s10021-014-9819-8.
- Karhu, K., M. D. Auffret, J. A. J. Dungait, D. W. Hopkins, J. I. Prosser, B. K. Singh, J. A. Subke, P. A. Wookey, G. I. Agren, M. T. Sebastia, et al. 2014. Temperature sensitivity of soil respiration rates enhanced by microbial community response. Nature 513:81. doi:10.1038/nature13604.
- Klumpp, K., and J. Soussana. 2009. Using functional traits to predict grassland ecosystem change: A mathematical test of the response‐and‐effect trait approach. Global Change Biology 15 (12):2921–34. doi:10.1111/j.1365-2486.2009.01905.x.
- Knowles, R. D., J. Pastor, and D. D. Biesboer. 2006. Increased soil nitrogen associated with dinitrogen‐fixing, terricolous lichens of the genus Peltigera in northern Minnesota. Oikos 114 (1):37–48. doi:10.1111/j.2006.0030-1299.14382.x.
- Körner, C. 2003. Alpine plant life: Functional plant ecology of high mountain ecosystems, 121–48. Berlin Heidelberg: Springer-Verlag.
- Lavorel, S. 2012. Plant functional effects on ecosystem services. Journal of Ecology 101 (1):4–8. doi:10.1111/1365-2745.12031.
- Lavorel, S., and E. Garnier. 2002. Predicting changes in community composition and ecosystem functioning from plant traits: Revisiting the Holy Grail. Functional Ecology 16:545–56. doi:10.1046/j.1365-2435.2002.00664.x.
- Lindahl, B. D., and A. Tunlid. 2015. Ectomycorrhizal fungi – Potential organic matter decomposers, yet not saprotrophs. New Phytologist 205 (4):1443–47. doi:10.1111/nph.13201.
- Makarov, M. I., B. Glaser, W. Zech, T. I. Malysheva, I. V. Bulatnikova, and A. V. Volkov. 2003. Nitrogen dynamics in alpine ecosystems of the northern Caucasus. Plant and Soil 256 (2):389–402. doi:10.1023/A:1026134327904.
- Mann, D. H., D. M. Peteet, R. E. Reanier, and M. L. Kunz. 2002. Responses of an arctic landscape to Lateglacial and early Holocene climatic changes: The importance of moisture. Quaternary Science Reviews 21 (8):997–1021. doi:10.1016/S0277-3791(01)00116-0.
- Martin, A. C., E. S. Jeffers, G. Petrokofsky, I. Myers-Smith, and M. Macias Fauria. 2017. Shrub growth and expansion in the Arctic tundra: An assessment of controlling factors using an evidence-based approach. Environmental Research Letters 12:8. doi:10.1088/1748-9326/aa7989.
- Michaletz, S. T., A. J. Kerkhoff, and B. J. Enquist. 2018. Drivers of terrestrial plant production across broad geographical gradients. Global Ecology and Biogeography 27 (2):166–74. doi:10.1111/geb.12685.
- Michelsen, A., C. Quarmby, D. Sleep, and S. Jonasson. 1998. Vascular plant 15N natural abundance in heath and forest tundra ecosystems is closely correlated with presence and type of mycorrhizal fungi in roots. Oecologia 115 (3):406–418.
- Moen, A. 1998. Nasjonalatlas for Norge: Vegetasjon. Hønefoss: Statens Kartverk.
- Molau, U., and J. M. Alatalo. 1998. Responses of subarctic-alpine plant communities to simulated environmental change: Biodiversity of bryophytes, lichens, and vascular plants. Ambio 27 (4):322–28.
- Moore, J. A. M., J. Jiang, C. M. Patterson, M. A. Mayes, G. Wang, and A. T. Classen. 2015. Interactions among roots, mycorrhizas and free‐living microbial communities differentially impact soil carbon processes. Journal of Ecology 103 (6):1442–53. doi:10.1111/1365-2745.12484.
- Myers-Smith, I. H., B. C. Forbes, M. Wilmking, M. Hallinger, T. Lantz, D. Blok, K. D. Tape, M. Macias-Fauria, U. Sass-Klaassen, L. Lévesque, et al. 2011. Shrub expansion in tundra ecosystems: Dynamics, impacts and research priorities. Environmental Research Letters 6:1–15. doi:10.1088/1748-9326/6/4/045509.
- Myers-Smith, I. H., and D. S. Hik. 2013. Shrub canopies influence soil temperatures but not nutrient dynamics: An experimental test of tundra snow-shrub interactions. Ecology and Evolution 3 (11):3683–700. doi:10.1002/ece3.710.
- Myers-Smith, I. H., S. C. Elmendorf, P. S. A. Beck, M. Wilmking, M. Hallinger, D. Blok, K. D. Tape, S. A. Rayback, M. Macias-Fauria, B. C. Forbes, et al. 2015. Climate sensitivity of shrub growth across the tundra biome. Nature Climate Change 5:887. doi:10.1038/nclimate2697.
- Naito, A. T., and D. M. Cairns. 2011. Patterns and processes of global shrub expansion. Progress in Physical Geography 35 (4):423–42. doi:10.1177/0309133311403538.
- New, M., M. Hulme, and P. D. Jones. 2000. Global 30-year mean monthly climatology, 1961–1990. Oak Ridge National Laboratory Distributed Active Archive Center, Oak Ridge, Tennessee, U.S.A. http://daac.ornl.gov.
- NGU. 2015. Norges Geologiske Undersøkelse: Berggrunn N250 og Løsmasse N50. Norges Geologiske Undersøkelse. Accessed May 2015. http://geo.ngu.no/kart/kartkatalog/.
- Normand, S., T. T. Høye, B. C. Forbes, J. J. Bowden, A. L. Davies, B. V. Odgaard, F. Riede, J.-C. Svenning, U. A. Treier, R. Willerslev, and J. Wischnewski. 2017. Legacies of historical human activities in arctic woody plant dynamics. Annual Review of Environment and Resources 42 (1):541–567. doi:10.1146/annurev-environ-110615-085454.
- Parker, T. C., J. A. Subke, and P. A. Wookey. 2015. Rapid carbon turnover beneath shrub and tree vegetation is associated with low soil carbon stocks at a subarctic treeline. Global Change Biology 21 (5):2070–81. doi:10.1111/gcb.12793.
- Pérez-Harguindeguy, N., S. Díaz, E. Garnier, S. Lavorel, H. Poorter, P. Jaureguiberry, M. S. Bret-Harte, W. K. Cornwell, J. M. Craine, D. E. Gurvich, et al. 2013. New handbook for standardised measurement of plant functional traits worldwide. Australian Journal of Botany 61 (3):167–234. doi:10.1071/BT12225.
- Phillips, R. P., E. Brzostek, and M. G. Midgley. 2013. The mycorrhizal‐associated nutrient economy: A new framework for predicting carbon–nutrient couplings in temperate forests. New Phytologist 199 (1):41–51. doi:10.1111/nph.12221.
- Post, E., and C. Pedersen. 2008. Opposing plant community responses to warming with and without herbivores. Proceedings of the National Academy of Sciences 105:12353–58. doi:10.1073/pnas.0802421105.
- Questad, H., O. Eriksson, C. Fortunel, and E. Garnier. 2007. Plant traits relate to whole‐community litter quality and decomposition following land use change. Functional Ecology 21 (6):1016–26. doi:10.1111/j.1365-2435.2007.01324.x.
- R Core Team. 2017. R: A language and environment for statistical computing. R Foundation for Statistical Computing. https://www.R-project.org/.
- Ravolainen, V. T., K. A. Bråthen, R. A. Ims, N. G. Yoccoz, J. Henden, and S. T. Killengreen. 2011. Rapid, landscape scale responses in riparian tundra vegetation to exclusion of small and large mammalian herbivores. Basic and Applied Ecology 12:643–53. doi:10.1016/j.baae.2011.09.009.
- Read, D. J., and J. Perez-Moreno. 2003. Mycorrhizas and nutrient cycling in ecosystems – A journey towards relevance? New Phytologist 157 (3):475–92. doi:10.1046/j.1469-8137.2003.00704.x.
- Sancho, L. G., J. Belnap, C. Colesie, J. Raggio, and B. Weber. 2016. Carbon budgets of biological soil crusts at micro-, meso-, and global scales. In Biological soil crusts: An organizing in principle in drylands, ed. B. Weber, B. Büdel, and J. Belnap, 287–304. Cham: Springer.
- Schinner, F. 1983. Litter decomposition, CO2-release and enzyme activities in a snowbed and on a windswept ridge in an alpine environment. Oecologia 59 (2):288–91. doi:10.1007/BF00378850.
- Settele, J., R. Scholes, R. Betts, S. E. Bunn, P. Leadley, D. Nepstad, J. T. Overpeck, and M. A. Taboada. 2014. Terrestrial and inland water systems. Climate change 2014: Impacts, adaptation, and vulnerability. Part A: Global and sectoral aspects. Contribution of working group II to the fifth assessment report of the intergovernmental panel of climate change, 271–359. New York: Cambridge University Press.
- Sinsabaugh, R. L., D. L. Moorhead, and A. E. Linkins. 1994. The enzymic basis of plant litter decomposition: Emergence of an ecological process. Applied Soil Ecology 1 (2):97–111. doi:10.1016/0929-1393(94)90030-2.
- Sjögersten, S., and P. A. Wookey. 2009. The impact of climate change on ecosystem carbon dynamics at the Scandinavian mountain birch forest–tundra heath ecotone. AMBIO: A Journal of the Human Environment 38 (1):2–10. doi:10.1579/0044-7447-38.1.2.
- Sjögersten, S., R. van der Wal, and S. Woodin. 2006. Small-scale hydrological variation determines landscape CO2 fluxes in the high Arctic. Biogeochemistry 80 (3):205–16. doi:10.1007/s10533-006-9018-6.
- Sonesson, M., F. E. Wielgolaski, and P. Kallio. 1975. Description of Fennoscandian tundra ecosystems. In Fennoscandian Tundra Ecosystems, ed. E. E. Wielgolaski, 3–28. Berlin: Springer-Verlag.
- Sørensen, M. V., B. J. Graae, D. Hagen, B. J. Enquist, K. O. Nystuen, and R. Strimbeck. 2018. Experimental herbivore exclusion, shrub introduction, and carbon sequestration in alpine plant communities. BMC Ecology 18–29. doi:10.1186/s12898-018-0185-9.
- Sørensen, M. V., R. Strimbeck, K. O. Nystuen, R. E. Kapas, B. J. Enquist, and B. J. Graae. 2017. Draining the pool? Carbon storage and fluxes in three alpine plant communities. Ecosystems. doi:10.1007/s10021-017-0158-4.
- Soudzilovskaia, N. A., M. G. A. van der Heijden, J. H. C. Cornelissen, M. I. Makarov, V. G. Onipchenko, M. N. Maslov, A. A. Akhmetzhanova, and P M. van Bodegom. 2015. Quantitative assessment of the differential impacts of arbuscular and ectomycorrhiza on soil carbon cycling. New Phytologist 208 (1):280–293. doi:10.1111/nph.13447.
- Speed, J. D. M., G. Austrheim, A. J. Hester, and A. Mysterud. 2013. The response of alpine Salix shrubs to long-term browsing varies with elevation and herbivore density. Arctic, Antarctic, and Alpine Research 45 (4):584–93. doi:10.1657/1938-4246-45.4.584.
- Stark, S., and M. Väisänen. 2014. Insensitivity of soil microbial activity to temporal variation in soil N in subarctic tundra: Evidence from responses to large migratory grazers. Ecosystems 17 (5):906–17. doi:10.1007/s10021-014-9768-2.
- Stone, M. M., J. L. DeForest, and A. F. Plante. 2014. Changes in extracellular enzyme activity and microbial community structure with soil depth at the Luquillo Critical Zone Observatory. Soil Biology and Biochemistry 75:237–47. doi:10.1016/j.soilbio.2014.04.017.
- Street, L. E., G. R. Shaver, M. Williams, and M. T. van Wijk. 2007. What is the relationship between changes in canopy leaf area and changes in photosynthetic CO2 flux in arctic ecosystems? Journal of Ecology 95:139–50. doi:10.1111/jec.2007.95.issue-1.
- Strimbeck, R., B. J. Graae, S. Lang, and M. V. Sørensen. 2019. Functional group contributions to carbon fluxes in arctic-alpine ecosystems. Arctic, Antarctic, and Alpine Research 51 (1):58–68. doi:10.1080/15230430.2019.1578163.
- Sturm, M., J. Schimel, G. Michaelson, J. M. Welker, S. F. Oberbauer, G. E. Liston, J. Fahnestock, and V. E. Romanovsky. 2005. Winter biological processes could help convert arctic tundra to shrubland. Bioscience 55 (1):17–26. doi:10.1641/0006-3568(2005)055[0017:wbpchc]2.0.co;2.
- Sturm, M., J. P. McFadden, G. E. Liston, F. S. Chapin, C. H. Racine, and J. Holmgren. 2001. Snow-shrub interactions in Arctic tundra: A hypothesis with climatic implications. Journal of Climate 14 (3):336–44. doi:10.1175/1520-0442(2001)014<0336:ssiiat>2.0.co;2.
- Sundqvist, M. K., R. Giesler, B. J. Graae, H. Wallander, E. Fogelberg, and D. A. Wardle. 2011. Interactive effects of vegetation type and elevation on aboveground and belowground properties in a subarctic tundra. Oikos 120 (1):128–42. doi:10.1111/j.1600-0706.2010.18811.x.
- Talbot, J. M., S. D. Allison, and K. K. Treseder. 2008. Decomposers in disguise: Mycorrhizal fungi as regulators of soil C dynamics in ecosystems under global change. Functional Ecology 22 (6):955–63. doi:10.1111/j.1365-2435.2008.01402.x.
- Tape, K., M. Sturm, and C. Racine. 2006. The evidence for shrub expansion in Northern Alaska and the Pan-Arctic. Global Change Biology 12 (4):686–702. doi:10.1111/j.1365-2486.2006.01128.x.
- Tarnocai, C., J. G. Canadell, E. A. G. Schuur, P. Kuhry, G. Mazhitova, and S. Zimov. 2009. Soil organic carbon pools in the northern circumpolar permafrost region. Global Biogeochemical Cycles 23 (2):GB2023. doi:10.1029/2008GB003327.
- Tjoelker, M. G., J. Oleksyn, and P. B. Reich. 2001. Modelling respiration of vegetation: Evidence for a general temperature‐dependent Q10. Global Change Biology 7 (2):223–30. doi:10.1046/j.1365-2486.2001.00397.x.
- Tømmervik, H., B. Johansen, J. Å. Riseth, S. R. Karlsen, B. Solberg, and K. A. Høgda. 2009. Above ground biomass changes in the mountain birch forests and mountain heaths of Finnmarksvidda, northern Norway, in the period 1957–2006. Forest Ecology and Management 257:244–57. doi:10.1016/j.foreco.2008.08.038.
- Väre, H., M. Vestberg, and S. Eurola. 1992. Mycorrhiza and root-associated fungi in Spitsbergen. Mycorrhiza 1 (3):93–104. doi:10.1007/BF00203256.
- Veen, C. G. F., M. K. Sundqvist, and D. A. Wardle. 2015. Environmental factors and traits that drive plant litter decomposition do not determine home-field advantage effects. Functional Ecology 29 (7):1365–2435. doi:10.1111/1365-2435.12421.
- Violle, C., M. Navas, D. Vile, E. Kazakou, C. Fortunel, I. Hummel, and E. Garnier. 2007. Let the concept of trait be functional!. Oikos 116:882–92. doi:10.1111/oik.2007.116.issue-5.
- Virkkala, A.-M., T. Virtanen, A. Lehtonen, J. Rinne, and M. Luoto. 2017. The current state of CO2 flux chamber studies in the Arctic tundra: A review. Progress in Physical Geography: Earth and Environment 42 (2):162–84. doi:10.1177/0309133317745784.
- Wallander, H., H. Göransson, and U. Rosengren. 2004. Production, standing biomass and natural abundance of 15N and 13C in ectomycorrhizal mycelia collected at different soil depths in two forest types. Oecologia 139 (1):89–97. doi:10.1007/s00442-003-1477-z.
- Wardle, D. A., R. D. Bardgett, J. N. Klironomos, H. Setälä, W. H. van der Putten, and D. H. Wall. 2004. Ecological linkages between aboveground and belowground biota. Science 304 (5677):1629–33. doi:10.1126/science.1094875.
- Westergaard-Nielsen, A., M. Lund, S. H. Pedersen, N. M. Schmidt, S. Klosterman, J. Abermann, and B. U. Hansen. 2017. Transitions in high-Arctic vegetation growth patterns and ecosystem productivity tracked with automated cameras from 2000 to 2013. AMBIO: A Journal of the Human Environment 46 (suppl. 1):39-52. doi:10.1007/s13280-016-0864-8.
- Williams, M., L. E. Street, M. T. van Wijk, and G. R. Shaver. 2006. Identifying differences in carbon exchange among arctic ecosystem types. Ecosystems 9 (2):288–304. doi:10.1007/s10021-005-0146-y.
- Wilmking, M., J. Harden, and K. Tape. 2006. Effect of tree line advance on carbon storage in NW Alaska. Journal of Geophysical Research: Biogeosciences 111 (G2):G02023. doi:10.1029/2005JG000074.
- Wookey, P. A., R. Aerts, R. D. Bardgett, F. Baptist, K. A. Bråthen, J. H. C. Cornelissen, L. Gough, I. P. Hartley, D. W. Hopkins, S. Lavorels, et al. 2009. Ecosystem feedbacks and cascade processes: Understanding their role in the responses of Arctic and alpine ecosystems to environmental change. Global Change Biology 15:1153–72. doi:10.1111/j.1365-2486.2008.01801.x.
- Wright, I. J., P. B. Reich, M. Westoby, D. D. Ackerly, Z. Baruch, F. Bongers, J. Cavender-Bares, T. Chapin, J. H. C. Cornelissen, M. Diemer, et al. 2004. The worldwide leaf economics spectrum. Nature 428:821–27. doi:10.1038/nature02403.