
 ?Mathematical formulae have been encoded as MathML and are displayed in this HTML version using MathJax in order to improve their display. Uncheck the box to turn MathJax off. This feature requires Javascript. Click on a formula to zoom.
ABSTRACT
Understanding the driving forces for alpine vegetation variations at different permafrost degrading stages is important when the Tibetan Plateau is experiencing climate warming. We applied the modified Frost Number model to simulate frozen ground distributions in the Tibetan Plateau and calculated the maximum thawing depth by the Stefan approach. We classified the simulated frozen ground into three subzones: seasonal frozen ground zone, changing zone, and permafrost zone. We evaluated the effects of precipitation, air temperature, and maximum thawing depth on Normalized Difference Vegetation Index (NDVI) in the subzones across five different stages from 1982 to 2012. The results show that permafrost zone, changing zone, and seasonal frozen ground zone account for about 30.6 percent, 23.3 percent, and 46.1 percent of the study area, respectively. Over the five stages, permafrost areas decreased at fast, slow, fastest, and then slowest rate from stage1 to stage 5, and the large continuous permafrost area has been degraded into pieces. Precipitation is strongly correlated with NDVI and contributes most `to the changes of NDVI. Maximum thawing depth and particularly air temperature show a much smaller correlation and contribute less to the variation rate of NDVI. The findings will have broad applications in investigating the impact of climate and environment changes on alpine vegetation variations in the Tibetan Plateau.
Introduction
Permafrost, the frozen ground at low temperature below 0 °C for ≥2 years (Muller Citation1947), is highly sensitive to climate change and surface disturbances, especially to air temperature changes (Li et al. Citation2008; Yang et al. Citation2010). Permafrost in the Tibetan Plateau, approximately accounting for 53 percent of the plateau area, is the world’s highest altitude and largest frozen ground region in low latitude (Cheng et al. Citation2012). Compared with high-latitude permafrost, permafrost in the Tibetan Plateau is warmer and shallower (Wu and Zhang Citation2008; Wu, Zhang, and Liu Citation2010; Yang et al. Citation2010). Therefore, permafrost in the Tibetan Plateau is more sensitive to air temperature changes and it is considered the key indicator for climate and environment changes (Wang et al. Citation2016). During recent decades, a significant climate warming occurred on the Tibetan Plateau and the increase in temperature came earlier and faster than in other parts of China (Pan and Li Citation1996; Liu and Chen Citation2000; Wang et al. Citation2000; Cheng and Wu Citation2007; Wu and Zhang Citation2010; Kuang and Jiao Citation2016; Lu, Zhao, and Wu Citation2017). The increasing temperature on the Tibetan Plateau resulted in permafrost thawing, which is confirmed by both site observation data (Lemke et al. Citation2007; Wu and Zhang Citation2010) and numerical modeling (Li et al. Citation2008; Cheng et al. Citation2012; Nan et al. Citation2012; Nan, Huang, and Zhao Citation2013; Lu, Zhao, and Wu Citation2017). The permafrost degradation is mainly characterized by a reduction in areal extent of permafrost occurrence and active layer deepening (Jin et al. Citation2009; Xue et al. Citation2009; Wu and Zhang Citation2010).
Studying the changes of permafrost in the Tibetan Plateau has become an important issue. Although field observations can provide more realistic and accurate data, these data are hard to obtain because of the harsh environment. Numerical simulations make it possible to study the temporal and spatial variations of permafrost. Different models have been applied in the Tibetan Plateau, such as the Altitude model (Li and Cheng Citation1999), the MAGT (mean annual ground temperature) model (Nan, Shuxun, and Yongzhi Citation2002), the Frost Number model (Nan et al. Citation2012; Lu, Zhao, and Wu Citation2017), the TTOP (temperature at the top of permafrost) model (Smith and Riseborough Citation1996) and the CLM (community land model) model (Guo, Wang, and Li Citation2012; Guo and Wang Citation2013; Guo, Wang, and Wang Citation2017). The Frost Number model has been widely applied in many regions (Lu, Zhao, and Wu Citation2017). Though many models have been used to simulate the distribution of permafrost in the Tibetan Plateau, they are mainly focused on its current and future distributions. Few models provided the evolution of permafrost, and none of them outlined a degrading permafrost zone in the Tibetan Plateau. Until now, the distribution and evolution of degrading permafrost on the plateau are still unknown.
Degradation of permafrost and its subsequent effects on the ecological environment have attracted attention from many scientists. Considering that the Tibetan Plateau is a cold and arid region, some studies regard precipitation and temperature as the two main factors controlling vegetation changes (Pang, Wang, and Yang Citation2016; Zhang et al. Citation2016). However, the changes in permafrost conditions have significant impacts on ecosystems (Yang et al. Citation2010). Yi et al. (Citation2011) suggested that climate warming might promote the expansion of alpine grassland in permafrost regions. Other studies suggest that permafrost degradation is responsible for the environmental deterioration and grassland degeneration (Wang et al. Citation2006; Yang et al. Citation2010; Zhou et al. Citation2015). The thawing of permafrost results in a lowering of the water table, thus leading to degradation of alpine grassland (Cheng and Wu Citation2007; Wang et al. Citation2008). The increase in the thickness of active layer will affect the alpine ecosystem (Wu et al. Citation2015), and the response of vegetation to frozen ground degradation vary spatially with the change rate of the frozen ground depth (Qin et al. Citation2017). In general, permafrost ecosystems are fragile, and the relationship between vegetation and permafrost is complicated (Yang et al. Citation2010); therefore, studies at different spatial scales or different places may reach different conclusions.
There is a lack of long-term observations in dynamics of the alpine ecosystem during permafrost degradation (Yang et al. Citation2010). Only a few studies have been conducted to quantitatively identify the main drivers to vegetation changes (Zhang et al. Citation2016). Until now, it remains unclear whether permafrost and seasonally frozen ground degradation make a positive contribution (Cuo et al. Citation2015; Qin et al. Citation2016) or negative contribution (Jin et al. Citation2009; Iijima et al. Citation2014) to vegetation growth. It is important to reveal the impacts of permafrost degradation on vegetation variations in the Tibetan Plateau.
The objective of this study is to analyze the contributions of driving factors to alpine vegetation variations in different stages of frozen ground degradation. This study simulated the frozen ground distributions by employing the modified Frost Number model and divided the frozen ground into seasonal frozen ground zone, changing zone, and permafrost zone. The simulation period from 1982 to 2012 was divided into five typical stages based on the Normalized Difference Vegetation Index (NDVI) variations. We quantitatively analyzed the relations between precipitation, temperature, the maximum thawing depth, and NDVI in the subzones. We also investigated the contributions of these factors to the annual variation rate of NDVI in different stages and different zones.
Materials and methods
Study area
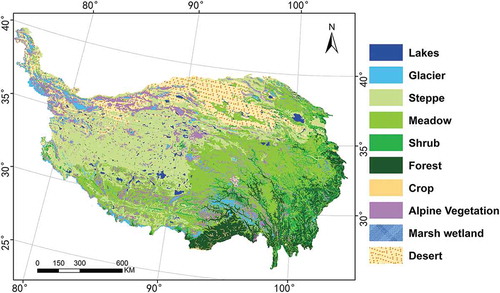
The Tibetan Plateau, considered to be Earth’s third pole and located in western China (), has an average altitude of above 4,000 m sea level and covers an area of about 2.57 × 10⁶ km2 (Zhong et al. Citation2010). Climate on the Tibetan Plateau is characterized by strong solar radiation, low air temperature, high daily temperature differences, and low annual temperature differences (Zhong et al. Citation2010). Mean annual air temperatures range from −10 to 10 °C (Sun, Miao, and Duan Citation2015; Kuang and Jiao Citation2016) and mean annual precipitation ranges from <50 mm to >1,000 mm from the northwest to the southeast (Ding et al. Citation2016; Kuang and Jiao Citation2016). Precipitation on the Tibetan Plateau occurs mainly in the summer. Alpine permafrost is widely distributed in the central region of the plateau (Cheng and Jin Citation2013). From southeast to northwest of the plateau, the NDVI values decrease gradually (). Forests and shrubs in the southeast are linked to NDVI values mainly >0.7, while meadows and steppes in the middle are linked to NDVI values mainly >0.5 ( and ). In the northwest, the low NDVI values are desert ( and ). Most of the plateaus are arid and cold, and covered by alpine vegetation. Temperature and moisture conditions at the biological limitation level make the ecosystem highly sensitive to climate or environment changes (Kato et al. Citation2004; Piao et al. Citation2011; Gao et al. Citation2013).
Figure 1. Location of the Tibetan Plateau (a) and distribution of the average annual maximum NDVI for 31 years during 1982 to 2012 (b). Topography of the Chinese mainland is derived from a digital elevation model (http://srtm.csi.cgiar.org).
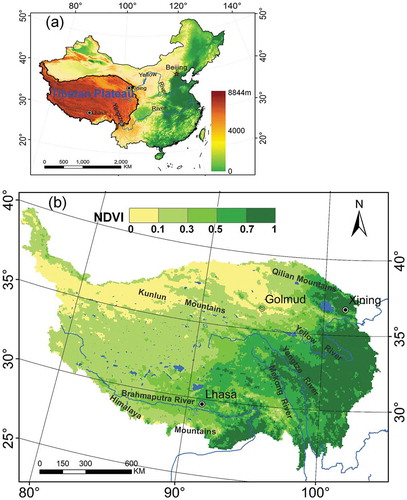
Figure 2. Vegetation type maps based on the Vegetation Map of China.
Data and processing
Climatic data
Daily average ground surface temperature from 78 standard meteorological stations on the Tibetan Plateau over 1982–2012 was used. Monthly gridded precipitation and air temperature, which are based on the precipitation and air temperature records of 2,472 national meteorological stations and were interpolated using ANUSPLIN developed by the Australian National University (Hutchinson and Xu Citation2004), were also used in this study. Data assessment shows that each of the gridded box series is highly correlated with the original observational series with a small error (NMIC Citation2012). Therefore, the gridded values can be used to reflect the variations of precipitation. All temperature and precipitation data are provided by the China Meteorological Administration (CMA) and the National Meteorological Information Center (NMIC) (https://data.cma.cn).
Remote sensing data
Remote sensing has the potential to detect and monitor changes of alpine vegetation at a variety of spatial and temporal scales (Stow et al. Citation2004). NDVI, which is the most widely used index, is frequently used to assess spatiotemporal changes in vegetation dynamics (Purevdorj et al. Citation1998; Nemani et al. Citation2003; Liang et al. Citation2012). In this study, the latest version of Global Inventory Modeling and Mapping Studies (GIMMS) NDVI3g from 1981 to 2012 (https://ecocast.arc.nasa.gov) was used. The GIMMS NDVI3g has been widely used to study vegetation at global and regional scales because of long time series, wide extent of observation, and short satellite revisit time (Liang et al. Citation2012; Piao et al. Citation2015). The dataset was provided at a spatial resolution of 1/12 degree and a 15-day temporal resolution. The product was carefully assembled from different advanced very high resolution radiometer (AVHRR) sensors, removing several satellite errors such as calibration loss, orbit drift, and some special environmental effects like volcanic eruptions (Holben Citation1986; Pinzon and Tucker Citation2014). We also obtained the largest annual NDVI value for each pixel in the region using the maximum-value composite method (Holben Citation1986) to reduce the influence of clouds and atmospheric constituents (Hope et al. Citation2003; Stow et al. Citation2004; Bao et al. Citation2014). The NDVI used are peak growing season values.
The Moderate Resolution Imaging Spectroradiometer (MODIS) Land Cover Type product (MCD12Q1) was used to screen barren or sparsely vegetated pixels (Friedl et al. Citation2002, Citation2010). The International Geosphere Biosphere Program (IGBP) classification scheme was used with MCD12Q1 imagery. Areas that were barren or sparsely vegetated from 2001 have not been analyzed ().
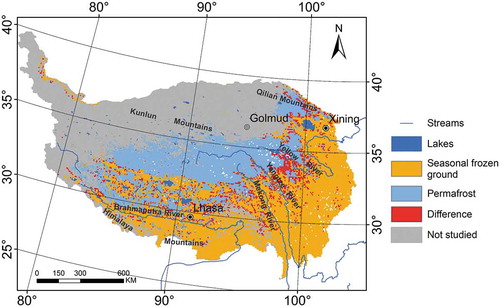
Figure 3. The difference map between the simulated frozen ground area and the map of permafrost in the Tibetan Plateau, 1:3,000,000 (Li and Cheng Citation1996). Provided by http://westdc.westgis.ac.cn.
Methods
Temporal and spatial variation of ground surface temperature
Gridded mean annual ground surface temperature (MAGST) is based on daily average ground surface temperature records from 78 national meteorological stations. As most of the meteorological stations are distributed in the eastern part of the Tibetan Plateau, the sparse distribution of the meteorological stations on the west of the Tibetan Plateau has a large effect on the precision of the MAGST data. To improve accuracy, the gridded MAGST is interpolated using linear multiple regression (Wang, Nan, and Zhao Citation2011). The regression model between MAGST and topographical factors (altitude, latitude, and longitude) is as follows:
where MAGSTsim is the simulation result, MAGSTobs is the observation data from 78 national meteorological stations; b1, b2, and b3 are the multiple regression coefficients; d is the regression constant; is the residual value; and
interp is the grid residual value, which is interpolated by the Kriging method for the entire plateau.
Frost number model
The Frost Number model (Nelson and Outcalt Citation1987), a statistical-empirical model, is able to simulate and predict frozen ground distributions and has been applied successfully in many regions (Lu, Zhao, and Wu Citation2017). In this article, the modified Frost Number model was used, a new variable E is introduced to explicitly reflect the thermal effects of frozen and thawed states (Nelson and Outcalt Citation1987; Nan et al. Citation2012). Previous studies found that this model can depict the major characteristics of frozen ground distributions over the Tibetan Plateau (Nan et al. Citation2012; Ran et al. Citation2015; Lu, Zhao, and Wu Citation2017).
where F is the surface Frost Number and a threshold value of 0.5 was used to distinguish between permafrost and seasonal frozen ground (Nan et al. Citation2012; Ran et al. Citation2015; Lu, Zhao, and Wu Citation2017), F ≥0.5 and <0.5 are considered as permafrost and seasonal frozen ground, respectively; DDF and DDT are the ground surface freezing and thawing indices and defined by the degree-day totals above or below 0 °C, respectively, expressed in degree-days; E is the calibrated factor; subscript t and f are thaw soil and frozen soil; λ is thermal conductivity (W·m−1·°C−1); Q is the absorbed or released heat (kJ·m−3), Q = L·γ·θ, in which L is the mass-based latent heat of fusion or freeze (J·kg−1); γ is the unit weight of soil (kg·m−3); θ is the average liquid soil water content of the frozen ground (m3·m−3).
The Stefan solution (Stefan Citation1891; Jumikis Citation1977; Lunardini Citation1981) was applied to estimate maximum thawing depth. It is considered to be maximum thawing depth in the permafrost zone, while in other zones are considered to be maximum freezing depth, which is expressed as follows:
Contribution of different factors to NDVI variations
We choose precipitation (P), air temperature (T), and maximum thawing depth (D) as the main factors influencing NDVI variations. The similar approach is used to separate the contribution of different factors to variation of evaporation (Rana and Katerji Citation1998; Yang and Yang Citation2012; Zhang et al. Citation2016).
where slope is the annual variation rate of NDVI. We calculate slope by a simple linear regression (Edwards Citation1984). C(P), C(T), and C(D) are the contributions of precipitation, air temperature, and thawing depth to the annual variation rate of NDVI, respectively, n is the number of years. OF is the residual contribution. OF may contain human factors and some other uncertain natural factors such as solar radiation and humidity. ∂NDVI/∂P, ∂NDVI/∂T and ∂NDVI/∂D are the slope of the linear regression line between the annual variation rate of NDVI and precipitation, air temperature, and thawing depth, respectively. ∂P/∂n, ∂T/∂n, and ∂D/∂n are the slope of the linear regression line between n and precipitation, air temperature, and thawing depth, respectively.
Mann–Kendall trend analysis
The Mann–Kendall trend test (Mann Citation1945; Kendall Citation1948) is one of the widely used non-parametric tests to detect significant trends in time series. To detect the existence of any step change points in a time series xt = (x1, x2, x3, …xn), the Mann–Kendall rank statistic dk is calculated as following:
where mi is the number of later terms in the series whose values exceed xi .
The mean and variance of the normally distributed statistic dk are given by
The normalized variable statistic UF(dk) is estimated by the following formula:
The retrogressive variable statistic UB(dk) (backward sequence) is also calculated with Eq. (11) but with a reversed series of the data. The intersection of the forward and backward curves statistics UF(dk) and UB(dk) indicates the beginning of the step change point (Partal and Kahya Citation2006; Ye et al. Citation2013; Wang Citation2014). Positive UF values indicate an increasing trend, and negative UF values indicate a decreasing trend. Two critical values were set for significance measurement as U0.05 = ±1.96. The sequence curve of UF(dk), UB(dk), and two horizontal lines indicating the critical values are presented in .
Figure 4. Simulated subzones in the Tibetan Plateau. Seasonal frozen ground zone, changing zone, and permafrost zone account for about 46.1 percent, 23.3 percent, and 30.6 percent of the study area, respectively.
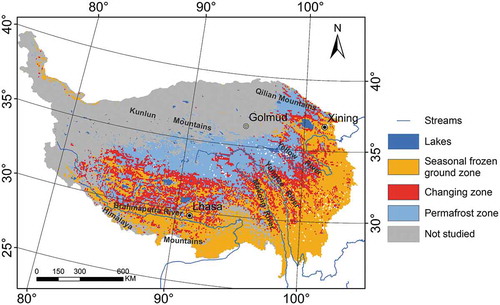
Figure 5. Mutation times in the annual-maximum and zone-averaged NDVI series from 1982 to 2012 in the three subzones and the entire study area. The intersection of the solid line and the dashed line is the mutation point. (a) The mutation times in permafrost zone. (b) The mutation times in changing zone. (c) The mutation times in seasonal frozen ground zone. (d) The mutation times in the whole Tibetan Plateau.
Results
Permafrost distribution pattern
The seasonal frozen ground and permafrost modeled by the modified Frost Number model are shown in . Permafrost is located in the center and the Qilian Mountain in the Tibetan Plateau. Seasonal frozen ground is distributed in the east and south to the permafrost zone. The area of permafrost and seasonal frozen ground is about 3.5 × 10⁵ km2 and 7.31 × 10⁵ km2, respectively. In order to test the accuracy of the simulation results, the simulated permafrost map was compared with the 1:3,000,000 Map of Permafrost in the Tibetan Plateau (Li and Cheng Citation1996). The permafrost map was based on field survey and was considered as the standard permafrost distribution map for the Tibetan Plateau. The map has also been widely used in previous permafrost studies (Cheng et al. Citation2012; Ran et al. Citation2012; Lu, Zhao, and Wu Citation2017). We selected the simulated permafrost map from the simulation period (1995–2000) to compare with the permafrost map by Li and Cheng (Citation1996) because this simulation period is close to 1996. As long as a simulation map is consistent with the permafrost map, we consider that the simulated results are consistent with the field survey data. We calculated the area of the simulated map and verified map, and the simulated map is 90.5 percent similar to the verified map.
According to the simulated results, we classified the permafrost map into three subzones: seasonal frozen ground zone, changing zone, and permafrost zone. Seasonal frozen ground zone, changing zone, and permafrost zone account for 46.1 percent, 23.3 percent, and 30.6 percent of the study area, respectively (). Here, we defined the changing zone as the region transforming from permafrost into seasonal frozen ground over the past 31 years.
NDVI mutation time
The abrupt changes of NDVI time series from 1982 to 2012 is identified by the Mann–Kendall method. The abrupt changes occurred at similar times across the whole Tibetan Plateau and the three subzones (). The intersection of the dash line and the solid line shown in is the mutation point of NDVI. The mutation times of NDVI series in each region have been counted in . Abrupt changes affecting the whole Tibetan Plateau occurred at four times: 1984–1985, 1987, 2001–2003, and 2008–2009.
Table 1. Mutation times from 1982 to 2012.
Based on the four mutation times, the three zones can be divided into five stages during the past 31 years: 1982–1987, 1988–1994, 1995–2000, 2001–2007, and 2008–2012. The five stages were named stage 1 to stage 5, respectively.
Spatiotemporal pattern of permafrost
The spatiotemporal distributions of permafrost and seasonal frozen ground in the five stages are shown in . The total area of permafrost in each stage is 6.727 × 10⁵ km2, 5.548 × 10⁵ km2, 5.288 × 10⁵ km2, 3.554 × 10⁵ km2, and 3.551 × 10⁵ km2, respectively (). The permafrost area is decreasing over the five stages. The decreased areas between two stages are 11.79 × 10⁴ km2, 2.60 × 10⁴ km2, 17.34 × 10⁴ km2, and 0.03 × 10⁴ km2, respectively. The area of permafrost degradation is the largest from stage 3 to stage 4. The decreased area is the smallest from stage 4 to stage 5, due to the slow warming of the climate. The degradation of permafrost mainly begins in the east and southeast of the Tibetan Plateau. These parts also correspond to the high-temperature areas. Over the past 31 years, the seasonal frozen ground has been embedded into the center of the continuous permafrost zone and the large area of continuous permafrost has been degraded into pieces (a–e). Permafrost is no longer a continuous aquiclude for groundwater.
Figure 6. Distribution and area changes of permafrost and seasonal frozen ground during the five stages. (a)–(e) Distributions of permafrost and seasonal frozen ground in stage 1, stage 2, stage 3, stage 4, and stage 5, respectively. (f) Area changes of permafrost and seasonal frozen ground over the five stages.
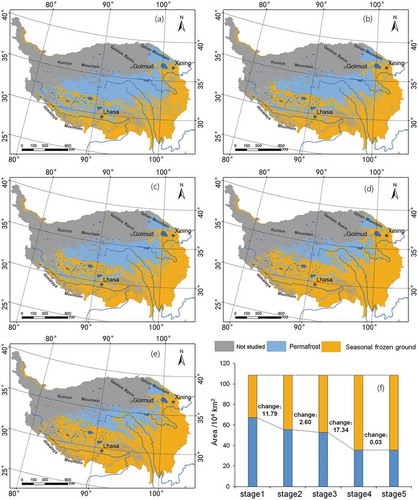
Figure 7. The relationships between NDVI and precipitation, temperature, and maximum thawing depth in the three subzones. The black spots represent 31-year-averaged data in each pixel. The red dots represent the averaged data every 0.01 NDVI interval.
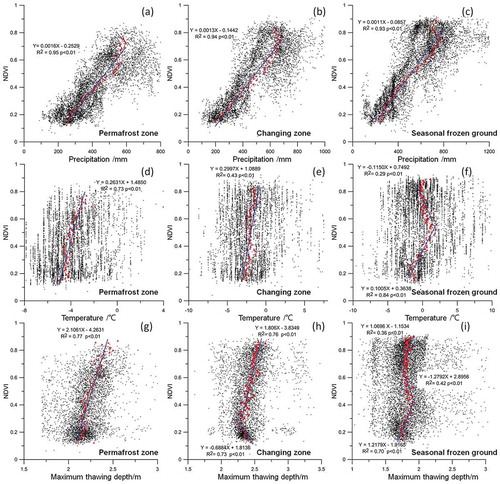
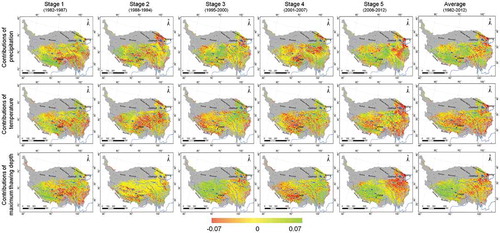
Figure 8. Contributions of precipitation, temperature, and maximum thawing depth to NDVI over the five stages.
Correlations of the main factors with NDVI
In previous studies, temperature, precipitation, and groundwater were considered as the main factors determining the growth of alpine vegetation in the cold and arid Tibetan Plateau (Guisan, Theurillat, and Kienast Citation1998; Yang et al. Citation2010; Zhong et al. Citation2010; Manel et al. Citation2012). To reveal the impact of temperature and moisture conditions on alpine vegetation, we calculated the relation of precipitation, temperature, and maximum thawing depth to NDVI variation in the three subzones (). There is a good positive correlation between precipitation and NDVI in all the three subzones (a–c). The slopes of the relationships between NDVI and temperature in the seasonal frozen ground zone and permafrost zone are positive (d and e), whereas the slope in the changing zone is negative when NDVI values are >0.5 and positive when NDVI is <0.5 (). The slopes of the relationships between NDVI and the maximum thawing depth in the permafrost zone were are (). The relationships between NDVI and the maximum thawing depth in the changing zone and seasonal frozen ground zone are different. In the changing zone where NDVI is <0.3 (), and in the seasonal frozen ground zone where NDVI is between 0.44 and 0.7 (), the slopes of the relationships between the maximum thawing depth and NDVI are negative.
The correlation coefficients (R2) can be used to determine the relevance of the three factors to NDVI. Based on the correlation coefficients, the correlation between NDVI and precipitation is the most significant in all the subzones (a–c). In each subzone, the maximum thawing depth has more significant relation with vegetation growth than the temperature.
Contribution of factors to NDVI
For further understanding the contribution of each driving factor to vegetation growth, we calculate the contribution rate of precipitation, temperature, and maximum thawing depth at each stage based on Equation (8) using annual data of the three factors (annual precipitation, annual average temperature, and annual maximum thawing depth). The contribution rates of the three factors in each pixel are shown in .
The contributions of precipitation to NDVI variations are mainly positive over the five stages except for the 4th stage, as shown in row 1 of . The area with positive correlation was increased from 52 percent to 62 percent (). At the 4th stage, the regions with negative contributions of precipitation to NDVI are mainly located in the Three Rivers Source Region (Yangtze River, Yellow River, and Mekong River) and the region around Lhasa (). The positive contributions of precipitation mainly occurred in the lower-NDVI areas in the central and north of the Tibetan Plateau, while the negative ones are in the higher-NDVI areas in the east and northeast of Tibetan Plateau. In summary, the contributions of precipitation to the vegetation in the cold and arid Tibetan Plateau are different in space and time.
Table 2. The area percentage of factors (precipitation, temperature and maximum thawing depth) driving NDVI change over the five stages.
Generally, temperature had a negative contribution to alpine vegetation over the five stages except for the 1st stage, which is shown in row 2 of . The area with negative contribution rate accounted for 56 percent to 68 percent of the study area and was mainly in the west, center to southeast (). At the 1st stage, about 48 percent of the area had positive contributions to the annual variation rate of NDVI.
The effects of maximum thawing depth on the annual variation rate of NDVI also varied with time and space. From the 2nd to 4th stages, the area with positive contributions is more than half (). The areas with higher NDVI, such as in the east, the maximum thawing depth had a negative contribution to the annual variation rate of NDVI. While the maximum thawing depth had a positive role in lower-NDVI vegetation in the west, which are shown in the averaged contribution (). This typical spatial distribution pattern can also be found at the 3rd and the 5th stages, as shown in row 3 of .
The zone-averaged contribution rates in the three subzones over the five stages are shown in . The contributions of precipitation and maximum thawing depth are positive in in the three subzones at the 3rd and 5th stages () where the slope of NDVI is positive (). During these two stages, in the region of changing zone and seasonal frozen ground zone, the maximum thawing depth had a positive contribution to the annual variation rate of NDVI. However, with the climate warming, the positive contribution of thaw depth became smaller (b and c). The contribution of maximum thawing depth was even changed from positive to negative in the permafrost zone from the 3rd stage to the 5th stage (a). Within the two stages, in the regions of changing zone and seasonal frozen ground zone, temperature had a negative contribution to the variation rate of NDVI (b and c). As the climate warming, the negative contribution of temperature increased. In the permafrost zone, the contribution of temperature on vegetation growth is similar to that of maximum thawing depth (a).
Figure 9. The zone-averaged contribution of the three driving factors at the five stages. (a)–(c) Contributions in the permafrost zone, changing zone, and seasonal frozen ground zone, respectively.
Figure 10. The zone-averaged NDVI trend in the three subzones at the five stages.
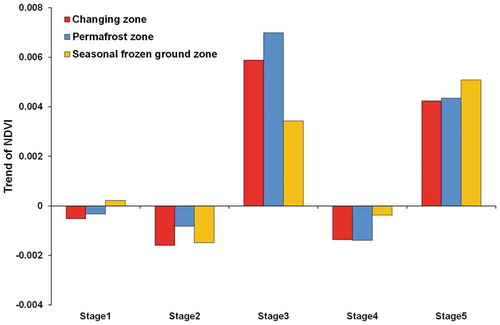
The NDVI trend can help us understand vegetation cover change over time. shows that NDVI in the three subzones had similar trends at each stage. In the 3rd and 5th stages, NDVI increased strongly in all three subzones. It decreased slightly in the 2nd and 4th stages and stayed about the same in stage 1.
Discussion
Permafrost map accuracy valuation
In fact, it is difficult to obtain enough field observation data to outline the distribution of permafrost in the Tibetan Plateau. The physically based modeling for permafrost is also difficult because of the difficulty in acquiring accurate model parameters for the whole region. On the basis of the available data, we selected the Frost Number model to carry out large-area permafrost simulations in the Tibetan Plateau. The main data used in the model is ground surface temperature. In addition to the effects of ground surface temperature, permafrost changes are also affected by vegetation cover, soil and bedrock thermal conductivity, moisture content, and other factors. When these physical parameters are considered, the accuracy of permafrost simulation can be improved (Brown Citation1966; Guo, Wang, and Wang Citation2017).Compared with previous studies, the simulated areas of permafrost may be different at different stages, but the general trend of permafrost degradation is in consistent with previous studies (Li and Cheng Citation1999; Nan et al. Citation2012; Guo, Wang, and Wang Citation2017). The degradation of permafrost is characterized by the reduced area, as well as the increased surface burial depth (increasing the active layer thickness). We compared our simulation results with the 1:3,000,000 permafrost map (Li and Cheng Citation1996). The similarity of 90.5 percent strongly suggests that this statistical-empirical model can be successfully used to simulate the distribution of permafrost. However, there is still 9.5 percent area where there is difference between the simulation result and the survey map of permafrost distribution in the Tibetan Plateau. These different regions are sporadically distributed around the simulated permafrost, and mainly concentrated in the east region, especially near the source region of the Yellow River (). The reason for this inconsistency is likely the inaccuracy of the survey map itself, because most of the permafrost boundary lines were empirically drawn on the topographic map by hand. Although the sparse borehole observations and the easy-access terrain survey can obtain accurate data, these survey data accumulated from nearly two decades till 1996, so the timeliness maybe another factor that cause the two maps different. The last reason may be the scale, the scale of the survey map is 1:3,000,000, while the modeling resolution is 1,000 m. Despite these differences, the simulated map is generally in good agreement with the survey map.
Frozen ground classification
The thawed permafrost surface would result in lowering of the groundwater table above the permafrost surface. In an extreme case, when the permafrost disappeared, it would affect recharging of the groundwater over the permafrost surface into deep aquifers. These changes will eventually affect the alpine vegetation that depends on the groundwater over the permafrost (Cheng and Wu Citation2007; Cheng and Jin Citation2013). Therefore, we separate permafrost degradation zones from the frozen ground map. Here, we defined the changing zone as the region transforming from permafrost into seasonal frozen ground over the past 31 years. In this way, the frozen ground was divided into seasonal frozen ground zone, changing zone, and permafrost zone. Seasonal frozen ground zone, changing zone, and permafrost zone account for 46.1 percent, 23.3 percent, and 30.6 percent of the study area, respectively (). Over the past 31 years, permafrost areas have been decreasing and the large area of continuous permafrost has been degraded into pieces. The changing zone is mainly distributed between the permafrost zone and the seasonal frozen ground zone, especially around the river basins and large lakes.
Factors correlation to NDVI variation
To some extent, permafrost and its overlying alpine vegetation are interdependent. Changes of alpine vegetation can reflect variations of permafrost indirectly. In some typical areas, vegetation change is considered as an indicator of the existence and variation of permafrost (Frauenfelder et al. Citation1998; Gruber and Hoelzle Citation2001). To distinguish the impacts of climate and environment on vegetation, we calculated the correlations of precipitation, temperature, and maximum thawing depth with NDVI in these three typical regions. We also divided the past 31 years into five typical periods according to the changing trend of NDVI. These data provided a new basis to determine the relevance of these factors on alpine vegetation and their changes in space and time. During the past 31 years, NDVI has undergone four mutations and consequently had five different stages. Correlations with NDVI, ranked in turn, is precipitation, maximum thawing depth, and temperature.
Precipitation was the main factor driving NDVI variation and had a positive relationship with NDVI in the three subzones (a–c). This is consistent with many previous studies (Song, Zhou, and Ouyang Citation2005; Shen et al. Citation2011). However, we used the average data to draw this conclusion. In fact, different regions and times would come to different conclusions. We must be careful when we analyze the relationship between precipitation and NDVI. Therefore, we also calculated the contributions of precipitation in different regions and different stages to NDVI changes. Results show that the contributions varied with time and space. We will discuss this in more detail in the next section.
The maximum thawing depth is the second factor and has a positive relationship with NDVI, except for in changing zone when NDVI is <0.3 and in seasonal frozen ground zone when NDVI values are between 0.44 and 0.7 (g–i). The affected area where the maximum thawing depth has a positive relationship with NDVI exceed a half in the Tibetan Plateau, and gradually decreases from the second stage (, row 3). In general, based on the averaged contribution rate in the three subzones, the maximum thawing depth had a positive relationship with NDVI during the vegetation increasing periods (the 3rd and 5th stages). In the end, the effect of active layer deepening is similar to the effects of temperature rise. When the active layer is very shallow, certain plant species or vegetation types may expand when the active layer deepens. Further deepening of the active layer leads to drying of the soil at rooting depth, thus preventing water and nutrient uptake. The thawed layer can provide available liquid water, nutrients, or minerals for alpine vegetation, which cannot be utilized by vegetation when frozen. Only in the thawed layer can vegetation grow and develop. From this point of view, the maximum thawing depth had a positive relationship with vegetation (Cuo et al. Citation2015; Qin et al. Citation2016). Permafrost provides water source for arid vegetation by controlling the water table. When the large area of continuous permafrost is degraded into pieces—that is, the maximum thawing depth is increasing—the thawing of permafrost results in lowering of the water table (Cheng and Wu Citation2007). The alpine vegetation that depends on the water table would degenerate. In this case, the maximum thawing depth had a negative impact on the vegetation growth (Jin et al. Citation2009). This negative effect, such as in the changing zone with NDVI <0.3, can be interpreted as the dependence of drought-tolerant vegetation on groundwater. Permafrost will degenerate as global warming, and vegetation will continue to be endangered by groundwater scarcity, even being replaced by drought-tolerant vegetation.
In cold areas, accumulated temperature directly affects vegetation coverage (Shen et al. Citation2011; Sun et al. Citation2013). In areas with higher accumulated temperature, the vegetation coverage is generally higher, and vice versa. In areas with high vegetation cover (NDVI >0.5), accumulated temperature can meet the needs of local vegetation. Our study shows that a further rise in temperature does not lead to a further increase of NDVI. The influence of rising temperatures on vegetation composition and cover depends on the temperature optima for specific species, plant communities, and biomes and on how close the temperature is to the limits of these optima. In areas with lower vegetation cover, such as the northwest of the plateau or NDVI <0.5, mainly steppe, it is cold and accumulated temperature is still an important demand for the growth of vegetation. In areas with higher vegetation cover, such as the southeast of the plateau or NDVI >0.7, mainly forest or shrub, accumulated temperature is not a necessary demand for the growth of vegetation. It can be inferred that the effects of temperature on alpine vegetation may depend on the fractional vegetation cover and species. If the fractional vegetation cover is lower, the rising temperature may promote the vegetation growth; otherwise, the rising temperature may against the vegetation growth.
Driving factors of NDVI change
We calculated the contribution rates of the three main factors (precipitation, temperature, and maximum thawing depth) pixel by pixel over the five stages. In general, in the 1st, 2nd, and 4th stages, the NDVI reduced slightly (). During these stages, the rising temperature was not conducive to the growth of alpine vegetation. Temperature may result in vegetation degradation, and this impact was accelerated with time (). The maximum thawing depth played a minor role in preventing vegetation degradation (), and the increasing maximum thawing depth is not conducive to the vegetation growth in these stages. In these three stages of vegetation degradation, the effect of precipitation on vegetation varies in different regions. The contribution of precipitation would change and even have negative effects on vegetation in different regions at different stages. When the precipitation amount is sufficient, the alpine vegetation change may not be related to the precipitation. In arid areas, the negative correlation may be due to lagging of vegetation change relative to the precipitation. The impact of precipitation on the vegetation in cold and arid regions is different spatially and temporally.
During both the vegetation increasing stages (the 3rd and 5th stages) and the vegetation degrading stages (the 1st, 2nd, and 4th stages), temperature is not conducive to vegetation growth (a–c). Temperature hinders the growth of vegetation or accelerates vegetation degradation. The enhanced negative effect over stages may be due to climate warming. The effect of temperature rise on alpine vegetation has two sides. The increase of temperature can meet the accumulated-temperature demand of the alpine vegetation in cold area. On the contrary, the high temperature also can lead to the increase of evaporation, result in the loss of water resources, and ultimately limit the vegetation growth in the arid region. Over the past few decades, there have been differences in the temperature rise in different areas of the Tibetan Plateau (Guo and Wang Citation2012; Gao et al. Citation2015; Kuang and Jiao Citation2016; You, Min, and Kang Citation2016). This understanding can explain why the effects of temperature on vegetation varied at different stages and different places. The finding is consistent with previous studies (e.g., Liang et al. Citation2012).
There are still some driving factors (such as wind, solar radiation) on NDVI dynamics have not been considered in this study. The effects of these driving forces on NDVI dynamics may be the topic for further studies. Different human activities are also important factors that influencing NDVI changes, especially in the National Nature Reserve of Three Rivers Source.
In this study, we used the GIMMS-NDVI data, with 8 km spatial and 15-day temporal resolution (Holben Citation1986; Pinzon and Tucker Citation2014). It is suitable for large-scale research, but the coarse resolution cannot reflect the local changes. In the Tibetan Plateau, vegetation growth season is very short, and only data with higher temporal resolution can accurately reflect the characteristics of rapid seasonal vegetation changes in a year. NDVI also cannot reveal the vegetation replacement that has occurred in the Tibetan Plateau over the past few decades (Klanderud and Birks Citation2003; Song, Zhou, and Ouyang Citation2005; Ma et al. Citation2015; Seddon et al. Citation2016). NDVI does not characterize sparse vegetation well (Elmore et al. Citation2000). Future studies on vegetation with small NDVI should adopt other indexes (e.g., vegetation coverage) to correctly reflect the real variation of sparse vegetation.
We only analyzed the annual average data (precipitation, temperature, maximum thawing depth, and NDVI data), and the results may contain some smoothed effects resulted from average. However, based on multi-annual averages, precipitation has a good positive correlation with vegetation in most cases, though its negative effects can also be found in some stages and some spaces. If we increase the temporal resolution from 1 year to semi-month (consistent with the GIMMS resolution), it may be possible to find more precise changes in the impact of the factors on the alpine vegetation.
Conclusions
In this study, we simulated the frozen ground distributions by employing a modified Frost Number model and divided the frozen ground into seasonal frozen ground zone, changing zone, and permafrost zone in the Tibetan Plateau. The area of permafrost demonstrated a fluctuation but presented a generally decreasing trend from 1982 to 2012. The decreased areas is 31.76 × 10⁴ km2, and the degradation rate is about 1.02 × 10⁴ km2/yr. The greatest rate of degradation occurred around 2000 due to the accelerated climate warming in the Tibetan Plateau.
We quantitatively analyzed the relations between precipitation, temperature, the maximum thawing depth and NDVI in the subzones, and contributions of the three factors to the annual variation rate of NDVI in different stages and different zones from 1982 to 2012. During the entire study period, precipitation has the largest average contribution to the variation rate of NDVI, followed by the maximum thawing depth and temperature.
Acknowledgments
The authors thank the two reviewers and the editor for the insightful and constructive comments.
Disclosure statement
No potential conflict of interest was reported by the authors.
Additional information
Funding
References
- Bao, G., Z. H. Qin, Y. H. Bao, Y. Zhou, W. J. Li, and A. Sanjjav. 2014. NDVI-based long-term vegetation dynamics and its response to climatic change in the Mongolian Plateau. Remote Sensing 6 (9):8337–58. doi:10.3390/rs6098337.
- Brown, R. 1966. Influence of vegetation on permafrost. Permafrost international conference: proceedings, Lafayette, Indiana: National Academies, November 11–15 1963. (No. 1287, p. 20).
- Cheng, G. D., and H. J. Jin. 2013. Permafrost and groundwater on the Qinghai-Tibet Plateau and in northeast China. Hydrogeology Journal 21 (1):5–23. doi:10.1007/s10040-012-0927-2.
- Cheng, G. D., and T. H. Wu. 2007. Responses of permafrost to climate change and their environmental significance, Qinghai-Tibet Plateau. Journal of Geophysical Research-Earth Surface 112 (F2). doi: 10.1029/2006jf000631.
- Cheng, W. M., S. M. Zhao, C. H. Zhou, and X. Chen. 2012. Simulation of the decadal permafrost distribution on the Qinghai-Tibet Plateau (China) over the past 50 years. Permafrost and Periglacial Processes 23 (4):292–300. doi:10.1002/ppp.1758.
- Cuo, L., Y. X. Zhang, T. J. Bohn, L. Zhao, J. L. Li, Q. M. Liu, and B. R. Zhou. 2015. Frozen soil degradation and its effects on surface hydrology in the northern Tibetan Plateau. Journal Of Geophysical Research-Atmospheres 120 (16):8276–98. doi:10.1002/2015jd023193.
- Ding, M., L. Li, Y. Nie, Q. Chen, and Y. Zhang. 2016. Spatio-temporal variation of spring phenology in Tibetan Plateau and its linkage to climate change from 1982 to 2012. Journal of Mountain Science 13 (1):83–94. doi:10.1007/s11629-015-3600-0.
- Edwards, A. L. 1984. An introduction to linear regression and correlation[J]. Mathematical Gazette 69 (2):1–17. doi:10.1017/S0025557200105583.
- Elmore, A. J., J. F. Mustard, S. J. Manning, and D. B. Lobell. 2000. Quantifying vegetation change in semiarid environments: Precision and accuracy of spectral mixture analysis and the normalized difference vegetation index. Remote Sensing of Environment 73 (1):87–102. doi:10.1016/S0034-4257(00)00100-0.
- Frauenfelder, R., B. Allgwer, W. Haeberli, and M. Hoelzle, 1998. Permafrost investigations with GIS—A case study in the Fletschhorn area, Wallis, Swiss Alps. Proceedings of the 7th International Conference on Permafrost, Yellowknife, 291–95. Canada.
- Friedl, M. A., D. K. McIver, J. C. F. Hodges, X. Y. Zhang, D. Muchoney, A. H. Strahler, and C. Schaaf. 2002. Global land cover mapping from MODIS: Algorithms and early results. Remote Sensing of Environment 83 (1–2):287–302. doi:10.1016/S0034-4257(02)00078-0.
- Friedl, M. A., D. Sulla-Menashe, B. Tan, A. Schneider, N. Ramankutty, A. Sibley, and X. M. Huang. 2010. MODIS Collection 5 global land cover: Algorithm refinements and characterization of new datasets. Remote Sensing of Environment 114 (1):168–82. doi:10.1016/j.rse.2009.08.016.
- Gao, Y. H., X. Li, L. R. Leung, D. L. Chen, and J. W. Xu. 2015. Aridity changes in the Tibetan Plateau in a warming climate. Environmental Research Letters 10 (3):034013. doi:10.1088/1748-9326/10/3/034013.
- Gao, Y. H., X. Zhou, Q. Wang, C. Z. Wang, Z. M. Zhan, L. F. Chen, and R. Qu. 2013. Vegetation net primary productivity and its response to climate change during 2001–2008 in the Tibetan Plateau. Science of the Total Environment 444:356–62. doi:10.1016/j.scitotenv.2012.12.014.
- Gruber, S., and M. Hoelzle. 2001. Statistical modelling of mountain permafrost distribution: Local calibration and incorporation of remotely sensed data. Permafrost and Periglacial Processes 12 (1):69–77. doi:10.1002/ppp374.
- Guisan, A., J. P. Theurillat, and F. Kienast. 1998. Predicting the potential distribution of plant species in an Alpine environment. Journal of Vegetation Science 9 (1):65–74. doi:10.2307/3237224.
- Guo, D. L., and H. J. Wang. 2012. The significant climate warming in the northern Tibetan Plateau and its possible causes. International Journal of Climatology 32 (12):1775–81. doi:10.1002/joc.2388.
- Guo, D. L., and H. J. Wang. 2013. Simulation of permafrost and seasonally frozen ground conditions on the Tibetan Plateau, 1981–2010. Journal of Geophysical Research: Atmospheres 118 (11):5216–30. doi:10.1002/jgrd.50457.
- Guo, D. L., H. J. Wang, and D. Li. 2012. A projection of permafrost degradation on the Tibetan Plateau during the 21st century. Journal of Geophysical Research: Atmospheres 117. doi:10.1029/2011JD016545.
- Guo, D. L., H. J. Wang, and A. H. Wang. 2017. Sensitivity of historical simulation of the permafrost to different atmospheric forcing data sets from 1979 to 2009. Journal of Geophysical Research: Atmospheres 122 (22):12269–84. doi:10.1002/2017jd027477.
- Holben, B. N. 1986. Characteristics of maximum-value composite images from temporal AVHRR data. International Journal of Remote Sensing 7 (11):1417–34. doi:10.1080/01431168608948945.
- Hope, A. S., W. L. Boynton, D. A. Stow, and D. C. Douglas. 2003. Interannual growth dynamics of vegetation in the Kuparuk River watershed, Alaska based on the normalized difference vegetation index. International Journal of Remote Sensing 24 (17):3413–25. doi:10.1080/0143116021000021170.
- Hutchinson, M. F., and T. Xu. 2004. Anusplin version 4.2 user guide. Canberra: Centre for Resource and Environmental Studies, The Australian National University.
- Iijima, Y., T. Ohta, A. Kotani, A. N. Fedorov, Y. Kodama, and T. C. Maximov. 2014. Sap flow changes in relation to permafrost degradation under increasing precipitation in an eastern Siberian larch forest. Ecohydrology 7 (2):177–87. doi:10.1002/eco.1366.
- Jin, H., R. He, G. Cheng, Q. Wu, S. Wang, L. Lü, and X. Chang. 2009. Changes in frozen ground in the source area of the Yellow River on the Qinghai–Tibet Plateau, China, and their eco-environmental impacts. Environmental Research Letters 4 (4):045206. doi:10.1088/1748-9326/4/4/045206.
- Jumikis, A. R. 1977. Thermal geotechnics. New Brunswick, NJ: Rutgers University Press.
- Kato, T., Y. H. Tang, S. Gu, M. Hirota, X. Y. Cui, M. Y. Du, Y. N. Li, X. Q. Zhao, and T. Oikawa. 2004. Seasonal patterns of gross primary production and ecosystem respiration in an alpine meadow ecosystem on the Qinghai-Tibetan Plateau. Journal of Geophysical Research: Atmospheres 109 (D12). doi:10.1029/2003JD003951.
- Kendall, M. G. 1948. Rank correlation methods. London: Charles Griffin.
- Klanderud, K., and H. J. B. Birks. 2003. Recent increases in species richness and shifts in altitudinal distributions of Norwegian mountain plants. Holocene 13 (1):1–6. doi:10.1191/0959683603hl589ft.
- Kuang, X. X., and J. J. Jiao. 2016. Review on climate change on the Tibetan Plateau during the last half century. Journal of Geophysical Research: Atmospheres 121 (8):3979–4007. doi:10.1002/2015jd024728.
- Lemke, P., J. Ren, R. B. Alley, J. Carrasco, G. Flato, and Y. Fujii. 2007. Observations: Changes in snow, ice and frozen ground in climate change 2007: The physical science basis. Contributions of Working Group I to the 4th assessment of the IPCC. https://www.ipcc.ch/site/assets/uploads/2018/02/ar4-wg1-chapter4-1.pdf.
- Li, S., and G. Cheng. 1996. Map of permafrost distribution on the Qinghai-Xizang (Tibetan) Plateau, scale 1: 3,000,000. Lanzhou: Gansu Cultural Press. (in Chinese).
- Li, X., and G. D. Cheng. 1999. A GIS-aided response model of high-altitude permafrost to global change. Science in China Series D: Earth Sciences 42 (1):72–79. doi:10.1007/Bf02878500.
- Li, X., G. D. Cheng, H. J. Jin, E. Kang, T. Che, R. Jin, L. Z. Wu, Z. T. Nan, J. Wang, and Y. P. Shen. 2008. Cryospheric change in China. Global and Planetary Change 62 (3–4):210–18. doi:10.1016/j.gloplacha.2008.02.001.
- Liang, S. H., S. M. Ge, L. Wan, and D. W. Xu. 2012. Characteristics and causes of vegetation variation in the source regions of the Yellow River, China. International Journal of Remote Sensing 33 (5):1529–42. doi:10.1080/01431161.2011.582187.
- Liu, X., and B. Chen. 2000. Climatic warming in the Tibetan Plateau during recent decades. International Journal of Climatology 20 (14):1729–42. doi:10.1002/(ISSN)1097-0088.
- Lu, Q., D. Zhao, and S. Wu. 2017. Simulated responses of permafrost distribution to climate change on the Qinghai-Tibet Plateau. Scientific Reports 7 (1):3845. doi:10.1038/s41598-017-04140-7.
- Lunardini, V. J. 1981. Heat transfer in cold climates/Virgil J. Lunardini. New York: Van Nostrand Reinhold.
- Ma, X. L., A. Huete, S. Moran, G. Ponce-Campos, and D. Eamus. 2015. Abrupt shifts in phenology and vegetation productivity under climate extremes. Journal of Geophysical Research-Biogeosciences 120 (10):2036–52. doi:10.1002/2015jg003144.
- Manel, S., F. Gugerli, W. Thuiller, N. Alvarez, P. Legendre, R. Holderegger, L. Gielly, and P. Taberlet. 2012. Broad‐scale adaptive genetic variation in alpine plants is driven by temperature and precipitation. Molecular Ecology 21 (15):3729–38. doi:10.1111/j.1365-294X.2012.05656.x.
- Mann, H. B. 1945. Nonparametric tests against trend. Econometrica: Journal of the Econometric Society 13:245–59. doi:10.2307/1907187.
- Muller, S. W. 1947. Permafrost or permanently frozen ground and related engineering problems, 231. Ann Arbor: J. W. Edwards.
- Nan, Z. T., P. P. Huang, and L. Zhao. 2013. Permafrost distribution modeling and depth estimation in the Western Qinghai-Tibet Plateau. Acta Geographica Sinica 68 (3):318–27. doi:10.11821/xb201303003.
- Nan, Z. T., L. Shuxun, C. Guodong, and H. Pei-Pei. 2012. Surface frost number model and its application to the Tibetan plateau. Journal of Glaciology and Geocryology 34 (1):89–95.
- Nan, Z. T., L. Shuxun, and L. Yongzhi. 2002. Mean annual ground temperature distribution on the Tibetan Plateau: Permafrost distribution mapping and further application. Journal of Glaciology and Geocryology 24 (2):142–48.
- National Meteorological Information Center. 2012. Assessment report of China’s ground precipitation 0.5°×0.5° gridded dataset (V2.0). Beijing: National Meteorological Information Center.
- Nelson, F. E., and S. I. Outcalt. 1987. A computational method for prediction and regionalization of permafrost. Arctic, Antarctic, and Alpine Research 19 (3):279–88. doi:10.2307/1551363.
- Nemani, R. R., C. D. Keeling, H. Hashimoto, W. M. Jolly, S. C. Piper, C. J. Tucker, R. B. Myneni, and S. W. Running. 2003. Climate-driven increases in global terrestrial net primary production from 1982 to 1999. Science 300 (5625):1560–63. doi:10.1126/science.1082750.
- Pan, B., and J. Li. 1996. Qinghai–Tibetan Plateau: A driver and amplifier of the global climatic change. Journal of Lanzhou University (Natural Sciences) 32:108–15.
- Pang, G., X. Wang, and M. Yang. 2016. Using the NDVI to identify variations in, and responses of, vegetation to climate change on the Tibetan Plateau from 1982 to 2012. Quaternary International. doi:10.1016/j.quaint.2016.08.038.
- Partal, T., and E. Kahya. 2006. Trend analysis in Turkish precipitation data. Hydrological Processes 20 (9):2011–26. doi:10.1002/hyp.5993.
- Piao, S. L., X. H. Wang, P. Ciais, B. Zhu, T. Wang, and J. Liu. 2011. Changes in satellite-derived vegetation growth trend in temperate and boreal Eurasia from 1982 to 2006. Global Change Biology 17 (10):3228–39. doi:10.1111/j.1365-2486.2011.02419.x.
- Piao, S. L., G. D. Yin, J. G. Tan, L. Cheng, M. T. Huang, Y. Li, R. Liu, J. Mao, R. B. Myneni, S. Peng, et al. 2015. Detection and attribution of vegetation greening trend in China over the last 30 years. Global Change Biology 21 (4):1601–09. doi:10.1111/gcb.12795.
- Pinzon, J. E., and C. J. Tucker. 2014. Anon-stationary 1981–2012 AVHRR NDVI3g time series. Remote Sensing 6:6929–60. doi:10.3390/rs6086929.
- Purevdorj, T., R. Tateishi, T. Ishiyama, and Y. Honda. 1998. Relationships between percent vegetation cover and vegetation indices. International Journal of Remote Sensing 19 (18):3519–35. doi:10.1080/014311698213795.
- Qin, Y., H. M. Lei, D. W. Yang, B. Gao, Y. H. Wang, Z. T. Cong, and W. J. Fan. 2016. Long-term change in the depth of seasonally frozen ground and its ecohydrological impacts in the Qilian Mountains, northeastern Tibetan Plateau. Journal of Hydrology 542:204–21. doi:10.1016/j.jhydrol.2016.09.008.
- Qin, Y., D. Yang, B. Gao, T. Wang, J. Chen, Y. Chen, Y. Wang, and G. Zheng. 2017. Impacts of climate warming on the frozen ground and eco-hydrology in the Yellow River source region, China. Science of the Total Environment 605–606:830–41. doi:10.1016/j.scitotenv.2017.06.188.
- Ran, Y., X. Li, G. Cheng, T. Zhang, Q. Wu, H. Jin, and R. Jin. 2012. Distribution of permafrost in China: An overview of existing permafrost maps. Permafrost and Periglacial Processes 23 (4):322–33. doi:10.1002/ppp.1756.
- Ran, Y. H., X. Li, R. Jin, and J. W. Guo. 2015. Remote sensing of the mean annual surface temperature and surface frost number for mapping permafrost in China. Arctic, Antarctic, and Alpine Research 47 (2):255–65. doi:10.1657/Aaar00c-13-306.
- Rana, G., and N. Katerji. 1998. A measurement based sensitivity analysis of the Penman-Monteith actual evapotranspiration model for crops of different height and in contrasting water status. Theoretical and Applied Climatology 60 (1–4):141–49. doi:10.1007/s007040050039.
- Seddon, A. W., M. Macias-Fauria, P. R. Long, D. Benz, and K. J. Willis. 2016. Sensitivity of global terrestrial ecosystems to climate variability. Nature 531 (7593):229–32. doi:10.1038/nature16986.
- Shen, M. G., Y. H. Tang, J. Chen, X. L. Zhu, and Y. H. Zheng. 2011. Influences of temperature and precipitation before the growing season on spring phenology in grasslands of the central and eastern Qinghai-Tibetan Plateau. Agricultural and Forest Meteorology 151 (12):1711–22. doi:10.1016/j.agrformet.2011.07.003.
- Smith, M. W., and D. W. Riseborough. 1996. Permafrost monitoring and detection of climate change. Permafrost and Periglacial Processes 7 (4):301–09. doi:10.1002/(Sici)1099-1530(199610)7:4<301::Aid-Ppp231>3.0.Co;2-R.
- Song, M. H., C. P. Zhou, and H. Ouyang. 2005. Simulated distribution of vegetation types in response to climate change on the Tibetan Plateau. Journal of Vegetation Science 16 (3):341–50. doi:10.1111/j.1654-1103.2005.tb02372.x.
- Stefan, J. 1891. Ueber die Theorie der Eisbildung, insbesondere über die Eisbildung im Polarmeere (In German). Annalen der Physik 278:269–86. doi:10.1002/andp.18912780206.
- Stow, D. A., A. Hope, D. McGuire, D. Verbyla, J. Gamon, F. Huemmrich, and R. Myneni. 2004. Remote sensing of vegetation and land-cover change in arctic tundra ecosystems. Remote Sensing of Environment 89 (3):281–308. doi:10.1016/j.rse.2003.10.018.
- Sun, J., G. W. Cheng, W. P. Li, Y. K. Sha, and Y. C. Yang. 2013. On the variation of NDVI with the principal climatic elements in the Tibetan Plateau. Remote Sensing 5 (4):1894–911. doi:10.3390/rs5041894.
- Sun, Q., C. Miao, and Q. Duan. 2015. Projected changes in temperature and precipitation in ten river basins over China in 21st century. International Journal of Climatology 35 (6):1125–41. doi:10.1002/joc.4043.
- Wang, G., Y. Li, Q. Wu, and Y. Wang. 2006. Impacts of permafrost changes on alpine ecosystem in Qinghai-Tibet Plateau. Science in China Series D: Earth Sciences 49 (11):1156–69. doi:10.1007/s11430-006-1156-0.
- Wang, G. X., Y. S. Li, Y. B. Wang, and Q. B. Wu. 2008. Effects of permafrost thawing on vegetation and soil carbon pool losses on the Qinghai-Tibet Plateau, China. Geoderma 143 (1–2):143–52. doi:10.1016/j.geoderma.2007.10.023.
- Wang, S. L., H. J. Jin, S. X. Li, and L. Zhao. 2000. Permafrost degradation on the Qinghai-Tibet Plateau and its environmental impacts. Permafrost and Periglacial Processes 11 (1):43–53.
- Wang, W., A. Rinke, J. C. Moore, X. Cui, D. Ji, Q. Li, and B. Decharme. 2016. Diagnostic and model dependent uncertainty of simulated Tibetan permafrost area. Cryosphere 10 (1):287–306. doi:10.5194/tc-10-287-2016.
- Wang, X. X. 2014. Advances in separating effects of climate variability and human activity on stream discharge: An overview. Advances in Water Resources 71:209–18. doi:10.1016/j.advwatres.2014.06.007.
- Wang, Z., Z. Nan, and L. Zhao. 2011. The applicability of MODIS land surface temperature products to simulating the permafrost distribution over the Tibetan Plateau. Journal of Glaciology and Geocryology 33 (1):132–43.
- Wu, Q., Y. Hou, H. Yun, and Y. Liu. 2015. Changes in active-layer thickness and near-surface permafrost between 2002 and 2012 in alpine ecosystems, Qinghai–Xizang (Tibet) Plateau, China. Global and Planetary Change 124:149–55. doi:10.1016/j.gloplacha.2014.09.002.
- Wu, Q. B., and T. J. Zhang. 2008. Recent permafrost warming on the Qinghai-Tibetan plateau. Journal of Geophysical Research: Atmospheres 113:D13108.
- Wu, Q. B., and T. J. Zhang. 2010. Changes in active layer thickness over the Qinghai-Tibetan Plateau from 1995 to 2007. Journal of Geophysical Research: Atmospheres 115:D09107.
- Wu, Q. B., T. J. Zhang, and Y. Z. Liu. 2010. Permafrost temperatures and thickness on the Qinghai-Tibet Plateau. Global and Planetary Change 72 (1–2):32–38. doi:10.1016/j.gloplacha.2010.03.001.
- Xue, X., J. Guo, B. S. A. Han, Q. W. Sun, and L. C. Liu. 2009. The effect of climate warming and permafrost thaw on desertification in the Qinghai-Tibetan Plateau. Geomorphology 108 (3–4):182–90. doi:10.1016/j.geomorph.2009.01.004.
- Yang, H. B., and D. W. Yang. 2012. Climatic factors influencing changing pan evaporation across China from 1961 to 2001. Journal of Hydrology 414:184–93. doi:10.1016/j.jhydrol.2011.10.043.
- Yang, M. X., F. E. Nelson, N. I. Shiklomanov, D. L. Guo, and G. N. Wan. 2010. Permafrost degradation and its environmental effects on the Tibetan Plateau: A review of recent research. Earth-Science Reviews 103 (1–2):31–44. doi:10.1016/j.earscirev.2010.07.002.
- Ye, X. C., Q. Zhang, J. Liu, X. H. Li, and C. Y. Xu. 2013. Distinguishing the relative impacts of climate change and human activities on variation of streamflow in the Poyang Lake catchment, China. Journal of Hydrology 494:83–95. doi:10.1016/j.jhydrol.2013.04.036.
- Yi, S., Z. Zhou, S. Ren, M. Xu, Y. Qin, S. Chen, and B. Ye. 2011. Effects of permafrost degradation on alpine grassland in a semi-arid basin on the Qinghai–Tibetan Plateau. Environmental Research Letters 6 (4):045403. doi:10.1088/1748-9326/6/4/045403.
- You, Q. L., J. Z. Min, and S. C. Kang. 2016. Rapid warming in the Tibetan Plateau from observations and CMIP5 models in recent decades. International Journal of Climatology 36 (6):2660–70. doi:10.1002/joc.4520.
- Zhang, Y., C. Zhang, Z. Wang, Y. Chen, C. Gang, R. An, and J. Li. 2016. Vegetation dynamics and its driving forces from climate change and human activities in the three-river source region, China from 1982 to 2012. Science of the Total Environment 563–564:210–20. doi:10.1016/j.scitotenv.2016.03.223.
- Zhong, L., Y. M. Ma, M. S. Salama, and Z. B. Su. 2010. Assessment of vegetation dynamics and their response to variations in precipitation and temperature in the Tibetan Plateau. Climatic Change 103 (3–4):519–35. doi:10.1007/s10584.009.9787.8.
- Zhou, Z., S. Yi, J. Chen, B. Ye, Y. Sheng, G. Wang, and Y. Ding. 2015. Responses of alpine grassland to climate warming and permafrost thawing in two basins with different precipitation regimes on the Qinghai-Tibetan Plateaus. Arctic, Antarctic, and Alpine Research 47 (1):125–31. doi:10.1657/aaar0013-098.