
 ?Mathematical formulae have been encoded as MathML and are displayed in this HTML version using MathJax in order to improve their display. Uncheck the box to turn MathJax off. This feature requires Javascript. Click on a formula to zoom.
ABSTRACT
The tree-ring stable carbon and oxygen isotope chronologies from two forest sites located in the Forni Glacier forefield (Italy)—one along the glacier stream (GL) and the other toward the valley slope (SL)—were analyzed with the aim of disentangling the precipitation and glacier meltwater inputs in source water δ18O, as reflected by the tree-ring cellulose δ18O. The cellulose δ18O from the GL trees has a negative correlation with winter and summer temperatures, whereas the cellulose δ18O from the SL trees has a positive correlation with precipitation δ18O. The isotopic signature of the source water at the GL site is also influenced by waters of glacial origin, as confirmed by the 18O-depleted glacier meltwater inputs (GMWI_δ18O) estimated by means of an isotope model. The GMWI_δ18O values are consistent with the mean difference measured between the δ18O in the glacier stream and in the precipitation and the winter and summer temperature explains up to 37 percent of the GMWI_δ18O variance. Our results show an increasing influence of glacier meltwater throughout the past decade for the GL site. Our analysis opens new opportunities to reconstruct changes in water regimes of the glacier streams by means of the tree-ring cellulose δ18O.
Introduction
Stable carbon and stable oxygen isotopes in relation to climate and climate-related dynamics have often been applied both in forest ecology, for assessing climate-change impacts (e.g., Battipaglia et al. Citation2013; Wieser et al. Citation2016), and in paleoclimate studies, for reconstructing past climatic conditions on a yearly basis (e.g., Kress et al. Citation2010; Sidorova et al. Citation2013; Hartl-Meier et al. Citation2015). The impacts of a globally relatively fast-changing climate involve several forest environments, and in their upper altitudinal limits toward the treeline, forests are probably facing the most exceptional changes. Among these changes, longer and warmer growing seasons, higher concentrations of carbon dioxide in the atmosphere, higher N-deposition, and the transformation of forest use (in the European Alps mainly the result of land abandonment) represent the most important factors acting at both the regional and global scales.
One of the most widespread impacts of the increasing mean air temperature at the global scale is the cryosphere shrinkage, which is especially evidenced by the ongoing prevalent trends of increasing ice-melting rates and negative glacier mass balances in high mountain environments (Fountain et al. Citation2012; Huss et al. Citation2017), the extensive glacier front retreats, and the increasing frequency of glacier extinctions. Additionally, the annual number of days with snow cover is generally decreasing at high latitudes (e.g., Dye and Tucker Citation2003) and at high altitudes in the Alps (e.g., Hantel and Lucia-Maria Citation2007; Marty et al. Citation2017). Thus, this decrease in snow cover also contributes to changes in the hydrological cycle in mountain catchments in terms of thaw anticipation, high glacier ablation rates, and higher water discharges in the glacier streams. Changes in the water discharge of Alpine streams and rivers because of changes in glacier meltwaters may indeed drive important changes in mountain ecosystems (Slemmons, Saros, and Simon Citation2013) and potentially impact tree growth in mountain forests. Because of glacier and permafrost melt, a higher discharge in glacier streams is already ongoing; however, an extensive glacier runoff reduction is expected in the mid- to long term because the glacier mass is dramatically reducing and because other processes, such as sublimation and evaporation, will probably have a higher impact (Kaser Citation2001). Likely, small glaciers will disappear first from the Alpine landscape. Larger glaciers, instead, will still likely show increasing water discharge amounts during the summer ablation period because of the presence of large amounts of ice. Medium-sized glaciers will decrease their water discharge in the near future; for example, the Corbassière Glacier in Valais will increase its water discharge only until 2020, and a subsequent constant declining trend in glacier stocks is foreseen (Terrier et al. Citation2011). In addition to the climatic-ecological dynamics involving the upper portions of the forests and the treelines, the forests that colonize and grow in glacier forefields will face exceptional changes after the retreat of the glacier tongues. Trees in glacier forefields typically grow on initial and very young soils formed on glacial deposits and till. These recently deglaciated areas at elevations below the plant species’ limit and below the treeline—which is the case for most of the large valley glaciers in the Alps, including our study site—typically undergo primary successions and forest invasion (Huggett Citation1998; Walker et al. Citation2010; Garbarino et al. Citation2010; D’Amico et al. Citation2015; D’Agata et al. Citation2019).
The understanding of the mid- to long-term spatiotemporal hydrological changes that occur in glacier streams that are still fed by glaciers is therefore a critical issue for assessing both changes in water resources in the Alpine environment and the impacts of glacier meltwater changes on forest ecosystems. Tree-ring stable isotopes are highly sensitive proxies for reconstructing and dating past and ongoing climatic or environmental changes (e.g., Battipaglia et al. Citation2008; Treydte et al. Citation2009; Daux et al. Citation2011). Tree photosynthetic capacity and stomatal conductance mainly drive the cellulose δ13C variability (Stuvier and Braziunas Citation1987; Farquhar, Ehleringer, and Hubick Citation1989), and even at moist sites, significant relationships are found with environmental parameters, such as summer irradiance, temperature, and drought (e.g., McCarroll and Loader Citation2004; Seibt et al. Citation2008; Kress et al. Citation2014). The δ13C is further directly impacted by the fossil-fuel emission rates in the atmosphere at least since the nineteenth century, which can be well corrected for (Treydte et al. Citation2009). Several other factors, such as the internal mixture and storage of carbon with different turnover at the leaf or the stem levels or the external combined effects of environmental factors, may alter the climatic signals (Seibt et al. Citation2008; Leonelli et al. Citation2012).
The tree-ring cellulose δ18O depends primarily on the source water signature, the evaporative processes at the leaf level (Dongmann Citation1974; Roden, Lin, and Ehleringer Citation2000), and the following post-photosynthetic exchange rates during wood synthesis (Roden, Lin, and Ehleringer Citation2000; McCarroll and Loader Citation2004). Tree-ring δ18O is used in several paleoclimatic studies for reconstructing different parameters, such as past temperatures (Naulier et al. Citation2015), precipitation (Rinne et al. Citation2013), drought (Labuhn et al. Citation2016), and precipitation δ18O (Robertson et al. Citation2001; Danis et al. Citation2006; Leonelli et al. Citation2017).
The analysis of the tree-ring stable isotopes from glacial environments, in the presence of young and shallow soils, has the potential to make mid- to long-term spatiotemporal hydrological reconstructions in the vicinity of glacier streams, especially focusing on cellulose δ18O. In fact, trees growing in the glacial environments of the Alps are highly sensitive to the δ18O changes in the soil waters induced by glacier meltwater or by snowmelt and may be used to date and reconstruct past glacier runoff events (Leonelli et al. Citation2014) or to reconstruct past winter and summer precipitation δ18O, respectively (Leonelli et al. Citation2017). An important assumption for the present study is that in the study area, the cellulose δ18O may be influenced by the δ18O of winter snow and summer precipitation (Leonelli et al. Citation2017). In the intermountain west of the United States the use of hydrogen isotope ratios to track the source waters of trees has underlined differences between young and mature trees growing along or far from a stream (Dawson and Ehleringer Citation1991): young trees were fed by precipitation (far from the stream) or by stream waters (along the stream), whereas mature trees along the stream used little or none of the stream water, being mainly fed by waters from deeper soil strata, thus underlining a possible change in the source water used by trees while growing and developing a more mature root system.
Combined analyses of the stable carbon and oxygen isotope ratios in the annual tree rings provide useful information about the water-use efficiency and physiological processes of the trees and may provide high-resolution information on past and ongoing trends in hydrological changes because the variations in source water δ18O are often more important for explaining cellulose-δ18O compared to the needle-water enrichments (Treydte et al. Citation2014).
With the aim of characterizing the impacts of both the climate and the ongoing glacio-hydrological changes on trees colonizing and growing in the neo-deglaciated forefield of the Forni Glacier, one of the largest Italian valley glaciers, we (1) analyze the climate impacts on tree-ring growth at two sites where we assume the different importance of glacier meltwater: one site, the GL site, was chosen along the glacier stream, where trees grow on the stream banks very close to the running waters that come directly from the Forni Glacier; the other site, the SL site, was chosen as a control site toward the left valley slope, where the trees are mainly fed by snow meltwaters and precipitation and by secondary, small, slope tributaries. (2) We assess the climate influences on tree-ring stable carbon and stable oxygen isotopes. (3) We estimate the soil-water δ18O signature at both the GL and SL sites by means of an isotope model. (4) We evaluate the input of the glacier meltwater δ18O signatures on the tree-ring cellulose δ18O over time. Our hypotheses are that the tree physiology and growth at the GL site may be influenced by the vicinity of the dynamic environment of the glacier stream, with its daily and seasonal changes in water discharge, but that the strongest signals are found in the δ18O signature, with trees at the GL site being more depleted in δ18O than those at the SL site.
Materials and methods
Study sites
Two forest sites of European larch (Larix decidua Mill.) were selected in the summer of 2011 in the Forni Glacier forefield (central Italian Alps, lat. 46°25ʹ6ʺN; long. 10°34ʹ00ʺE) at an altitude of approximately 2,195 m a.s.l.: the SL site, toward the valley slope, and the GL site, along the glacier stream left bank with trees growing very close to the stream waters (). At each site, five larch trees of the same age and size classes were selected, and two cores per tree were extracted from the stems at a 1.3 m height, which totalled twenty samples.
Figure 1. Study-area location and position of the sampled trees at the two study sites: GL (along the glacier stream) and SL (toward the valley slope). The photo refers to the tree marked by an asterisk, and was taken toward the southeast direction The position of the two latero-frontal moraines of the Forni Glacier in 1914 and in 1926 is also depicted. Coordinates refer to the UTM zone 32 N.
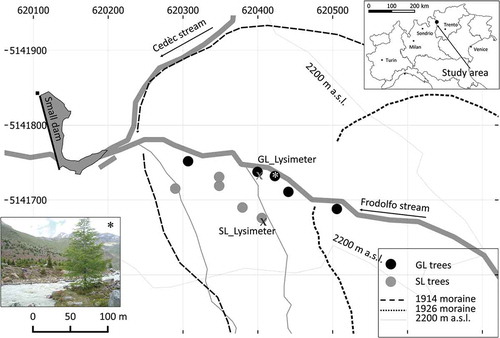
The Forni Valley is located in the northwestern end of the Valtellina, and its water catchment area is highly glacierized and surrounded by several high-altitude mountains with peaks taller than 3,000 m. The valley at its end hosts the tongue of the the Forni Glacier (lat. 46°24ʹ1ʺN; long. 10°35ʹ10ʺE) that, in 2010, extended approximately 20 km2 from an altitude of 3,678 m a.s.l. to 2,510 m a.s.l. (WGMS Citation2012) and is north-northwest oriented. South of the study site on the northeast-oriented valley flanks there are another two small glaciers, the San Giacomo and the northwest-San Giacomo (lat. 46°24ʹ8ʺN; long 10°33ʹ20ʺE), which together total approximately 0.16 km2 and reach, in their lower portions, 3,020 m a.s.l. and 2,920 m a.s.l., respectively. The Forni Glacier tongue retreated from the study area in the valley bottom in 1914–1926 and left several morainic deposits that formed arches in the glacier forefield and on the valley slopes (Pelfini et al. Citation2014). The soils in the valley bottom are poorly developed; they present only A and C horizons and are 15–30 cm deep. Gravel abundance is high (40–50%) and the pH is acidic (5–5.9). The lithology is characterized by mica-schist and paragneiss of the Pejo unit (Argenton et al. Citation1980). Currently, the glacier forefield, where the GL and SL sites are located, is mainly colonized by Norway spruce (Picea abies Karst.) and European larch (Larix decidua Mill.). Swiss stone pine (Pinus cembra L.) is nearly absent from the glacier forefield, whereas outside the frontal Holocene moraines and along the lower Forni Valley it forms a pure forest up to the treeline, reaching approximately 2,300 m a.s.l.
Construction of ring-width and stable isotope chronologies
All wood cores were prepared cutting transversal surfaces with a blade and then the ring widths were counted and measured with a 1/100 mm accuracy using a measuring table and the TSAP software (both RINNTECH, Heidelberg, Germany). The twenty individual growth series were cross-dated visually against each other and statistically against the respective mean chronology (using the software COFECHA; Grissino-Mayer Citation2001), and the age-dependent growth trends were removed from the raw series by fitting a cubic spline with cutoff at two-thirds the series length. Growth indices were obtained as ratios of measured versus modeled values, and a robust bi-weight mean was then calculated (Cook, Shiyatov, and Mazepa Citation1990), finally obtaining the GL and SL standard chronologies.
To construct the chronologies of stable carbon and oxygen isotope ratios, dated tree rings for the period 1980–2010 were split from the cores using a razor blade. For each site and year, the tree rings were pooled and milled together to a powder less than 0.05 mm, from which the α-cellulose was extracted (method as in Loader et al. Citation1997). A mass of 0.6 ± 0.1 mg of cellulose per year was weighed in silver capsules to determine δ18O by using an isotope ratio mass spectrometer, treating the samples with high-temperature pyrolysis. For δ13C, a mass of 0.7 ± 0.1 mg per year was weighed in tin capsules, and the samples were combusted under an excess of oxygen. Stable isotope measurements were done at the IRMS Lab of the Swiss Federal Institute for Forest, Snow and Landscape Research WSL, and cross-tests on some cellulose samples of the SL site were performed at the IRMS Lab of the University of Campania. At the WSL, the samples were weighed in silver capsules (aliquots of 0.8–1.0 mg) and pyrolyzed at 1,450°C (PYRO-cube, Elementar, Hanau, Germany) to determine the δ18O values of the obtained CO by a Delta Plus XP isotope ratio mass spectrometer (ThermoFinnigan MAT, Bremen, Germany) via a ConFlo III interface (ThermoFinnigan MAT). Isotope ratios were referenced to the international standard VSMOW with a reproducibility of 0.2 per mill (Weigt et al. Citation2015). At the University of Campania, the carbon and oxygen stable isotope compositions were measured by continuous-flow isotope ratio mass spectrometry (Delta V Advantage, Thermo Scientific, Bremen, Germany) using 0.06 mg and 0.3 mg for 13C and 18O determinations, respectively. Isotopic compositions are expressed in delta notation (‰) relative to accepted reference standards: Vienna Pee Dee Belemnite for carbon and Vienna Standard Mean Ocean Water for oxygen. The standard deviation for the repeated analysis of an internal standard (commercial cellulose) was lower than 0.1 per mill for C and lower than 0.5 per mill for O. Both the δ13C and δ18O chronologies at the SL site have already been presented by Leonelli et al. (Citation2017), as were the related climatic analyses. A correction to the δ13C raw series at both sites was applied by means of linear interpolation to compensate for the decreasing δ13C in the organic matter related to the fossil-fuel combustion and increasing atmospheric concentration (Francey et al. Citation1999; McCarroll and Loader Citation2004).
δ18O signature of precipitation, glacier meltwater, and soil
Water samples from the glacier stream directly fed by the Forni Glacier site were collected monthly from July to September in 2013, 2014, and again in 2016 (missing 2015 for operational reasons), and the δ18O of these water samples was measured. Concurrent with the water sampling, soil-water samples were collected at the rooting depth of approximately 20 cm (soil gravelly C horizon), from July to September 2016, by means of two suction lysimeters equipped with ceramic cups: one of the lysimeters was located at the SL site, and the other was at the GL site (). The suction cup lysimeters (5 cm diameter, 30 cm length) consist of a porous ceramic cup (two-bar air entry pressure) epoxy resin-bonded to a PVC body. Nylon compression fittings threaded into the top cap were used to attach lengths of polyethylene tubing to the sample. A manual pressure-vacuum pump was used to create a depression inside the cup and to recover the sample, once an equilibrium between cup and soil pressures was reached. The two-bar air entry pressure is the pressure required to force air through a saturated ceramic pore, this means that it is suitable to sample in the range of 0–2 bar of soil suction, which is from saturation much beyond the soil field capacity (0.33 bar).
From the Global Network of Isotopes in Precipitation (GNIP, IAEA/WMO Citation2018) we obtained monthly data of precipitation δ18O at Pontresina (50 km west from the study sites) that was completed back in time with the series from the Guttannen, Grimsel (Switzerland), and Villacher Alpe (Austria) stations. All sites in the database were within a range of 200 km from our study site and were at an altitude of more than 1,000 m a.s.l. (Leonelli et al. Citation2017). To estimate the precipitation δ18O at the Forni site, we first calculated a mean altitudinal and latitudinal δ18O gradient () on monthly values between Pontresina (46.4914°N, 9.89818°E, altitude 1,724 m a.s.l.) and a point within the study area (46.4183°N, 10.5666°E, altitude 2,195 m a.s.l.) using the Online Isotopes in Precipitation Calculator (Bowen Citation2018). We calculated the average differences between the predicted δ18O monthly values of the Forni site and the predicted δ18O monthly values of the Pontresina station: the mean difference (i.e., the
) is −0.68 ± 0.10 per mill; the bar above the term ALG, and above some of the terms for the following equations, means that it is an average value.
Because winter and summer precipitation δ18O (W&S_δ18O; i.e., the mean δ18O of the period from October to March and from May to September) is the main driver of δ18O variability at the SL site (Leonelli et al. Citation2017), for each year i throughout 1980–2010, we then estimated the actual δ18O values of W&S precipitation δ18O at the Forni site by adding the to the Pontresina series:
The soil water δ18O at the SL site for each year i was then linked to W&S_δ18OForni as follows:
where f is an unknown fractionation factor. As previously described, soils in the area are very thin and the precipitation waters are expected to enter in the profile and replenish the soil waters almost without fractionations, with the exception of soil-surface evaporative processes: we here assume that the same evaporative processes and the following soil fractionation of minor entities occur at two sites in the same way, changing the δ18O of precipitation of the same f factor.
The glacier meltwater input δ18O (GMWI_δ18O) to the cellulose δ18O at the GL site was finally estimated for each year i throughout 1980–2010 by a procedure based on the following steps:
We first calculated the overall mean tree-ring cellulose δ18O enrichment at the SL site () during 1980–2010, considering only the input (precipitation) and output (cellulose) δ18O values for each year i and disregarding all the fractionation passages from the soil surface to deeper soil horizons, to the leaves and stem:
(2) Because both SL and GL sites are under the same climatic and pedologic conditions but not under the same geomorphologic settings (given the vicinity of the GL site to the glacier stream), we expect that the same fractionation mechanisms in the trees, because of climate and related physiological responses occurring at the SL site, also apply to the GL site. At this site, however, the soil-water δ18O may also be influenced by the abundance of glacier meltwaters running very close to the trees. The expected soil water δ18O signature at the GL site (equation 4) was therefore estimated by subtracting the mean cellulose δ18O enrichment at the SL site (calculated from winter and summer precipitation δ18O, before surface fractionation) from the GL cellulose δ18O and by adding the same unknown f factor of equation 2 (thus assuming that the same physiological conditions occur at both the SL and GL trees, as well as the same surface fractionations):
(3) Given the different site geomorphologic settings, we assume that at the GL site both snow melt and precipitation and glacier meltwater δ18O may influence the cellulose δ18O, whereas at the SL site, only snow melt and precipitation δ18O play a role. To estimate the input given by glacier meltwaters at the GL site, the soil water δ18O at the SL site was subtracted from the expected soil water δ18O at the GL site (equation 4). The glacier meltwater input was calculated as follows (equation 5):
Climate data
Meteorological data were collected at the Forni station, located at the Small Dam (in ), and at the Bormio and Santa Caterina Valfurva stations, within a distance of 16.5 km from the study sites. These stations are maintained by the Regional Environmental Protection Agency (ARPA) of Lombardy, which manages the Lombardy stations of the network of the former Italian Hydrological Service. Their monthly temperature and precipitation records were then subjected to the homogenization procedure described in Brunetti et al. (Citation2006), using also other reference series from the database of Italian temperature and precipitation records set up by the Institute of Atmospheric Sciences and Climate of the National Research Council (ISAC/CNR) and by the University of Milan (Brunetti et al. Citation2006; Simolo et al. Citation2010; Crespi et al. Citation2018). Finally, to set up complete temperature and precipitation records for the study site, the Bormio and Santa Caterina data were used to fill the gaps in the Forni observations. Gap filling was performed by means of the anomaly method, as described in Crespi et al. (Citation2018).
Climate sensitivity
The climate signals in the ring-width and stable-isotope chronologies of the GL and SL sites were detected by correlation analyses using the monthly and seasonal data of the temperature, precipitation, and precipitation δ18O from June of the year prior to growth to the current September. The climatic analysis on the SL tree-ring records is the only part of the data in the current research that has already been presented in Leonelli et al. (Citation2017), although with different, dendroclimatic purposes. The analysis was performed during the period 1980–2010, and simple linear regressions between the tree-ring δ18O and seasonal temperature of winter (ONDJ), summer (AMJJ), and their aggregations were performed. Finally, the same climatic analyses were applied to the GMWI_δ18O series.
Results
The two standard chronologies of European larch constructed at the SL and GL sites show a good agreement in growth patterns during the analyzed period 1980–2010 (). In particular, the similarity index Glk (Gleichläufigkeit; Schweingruber Citation1988) indicates a statistically significant agreement of the interval trends between the two standard chronologies (with 77 percent of upward or downward concordant trends) and a correlation coefficient greater than 0.5 (). Throughout the considered period, both series show a maximum growth peak in 1994 and a very pronounced decrease in tree-ring growth variability since 1996. In 1986 and 1987, tree growth at the GL site shows a marked decrease in contrast to the control site SL.
Table 1. Statistics calculated between standard chronologies (RWI = ring-width index), δ13C, and δ18O chronologies at the SL and SL sites, during the period 1980–2010 (n = 31): Glk = Gleichläufigkeit (Glk), correlation coefficient (CC), and t value. Significance level: * = p < .05; ** = p < .01; *** = p < .001.
Figure 2. The two ring-width standard chronologies constructed at the GL and SL study sites and the corresponding number of trees available in each year.
The chronologies of stable carbon isotopes corrected for the decline in atmospheric δ13C still show a slightly negative trend during 1980–2010 (). The two series show the highest coherence in terms of Glk and correlation coefficients (), both of which show highly significant values (p < .001). Both series show a maximum enrichment in δ13C in 1992, and the difference between the GL and the SL chronologies shows no trend throughout the considered period (). The two chronologies of the stable oxygen isotopes show low similarities in interval trends (), but the considered indices still show statistically significant values (). The GL site chronology shows a marked negative trend of cellulose δ18O depletion since 2001, whereas in the previous period it shows values that are rather similar to those of the SL site and higher values in both 1980 and 1981. The difference between the GL and SL sites shows a marked and a statistically highly significant negative trend over time, with the lowest δ18O concentrations measured in 2001 and 2009.
Figure 3. (a) The two δ13C chronologies and the two δ18O chronologies; (b) at the GL and SL sites together with the respective regression lines with equations; in (c) and (d) the δ13C and the δ18O yearly differences GL–SL are depicted together with the regression lines with equations and standard errors of the regression parameters.
The climatic analysis performed on the standardized ring-width chronologies and the δ13C chronologies revealed common responses to the selected climatic variables (, ). Tree-ring growth at both sites is enhanced by the summer months’ temperatures, particularly by the July temperature, and by the late summer precipitation (August temperature has an influence only at the SL site). Early summer precipitation up to July, instead, exerts a negative influence on tree-ring growth. June temperature is negatively correlated with δ13C at both sites. For δ18O, the SL and GL chronologies show almost opposite responses both to temperature and precipitation (, ). The δ18O at the GL site is negatively correlated with the monthly and seasonal temperature variables from October of the year prior to growth to January and from April to July, whereas the δ18O at the SL site is positively correlated with the August temperature and negatively correlated with March precipitation. Additionally, the response to the precipitation δ18O is different at the two sites, with only the SL chronology being positively correlated with previous winter and summer precipitation δ18O (); indeed, the tree-ring cellulose δ18O at this site is strongly driven by the δ18O from November of the previous year to March (i.e., of winter snowfall), and by the August precipitation δ18O (for further details on the signals recorded in the SL chronology, refer to Leonelli et al. [Citation2017]).
Figure 4. Correlation coefficients calculated during the period 1980–2010 between monthly variables of temperature and precipitation from June of the year prior to growth (−1) to current September, and the following chronologies: (a) ring-width index, (b) δ13C, and (c) δ18O. Additionally, the same analysis is performed (d) between seasonal temperature variables and tree-ring δ18O and (e) between tree-ring δ18O and monthly and seasonal precipitation δ18O. The variable aggregation in (d) and (e) refers to mean temperature values calculated from the two preceding seasonalized variables along the x-axis. Statistically significant values: *p < .05; **p < .01; ***p < .001. In (a), (b), (c), and (e) values are related to the SL site as in (Leonelli et al. Citation2017).
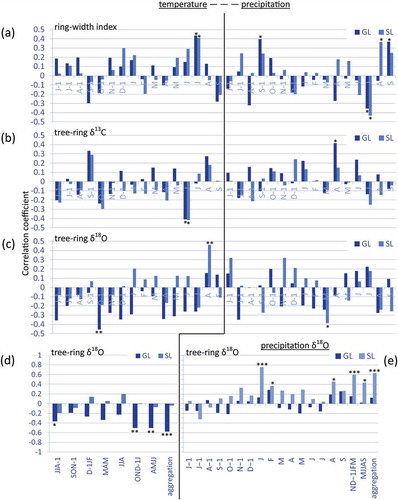
The regression of the tree-ring δ18O as a function of the winter (ONDJ) and summer (AMJJ) temperatures and their aggregation (–, respectively) shows the significant distribution of GL points along a line of negative slope, whereas for SL, no significant relationships with these variables are found.
Figure 5. Linear regression between the cellulose δ18O at the GL and SL sites (black dots and gray points, respectively) and (a) the mean temperature of the months from October prior to growth (−1) to the current January, (b) the months from April to July, and (c) the aggregation of these two variables. The linear regression equation is reported for all regressions, as well as the corresponding equations, standard errors of the regression parameters, and determination coefficients. Statistically significant regressions: *p < .01; ***p < .001.
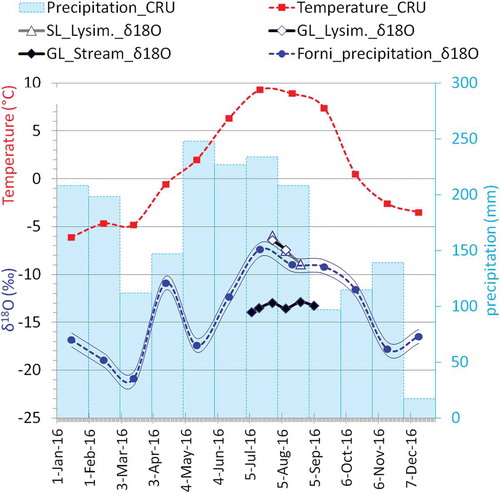
The fractionation processes involved in the tree-ring stable isotope signature can be detected by the observation of the stable isotope distribution of water in the environment. At the Forni site during the three years of observation, 2013, 2014, and 2016 (), the δ18O general mean from July to August is −9.26 ± 1.06 per mill in precipitation (estimated values from the Pontresina series and equation 1; arithmetic unweighted means of isotope ratios) and −13.75 ± 0.69 per mill in the glacier stream (mean of measured values), with a mean difference of −4.49 ± 1.10 per mill ( and ). The two lysimeters show almost the same values of δ18O at both sites. These values are slightly higher than the precipitation signature; however, they show the same trend of the precipitation δ18O.
Table 2. Values of δ18O for the years and summer months (July to September) of 2013, 2014, and 2016 at the Forni site: precipitation δ18O (estimated values from the Pontresina series, equation 1; GL stream δ18O (measured values). The table also reports three columns of some noteworthy differences in δ18O, and four rows of the JAS means and general means during the three years of observations, together with the respective standard deviations (σ).
Figure 6. Climate data and water δ18O values for 2016: temperature and precipitation monthly values (CRU dataset ver. 4.0, Harris et al. Citation2014), δ18O of the lysimeters at SL and GL sites, δ18O measured in the GL stream, and δ18O of the Forni site derived from the Pontresina station, applying equation 1: the thin blue lines depict the associated error (± 0.72‰).
The estimation of the glacier meltwater input (GMWI) to the cellulose δ18O at the GL site was obtained through a series of relations based on equations 1–5, starting from the Forni Glacier precipitation δ18O in winter and summer (W&S_δ18OForni)i (equation 1), from the estimation of the soil-water signature at the SL site (equation 2), and from the mean δ18O enrichment recorded in the tree-ring cellulose at the SL site (equation 3): = 48.21 ± 1.00‰ during the 1980–2010 period. The estimated soil-water δ18O signature at the GL site (SW_δ18OGLsite) (equation 4) after 1999 shows several values negatively exceeding the soil-water δ18O at the SL site and its variability given by ± 1 standard deviation ().
Figure 7. (a) Soil-water δ18O at the SL site is depicted with a grey line together with ± 1 standard deviation lines (SDEV), and the expected soil water δ18O at the GL site during the 1980–2010 period is depicted with a dashed line: in both cases (equations 2 and 4, respectively) the soil surface fractionation factor was set to zero, f = 0. In the bottom, the blue histogram bars depict the annual GMWI δ18O calculated with equation 5 and the green line depicts the values of ONDJ–AMJJ mean temperatures expressed as z-scores (−1 refers to months prior to growth). (b) Regression of the GMWI δ18O as function of ONDJ–AMJJ mean temperatures is expressed in °C; the regression line also reports the equations as well as the standard errors of the regression parameters and the determination coefficient.
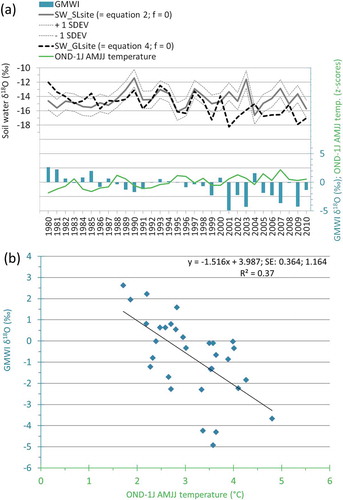
The glacier meltwater input (GMWI_δ18O), given by the differences in soil-water δ18O at the two sites (equation 5) during the considered period is especially evident since 2001 (), when the strongly negative input to the δ18O in the tree-ring cellulose at the GL site reached values exceeding −4 per mill. This input is consistent with the glacier meltwater signature, which has more depleted values of approximately −4.49 per mill with respect to the precipitation δ18O of summer months ().
The regression of GMWI_δ18O as a function of winter and summer temperature (W&S temperature; i.e., the mean temperature of the period from October to March and from May to September; ), shows that the relation with this temperature variable is stronger than the relation found for the GL cellulose δ18O. The W&S temperature explains up to 37 percent of GMWI_δ18O variance and only up to 33 percent of GL_δ18O cellulose variance ().
Discussion
Our results underline the impacts of water regime changes on the tree-ring cellulose δ18O signature of a high-altitude forest colonizing the Forni Glacier forefield. This glacier is still retreating after the short-term re-advance that occurred in the mid-1980s. Its total retreat amounts to more than 700 m during the period 1980–2010 (), witnessing the dramatic transformation occurring in these environments that is primarily driven by climate change and warmer temperatures.
Figure 8. Cumulative front variations of the Forni Glacier during the period 1980–2010 (WGMS Citation2017), smoothed with a fifteen-year Gaussian curve.
The tree-ring growth at the SL and GL sites present similar patterns as expected, because they have trees of similar age and size and the two sites are rather close to each other. Trees at the two sites grow under the same climatic, pedologic, and physiological conditions, with the only exception being the glacier stream influence at the GL site. The two δ13C chronologies show a common negative trend in δ13C, probably because of the increase of atmospheric CO2 affecting tree physiology and stomatal conductance (McCarroll et al. Citation2009). These chronologies are highly correlated at the two sites, thus highlighting also the similar eco-physiological conditions of the trees growing in the glacier forefield. These similar patterns in tree-ring growth and in δ13C are also reflected in the similar responses to climate. Summer temperature, particularly in July, enhances tree-ring growth, whereas precipitation in this month negatively influences tree-ring growth. These opposite response patterns to temperature and precipitation are typical, especially when these climatic factors are negatively correlated with each other, even if larch at high altitudes usually mainly responds to June temperatures (e.g., Coppola et al. Citation2012). A positive influence of precipitation on tree-ring growth is instead recorded in August (SL) and September (GL).
The uncommon negative correlation between δ13C and June temperature could be because of the presence of snow on the ground in this month (as also suggested by the winter-precipitation signal of δ18O recorded at the SL site); therefore, snowmelt induced by higher temperatures could be a water source for the trees. In the context of higher water supply, a decrease in δ13C is then expected. Both the SL and GL sites present this atypical response to temperature, underlining similar environmental conditions. The tree-ring growth of larch in the glacier forefield at both sites seems to be delayed by one month with respect to what is usually found in the literature, thus underlining a possible negative effect exerted by snow meltwaters replenishing the glacier forefield water table, or by cold air drainage off the glacier, pooling in the valley.
In our model for estimating the δ18O of glacier meltwater inputs (equation 5), precipitation, snowmelt, and the surface fractionation factor f (equations 2 and 4) are not measured and are assumed as factors of the same magnitude at both sites, because trees grow under the same climatic, altitudinal, and eco-physiological conditions, with the only exception being the glacier influence at the GL site. About the climatic influence on δ18O, the nearly opposite responses to temperature and precipitation at the SL and GL sites, respectively, clearly show the influence of different water sources at the two sites. In fact, only at the GL site do we find a negative correlation between previous winter and summer temperatures on the cellulose δ18O. This relationship is explainable by the double effect that higher (or lower) temperatures may exert on glacier meltwaters: higher temperatures induce higher ablation rates in the glacier, which indicates, first, higher discharges of the glacier stream and, second, higher ratios of δ18O-depleted waters in the glacier stream. Considering the strength of the interannual climatic variability on the cellulose δ18O at the GL site (likely linked to glacier melt processes, differently from the SL site), a possible influence of riverbank erosion that could occur along the stream seems a less important factor in determining the recent changes occurring in the soil-water signature at the GL site.
The climatic signals of previous winter and summer precipitation δ18O were found only at the SL site, thus underlining the different only meteoric origins of the soil water at this site. Indeed, at the SL site the climatic signal of precipitation δ18O is well recorded in the cellulose δ18O (Leonelli et al. Citation2017), while at the GL site, the cellulose δ18O is also driven by the glacier inputs. Considering the glacier inputs over time, it is especially since 1999 that major changes were recorded at the GL site, whereas the two sites previously showed almost no differences in soil waters (with the exception of 1980 and 1981). Interestingly, W&S temperature correlates better with the calculated glacier meltwater inputs (GMWI_δ18O) than with the cellulose δ18O of the GL site. Linear regressions underline that this climatic variable explains as much as 37 percent of GMWI_δ18O variance () and as much as 33 percent of cellulose δ18O variance (). At the SL site, we find a purer climatic signal of precipitation δ18O than at the GL site, whose cellulose δ18O is also influenced by the glacier meltwater inputs.
As found in east England with oaks (Robertson et al. Citation2001) or in the Swiss Alps (Treydte et al. Citation2009), tree-ring cellulose δ18O may reflect the precipitation δ18O. Additionally, Danis et al. (Citation2006) found that European larch cellulose reflects the signature of previous winter precipitation recharging soil and ground waters in the French Alps. Indeed, in high mountains the isotopic signature of snow may be predominant, as found in an undisturbed subalpine forest of the Rocky Mountain, where Hu et al. (Citation2010) underlined that the xylem water by mid-August may reflect the isotopic signature of snowmelt from 57 percent to 68 percent. Our explanation is that during summer at the Forni Valley study site, the slope water tables are replenished by snowmelt and precipitation, whereas along the glacier stream the isotopic signature of the glacier meltwaters may be predominant on the snowmelt and precipitation signals. Our finding indicates that trees along the glacier stream are fed also by the glacier stream waters and may record mid- to long-term changes in the water regimes of the glacier stream. Tracking source water δ18O changes by analyzing the tree-ring cellulose δ18O and by applying the proposed isotope model may help in reconstructing past and ongoing changes in the environment (e.g., Ellsworth et al. Citation2013; Bose et al. Citation2016) especially in remote sites where few on-site stable isotope data are available and long series are lacking.
Conclusions
We have demonstrated that in the past decade of analysis trees in the glacier forefield of a highly glacierized Alpine catchment growing along the glacier stream are mainly fed by meltwaters of glacial origins, whereas trees growing in the glacier forefield toward the valley slope are mainly fed by waters of meteoric origins, as reflected in their respective cellulose δ18O. The negative correlation between (previous) winter and summer temperatures with the δ18O of glacier meltwater inputs in soil waters at the GL site clearly shows the glacier influence on tree-ring isotopic signature. The tree-ring cellulose δ18O isotopic signature of the trees growing along the glacier stream underlines a recent period of stronger δ18O depletion that may be linked to either a higher glacier discharge or a higher concentration of glacier meltwaters in the stream. Both scenarios are compatible with the ongoing trends of higher atmospheric temperatures inducing higher ablation rates of the Forni Glacier. Further field measurements could investigate the inner mechanisms explaining the more δ18O-depleted soil waters along the stream banks; however, at this stage we can state that these changes were recorded since 1999.
Because of the ongoing temperature warming, glaciers are retreating almost everywhere on the Alps (WGMS Citation2017); consequently, glacier forefields are rapidly expanding and are a place of forest succession if they are at an altitude below the treeline. These forests, even if they are marginal in terms of land cover and productivity, can be seen as sentinels of the ongoing climatic and hydrologic changes that involve the European Alps and high-mountain areas in general. Monitoring the hydrological changes in these sensitive forests in the mid- to long term will allow the reconstruction of the ongoing glacio-hydrologic dynamics and the assessment of climate-change impacts on mountain forests for what concerns changes in glacier meltwater regimes. Our tree-ring sampling approach, together with the proposed isotope model for estimating δ18O meltwater inputs, opens new opportunities to reconstruct mid- to long-term changes in glacier meltwater streams in remote sites.
Acknowledgments
We thank Prof. James W. Kirchner (WSL and ETH-Zurich) for the helpful discussion on stable isotope hydrology; Prof. Roberto Comolli for suggestions on soil-water sampling; Dr. Giuliano Dreossi for measuring stable isotopes in water samples from 2016 at the Università Ca’ Foscari, Venezia; Loic Schneider and Stella Fusco for the lab analyses at WSL; and Aurora Merlini for her help in the water-sample collection during the summer of 2014.
Additional information
Funding
Related Research Data
References
- Argenton, A., G. V. Dal Piaz, S. Martin, and E. Schiavon. 1980. Osservazioni preliminari sul versante occidentale della dorsale Gran Zebrù-Cevedale-Corno dei Tre Signori (Austroalpino superiore, Alpi Orientali). Rendiconti della Societa Italiana di Mineralogia e Petrologia 36 (1):65–68.
- Battipaglia, G., M. Jäggi, M. Saurer, R. T. W. Siegwolf, and M. F. Cotrufo. 2008. Climatic Sensitivity of δ18O in the wood and cellulose of tree rings: results from a mixed stand of Acer pseudoplatanus L. and Fagus sylvatica L. Palaeogeography, Palaeoclimatology, Palaeoecology 261 (1–2):193–202. doi:10.1016/j.palaeo.2008.01.020.
- Battipaglia, G., M. Saurer, P. Cherubini, C. Calfapietra, H. R. McCarthy, R. J. Norby, and M. F. Cotrufo. 2013. Elevated CO2 increases tree-level intrinsic water use efficiency: Insights from carbon and oxygen isotope analyses in tree rings across three forest FACE sites. New Phytologist 197 (2):544–54. doi:10.1111/nph.12044.
- Bose, T., S. Sengupta, S. Chakraborty, and H. Borgaonkar. 2016. Reconstruction of soil water oxygen isotope values from tree ring cellulose and its implications for paleoclimate studies. Quaternary International 425 (December):387–98. doi:10.1016/j.quaint.2016.07.052.
- Bowen, G. J. 2018. The online isotopes in precipitation calculator, version 3.1. http://www.waterisotopes.org.
- Brunetti, M., M. Maugeri, F. Monti, and T. Nanni. 2006. Temperature and precipitation variability in Italy in the last two centuries from homogenised instrumental time series. International Journal of Climatology 26 (3):345–81. doi:10.1002/joc.1251.
- Cook, E. R., S. Shiyatov, and V. Mazepa. 1990. Estimation of the mean chronology. In Methods of dendrochronology, ed. E. R. Cook and L. A. Kairiukstis, 123–32. Boston: Kluwer Academic Publishers.
- Coppola, A., G. Leonelli, M. C. Salvatore, M. Pelfini, and C. Baroni. 2012. Weakening climatic signal since mid-20th century in European larch tree-ring chronologies at different altitudes from the Adamello-Presanella Massif (Italian Alps). Quaternary Research 77 (3):344–54. doi:10.1016/j.yqres.2012.01.004.
- Crespi, A., M. Brunetti, G. Lentini, and M. Maugeri. 2018. 1961–1990 high-resolution monthly precipitation climatologies for Italy: High-resolution precipitation climatologies for Italy. International Journal of Climatology 38 (2):878–95. doi:10.1002/joc.5217.
- D’Agata, C., G. Diolaiuti, D. Maragno, C. Smiraglia, and M. Pelfini. 2019. Climate change effects on landscape and environment in glacierized alpine areas: retreating glaciers and enlarging forelands in the Bernina group (Italy) in the period 1954–2007. Geology, Ecology, and Landscapes 1–16. doi:10.1080/24749508.2019.1585658.
- D’Amico, M. E., M. Freppaz, G. Leonelli, E. Bonifacio, and E. Zanini. 2015. Early stages of soil development on serpentinite: The Proglacial area of the Verra Grande Glacier, Western Italian Alps. Journal of Soils and Sediments 15 (6):1292–310. doi:10.1007/s11368-014-0893-5.
- Danis, P. A., V. Masson-Delmotte, M. Stievenard, M. T. Guillemin, V. Daux, P. Naveau, and U. von Grafenstein. 2006. Reconstruction of past precipitation δ18O using tree-ring cellulose δ18O and δ13C: A calibration study near Lac d’Annecy, France. Earth and Planetary Science Letters 243 (3–4):439–48. doi:10.1016/j.epsl.2006.01.023.
- Daux, V., J. L. Edouard, V. Masson-Delmotte, M. Stievenard, G. Hoffmann, M. Pierre, O. Mestre, P. A. Danis, and F. Guibal. 2011. Can climate variations be inferred from tree-ring parameters and stable isotopes from Larix decidua? Juvenile effects, budmoth outbreaks, and divergence issue. Earth and Planetary Science Letters 309 (3–4):221–33. doi:10.1016/j.epsl.2011.07.003.
- Dawson, T. E., and J. R. Ehleringer. 1991. Streamside trees that do not use stream water. Nature 350 (March):335–37. doi:10.1038/350335a0.
- Dongmann, G. 1974. The contribution of land photosynthesis to the stationary enrichment of 18O in the atmosphere. Radiation and Environmental Biophysics 11 (3):219–25. doi:10.1007/BF01323191.
- Dye, D. G., and C. J. Tucker. 2003. Seasonality and trends of snow-cover, vegetation index, and temperature in Northern Eurasia: Climate and vegetation variability. Geophysical Research Letters 30:7. doi:10.1029/2002GL016384.
- Ellsworth, P. V., W. T. Anderson, E. Sonninen, M. M. Barbour, and L. S. L. Sternberg. 2013. Reconstruction of source water using the δ18O of tree ring phenylglucosazone: A potential tool in paleoclimate studies. Dendrochronologia 31 (3):153–58. doi:10.1016/j.dendro.2012.10.004.
- Farquhar, G. D., J. R. Ehleringer, and K. T. Hubick. 1989. Carbon isotope discrimination and photosynthesis. Annual Review of Plant Physiology and Plant Molecular Biology 40 (1):503–37. doi:10.1146/annurev.pp.40.060189.002443.
- Fountain, A. G., J. L. Campbell, E. A. G. Schuur, S. E. Stammerjohn, M. W. Williams, and H. W. Ducklow. 2012. The disappearing cryosphere: Impacts and ecosystem responses to rapid cryosphere loss. BioScience 62 (4):405–15. doi:10.1525/bio.2012.62.4.11.
- Francey, R. J., C. E. Allison, D. M. Etheridge, C. M. Trudinger, I. G. Enting, M. Leuenberger, R. L. Langenfelds, E. Michel, and L. P. Steele. 1999. A 1000-year high precision record of δ13C in atmospheric CO2. Tellus B 51 (2):170–93. doi:10.1034/j.1600-0889.1999.t01-1-00005.x.
- Garbarino, M., E. Lingua, T. A. Nagel, D. Godone, and R. Motta. 2010. Patterns of larch establishment following deglaciation of Ventina glacier, central Italian Alps. Forest Ecology and Management 259 (3):583–90. doi:10.1016/j.foreco.2009.11.016.
- Grissino-Mayer, H. D. 2001. Evaluating crossdating accuracy: A manual and tutorial for the computer program COFECHA. Tree-Ring Research 572 (2):205–21.
- Hantel, M., and H.-W. Lucia-Maria. 2007. Sensitivity of Alpine snow cover to European temperature. International Journal of Climatology 27 (10):1265–75. doi:10.1002/joc.1472.
- Harris, I., P. D. Jones, T. J. Osborn, and D. H. Lister. 2014. Updated high-resolution grids of monthly climatic observations - the CRU TS3.10 Dataset: Updated high-resolution grids of monthly climatic observations. International Journal of Climatology 34 (3):623–42. doi:10.1002/joc.3711.
- Hartl-Meier, C., C. Zang, U. Buntgen, J. Esper, A. Rothe, A. Gottlein, T. Dirnbock, and K. Treydte. 2015. Uniform climate sensitivity in tree-ring stable isotopes across species and sites in a mid-latitude temperate forest. Tree Physiology 35 (1):4–15. doi:10.1093/treephys/tpu096.
- Hu, J., D. J. P. Moore, S. P. Burns, and R. K. Monson. 2010. Longer growing seasons lead to less carbon sequestration by a subalpine forest. Global Change Biology 16 (2):771–83. doi:10.1111/j.1365-2486.2009.01967.x.
- Huggett, R. J. 1998. Soil chronosequences, soil development, and soil evolution: A critical review. Catena 32 (3–4):155–72. doi:10.1016/S0341-8162(98)00053-8.
- Huss, M., B. Bookhagen, C. Huggel, D. Jacobsen, R. S. Bradley, J. J. Clague, M. Vuille, W. Buytaert, D. R. Cayan, G. Greenwood, B. G. Mark, A. M. Milner, R. Weingartner, and M. Winder. 2017. Toward mountains without permanent snow and ice. Earth’s Future 5 (5):418–35. doi:10.1002/2016EF000514.
- IAEA/WMO. 2018. Global network of isotopes in precipitation. The GNIP database. http://www.iaea.org/water.
- Kaser, G. 2001. Glacier-climate interaction at low latitudes. Journal of Glaciology 47 (157):195–204. doi:10.3189/172756501781832296.
- Kress, A., R. T. Matthias Saurer, W. Siegwolf, D. C. Frank, J. Esper, and H. Bugmann. 2010. A 350 year drought reconstruction from Alpine tree ring stable isotopes. Global Biogeochemical Cycles 24 (2). doi: 10.1029/2009GB003613.
- Kress, A., S. Hangartner, H. Bugmann, U. Büntgen, D. C. Frank, M. Leuenberger, R. T. W. Siegwolf, and M. Saurer. 2014. Swiss tree rings reveal warm and wet summers during medieval times. Geophysical Research Letters 41 (5):1732–37. doi:10.1002/2013GL059081.
- Labuhn, I., V. Daux, O. Girardclos, M. Stievenard, M. Pierre, and M.-D. Valérie. 2016. French summer droughts since 1326 CE: A reconstruction based on tree ring cellulose δ18O. Climate of the Past 12 (5):1101–17. doi:10.5194/cp-12-1101-2016.
- Leonelli, G., G. Battipaglia, P. Cherubini, M. Saurer, T. W. Rolf, M. M. Siegwolf, B. Stenni, S. Fusco, V. Maggi, and M. Pelfini. 2017. Larix decidua δ18O tree-ring cellulose mainly reflects the isotopic signature of winter snow in a high-altitude glacial valley of the European Alps. Science of the Total Environment 579 (February):230–37. doi:10.1016/j.scitotenv.2016.11.129.
- Leonelli, G., G. Battipaglia, T. W. Rolf, M. S. Siegwolf, U. M. Di Cella, P. Cherubini, and M. Pelfini. 2012. Climatic isotope signals in tree rings masked by air pollution: A case study conducted along the Mont Blanc Tunnel access road (Western Alps, Italy). Atmospheric Environment 61 (December):169–79. doi:10.1016/j.atmosenv.2012.07.023.
- Leonelli, G., M. Pelfini, G. Battipaglia, M. Saurer, R. T. W. Siegwolf, and P. Cherubini. 2014. First detection of glacial meltwater signature in tree-ring δ18O: Reconstructing past major glacier runoff events at Lago Verde (Miage Glacier, Italy). Boreas 43 (3):600–07. doi:10.1111/bor.12055.
- Loader, N. J., I. Robertson, A. C. Barker, V. R. Switsur, and J. S. Waterhouse. 1997. An improved technique for the batch processing of small wholewood samples to α-cellulose. Chemical Geology 136 (3–4):313–17. doi:10.1016/S0009-2541(96)00133-7.
- Marty, C., S. Schlögl, M. Bavay, and M. Lehning. 2017. How much can we save? Impact of different emission scenarios on future snow cover in the Alps. The Cryosphere 11 (1):517–29. doi:10.5194/tc-11-517-2017.
- McCarroll, D., M. H. Gagen, N. J. Loader, K. J. Iain Robertson, S. L. Anchukaitis, H. F. Giles, R. J. Young, A. Kirchhefer, and J. S. Waterhouse. 2009. Correction of tree ring stable carbon isotope chronologies for changes in the carbon dioxide content of the atmosphere. Geochimica et Cosmochimica Acta 73 (6):1539–47. doi:10.1016/j.gca.2008.11.041.
- McCarroll, D., and N. J. Loader. 2004. Stable isotopes in tree rings. Quaternary Science Reviews 23 (7–8):771–801. doi:10.1016/j.quascirev.2003.06.017.
- Naulier, M., M. M. Savard, C. Bégin, F. Gennaretti, D. Arseneault, J. Marion, A. Nicault, and Y. Bégin. 2015. A millennial summer temperature reconstruction for Northeastern Canada using oxygen isotopes in subfossil trees. Climate of the Past 11 (9):1153–64. doi:10.5194/cp-11-1153-2015.
- Pelfini, M., G. Leonelli, L. Trombino, A. Zerboni, I. Bollati, A. Merlini, C. Smiraglia, and G. Diolaiuti. 2014. New data on glacier fluctuations during the climatic transition at ~4,000 cal. year BP from a buried log in the Forni Glacier forefield (Italian Alps). Rendiconti Lincei 25 (4):427–37. doi:10.1007/s12210-014-0346-5.
- Rinne, K. T., N. J. Loader, V. R. Switsur, and J. S. Waterhouse. 2013. 400-year May–August precipitation reconstruction for Southern England using oxygen isotopes in tree rings. Quaternary Science Reviews 60 (January):13–25. doi:10.1016/j.quascirev.2012.10.048.
- Robertson, I., J. S. Waterhouse, A. C. Barker, A. H. C. Carter, and V. R. Switsur. 2001. Oxygen isotope ratios of oak in East England: Implications for reconstructing the isotopic composition of precipitation. Earth and Planetary Science Letters 191 (1–2):21–31. doi:10.1016/S0012-821X(01)00399-5.
- Roden, J. S., G. Lin, and J. R. Ehleringer. 2000. A mechanistic model for interpretation of hydrogen and oxygen isotope ratios in tree-ring cellulose. Geochimica et Cosmochimica Acta 64 (1):21–35. doi:10.1016/S0016-7037(99)00195-7.
- Schweingruber, F. H. 1988. Tree rings: Basics and applications of dendrochronology. doi:10.1007/978-94-009-1273-1.
- Seibt, U., A. Rajabi, H. Griffiths, and J. A. Berry. 2008. Carbon isotopes and water use efficiency: Sense and sensitivity. Oecologia 155 (3):441–54. doi:10.1007/s00442-007-0932-7.
- Sidorova, O. V., R. T. W. Siegwolf, V. S. Myglan, D. V. Ovchinnikov, V. V. Shishov, G. Helle, N. J. Loader, and M. Saurer. 2013. The application of tree-rings and stable isotopes for reconstructions of climate conditions in the Russian Altai. Climatic Change 120 (1–2):153–67. doi:10.1007/s10584-013-0805-5.
- Simolo, C., M. Brunetti, M. Maugeri, T. Nanni, and A. Speranza. 2010. Understanding climate change–induced variations in daily temperature distributions over Italy. Journal of Geophysical Research 115:D22. doi:10.1029/2010JD014088.
- Slemmons, K. E. H., J. E. Saros, and K. Simon. 2013. The influence of glacial meltwater on alpine aquatic ecosystems: a review. Environmental Science: Processes & Impacts 15 (10):1794. doi:10.1039/c3em00243h.
- Stuiver, M., and T. H. Braziunas. 1987. Tree cellulose 13C/12C isotope ratios and climatic change. Nature 328:58–60.
- Terrier, S., F. Jordan, A. J. Schleiss, W. Haeberli, C. Huggel, and M. Künzler. 2011. Optimized and adapted hydropower management considering glacier shrinkage scenarios in the Swiss Alps. In Dams and reservoirs under changing challenges, ed. J. Schleiss and R. M. Boes, 497–508. London: Taylor & Francis Group.
- Treydte, K. S., D. C. Frank, M. Saurer, G. Helle, G. H. Schleser, and J. Esper. 2009. Impact of climate and CO2 on a millennium-long tree-ring carbon isotope record. Geochimica et Cosmochimica Acta 73 (16):4635–47. doi:10.1016/j.gca.2009.05.057.
- Treydte, K. S. Boda, E. Graf Pannatier, P. Fonti, D. Frank, B. Ullrich, M. Saurer, R. Siegwolf, G. Battipaglia, W. Werner, and A. Gessler. 2014. Seasonal transfer of oxygen isotopes from precipitation and soil to the tree ring: source water versus needle water enrichment. New Phytologist 202 (3):772–83. doi:10.1111/nph.12741.
- Walker, L. R., D. A. Wardle, R. D. Bardgett, and B. D. Clarkson. 2010. The use of chronosequences in studies of ecological succession and soil development. Journal of Ecology 98 (4):725–36. doi:10.1111/j.1365-2745.2010.01664.x.
- Weigt, R. B., S. Bräunlich, L. Zimmermann, T. E. Matthias Saurer, E. Grams, H.-P. Dietrich, R. T. W. Siegwolf, and P. S. Nikolova. 2015. Comparison of δ18O and δ13C values between tree‐ring whole wood and cellulose in five species growing under two different site conditions. Rapid Communications in Mass Spectrometry 29 (23):2233–44. doi:10.1002/rcm.7388.
- WGMS. 2012. Fluctuations of glaciers 2005–2010. M. Zemp, H. Frey, I. Gärtner-Roer, S. U. Nussbaumer, M. Hoelzle, F. Paul, and W. Haeberli. eds, Zurich, Switzerland: World Glacier Monitoring Service. doi:10.5904/wgms-fog-2012-11
- WGMS. 2017. Fluctuations of glaciers database. Zurich, Switzerland: World Glacier Monitoring Service. doi:http://dx.doi.org/10.5904/wgms-fog-2017-10.
- Wieser, G., W. Oberhuber, A. Gruber, M. Leo, R. Matyssek,and T. E. E. Grams. 2016. Stable water use efficiency under climate change of three sympatric conifer species at the alpine treeline. Frontiers in Plant Science 7(June). doi:10.3389/fpls.2016.00799