
ABSTRACT
Since the 1960s, warming air and sea surface temperatures have led to decreasing sea ice extent and longer periods of open water in the Canadian Arctic Archipelago (CAA), together with changes in glacier discharge patterns. An important question, therefore, is whether there is a relationship between changing sea ice conditions, glacier dynamics, and iceberg production in this region. Using synthetic aperture radar (SAR) (Radarsat-1, Radarsat-2, and ALOS PALSAR) and optical (Landsat 7 and 8) satellite imagery, iceberg plume events and sea ice break-up/freeze-up dates between 1997 and 2015 are investigated for 40 tidewater glaciers around the Prince of Wales (POW) Icefield, Ellesmere Island. Results show a clear relationship between the presence of sea ice and the production of icebergs, with ~49% of total iceberg plume events occurring during the 3–4 month long summer open water season and ~51% of events when sea ice was present the remaining 8–9 months of the year. There is no clear evidence of recent increases in iceberg production on a regional basis, but on a local, individual glacier scale there has been a connection between periods of increased iceberg plume events and: (a) acceleration in the surface velocity of Trinity and Wykeham glaciers; (b) increase in terminus retreat rates for glaciers which have not accelerated in flow speed over the past ~5–10 years. Comparisons with ocean temperature, surface air temperature from NCEP-NCAR reanalysis, and tidal data showed no clear relationship with iceberg plume events.
Introduction
Over the past 40 years, rapid warming has been observed in the Arctic, at a rate twice as fast as the global average (Cohen et al. Citation2014; AMAP, Citation2017). This has occurred partly due to polar amplification, which has been driven primarily by a reduction in sea ice cover (Screen and Simmonds Citation2010; Serreze and Barry Citation2011). Since the 1960s, Central Arctic sea ice extent has decreased by 8.6% decade−1 during the summer, and sea ice thickness at the end of melt season decreased by about 1.6 m (~50%) between 1958 and 2007 (Stroeve et al. Citation2008, Citation2014). These changes have been attributed to warming air and sea surface temperatures in the Canadian Arctic Archipelago (CAA), leading to longer periods of open water (Stroeve et al. Citation2014). Arctic warming has also had a significant impact on the glaciers and ice caps of this region, which have become the largest contributor to sea level rise outside of the Greenland and Antarctic ice sheets since 2003 (Gardner et al. Citation2011, Citation2012; Harig and Simons Citation2016). There has been a marked acceleration in the retreat rates of CAA tidewater glacier termini since the start of the 21st century (Cook et al. Citation2019). Unlike land terminating glaciers, tidewater glaciers are susceptible to both atmospheric and oceanic variability (Moon and Joughin Citation2008; Howat et al. Citation2010; O’Leary and Christoffersen Citation2013). As a result, increased air and sea surface temperatures can lead to thinning of a tidewater glacier from both above and below, making it more susceptible to calving (Moon and Joughin, Citation2008; Amundson et al. Citation2010; Howat et al. Citation2010).
There are many factors that control the stability of tidewater glaciers (Vieli and Nick Citation2011), but in the Arctic it seems that the presence of landfast sea ice and an ice mélange (mixture of sea ice and densely packed calved icebergs) at their termini influence terminus stability (Higgins Citation1991; Reeh et al. Citation2001; Herdes et al. Citation2012; Carr, Vieli, and Stokes Citation2013; Carr, Stokes, and Vieli Citation2014; Moon, Joughin, and Smith Citation2015; White and Copland Citation2019). Past research conducted predominantly on outlet glaciers in Greenland and the Russian Arctic have identified the buttressing effect of sea ice or an ice mélange on the terminus of a glacier by inhibiting iceberg calving (Reeh et al. Citation2001; Amundson et al. Citation2010; Christoffersen et al. Citation2012; Carr, Vieli, and Stokes Citation2013; Carr, Stokes, and Vieli Citation2014; Moon, Joughin, and Smith Citation2015). As air and ocean temperatures increase toward late spring, the sea ice begins to break up, and the ice mélange also begins to disintegrate. Once calving begins, the mélange breaks up further as open water allows for more calving, and waves promote further disintegration (Howat et al. Citation2010; Amundson et al. Citation2010).
Previous work on tidewater glaciers in the CAA has primarily focused on their surface velocities and ice fluxes to the ocean (Williamson et al. Citation2008; Van Wychen et al. Citation2014, Citation2016; Millan, Mouginot, and Rignot Citation2017), but little research has been undertaken on the physical processes controlling iceberg production. The main study for the CAA is that of Herdes et al. (Citation2012), who investigated the relationship between iceberg plume events (caused by glacier calving) and ice mélange conditions for Fitzroy and Belcher glaciers on NE Devon Island. When we refer to iceberg plume events, we mean a mixture of freshly calved glacier ice and the ice mélange in front of the glacier terminus that are produced when icebergs are calved. Fresh iceberg plume events appear bright in synthetic aperture radar (SAR) scenes and are more easily distinguishable from the calving of singular icebergs and previously produced iceberg plume events. Herdes et al. (Citation2012) found that most iceberg plume events occurred during the open water season, soon after fast ice had broken up at the terminus. An iceberg plume event differs from sikussak (a mixture of multi-year landfast sea ice and icebergs) in that it does not necessarily contain sea ice and can occur in open water (Dowdeswell and Jeffries Citation2017). The study of Van Wychen et al. (Citation2016) reported no significant long-term trends in total ice discharge from tidewater glaciers in the CAA over the period 1999–2015, although significant changes occurred at individual glaciers. In particular, Trinity and Wykeham glaciers flowing from the Prince of Wales (POW) Icefield rapidly sped up over this period and contributed ~62% of total solid ice discharge to the ocean from the CAA in 2016, compared to ~22% in 2000.
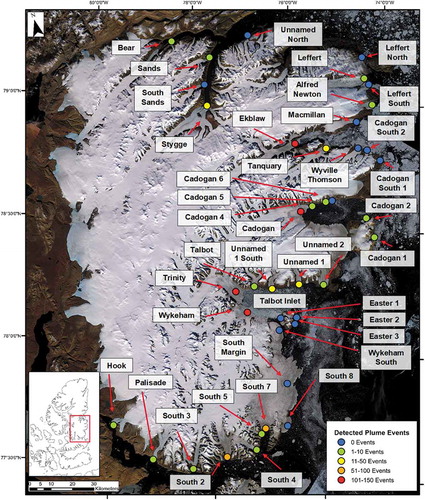
In this study, we provide the first comprehensive assessment of spatial and temporal patterns of iceberg plume event production from an entire ice cap in the Canadian Arctic (). Using >8,000 satellite images (resolution 15 to 100 m) collected around the periphery of POW Icefield, we i) determine which tidewater glaciers provide the primary source of icebergs from this icefield; ii) investigate whether iceberg discharge rates are changing in response to variable sea-ice conditions, glacier dynamics, or external forcing; and iii) characterize the magnitude and timing of iceberg plume events over the period 1997–2015.
Figure 1. Location of tidewater glaciers on Prince of Wales Icefield with >1 km terminus width, and distribution of their cumulative plume events from 1997 to 2015. Inset: Ellesmere Island. Base image: USGS/NASA Landsat 8, July–September 2015.
Study area
The POW Icefield is located on SE Ellesmere Island and contains approximately 73 tidewater glaciers (Sharp et al. Citation2014; Cook et al. Citation2019; ). The icefield is a major source of icebergs in the Canadian Arctic, accounting for ~65% of total glacier ice discharge to the ocean in the CAA in 2015 compared to ~29% in 2000 (Gardner et al. Citation2011; Van Wychen et al. Citation2015, Citation2016, Citation2017). Rapid recent increases in the surface velocity of Trinity and Wykeham glaciers, the two largest outlet glaciers from POW Icefield, have resulted in a doubling of their ice flux to the ocean over the past decade (Van Wychen et al. Citation2016). These glaciers contributed 60% (0.55 Gt a−1) of the POW Icefield total ice discharge in 2000 and 79% (1.43 Gt a−1) in 2015 and, therefore, form a focus in this study (Van Wychen et al. Citation2016). To understand regional controls on iceberg production, we quantified iceberg production from the 40 POW Icefield tidewater glaciers with a terminus width >1 km, including Trinity and Wykeham glaciers (). Image resolution, particularly in historical SAR imagery, precluded an accurate assessment of iceberg production from glaciers <1 km in width, but surface velocity measurements suggest that these contribute <1% of total iceberg discharge from POW Icefield (Van Wychen et al. Citation2016).
Methodology and data
Iceberg plume event identification and classification
Iceberg discharge patterns were quantified through manual analysis of iceberg plume events identified in SAR and optical satellite images. Plume events are much larger (and easier to identify) than individual icebergs. Plumes form because as ice calves from a tidewater glacier, it typically includes many small individual pieces, each of which can rapidly break apart and capsize as they enter the water, creating a rough surface more easily identifiable in SAR imagery. This analysis was completed between 1997 and 2015, for the 40 tidewater glaciers around the POW Icefield with a terminus width >1 km. A total of 8,426 scenes were analyzed between 1997 and 2015 ().
Table 1. Type and number of satellite images analyzed for each year in this study.
SAR imagery provided the primary data source for identifying iceberg plume events as it enabled observation through clouds and at night, and rough surfaces such as freshly calved glacier ice appear bright due to high backscatter. This facilitates the detection of iceberg plume events as they can be distinguished against the darker signature of open water or old sea ice, even under summer melt conditions (Herdes et al. Citation2012). Care was taken to ensure that only new plume events were identified; occasionally, a mélange of sea ice and previously calved icebergs can get blown back against a glacier terminus, but this type of situation is readily identifiable by its lower backscatter relative to new plume events.
For the POW Icefield, a total of 3345 Radarsat-1 and 4433 Radarsat-2 images from the Canadian Ice Service, Alaska Satellite Facility, and National Earth Observation Data Framework Catalog were used from every ~1–3 days between June and October, and every ~1–2 weeks between November and May, for each year over the study period (). These images were collected in ScanSAR Wide mode, with 100 m resolution and 500 km swath width. Additional ALOS PALSAR scenes were used to supplement the Radarsat archive and fill in periods of low temporal coverage. These images were collected in ScanSAR mode, which has a 100 m range resolution and a 250–350 km swath width. ALOS PALSAR images were accessed from the Alaska Satellite Facility, with a total of 220 scenes used for the years 2007–2009.
High resolution (15 m panchromatic) Landsat 7 and Landsat 8 optical data were used to supplement the SAR scenes during periods of daylight and low cloud cover. An average of 10–30 Landsat scenes per year (428 total) were used over the period 1999–2015 (), typically collected between June and September annually, when they were not affected by polar night and considered the most useful. The scenes were acquired from the United States Geological Survey through their online database EarthExplorer (http://earthexplorer.usgs.gov/), with Landsat 7 used from 1999–2014 and Landsat 8 from 2013–2015.
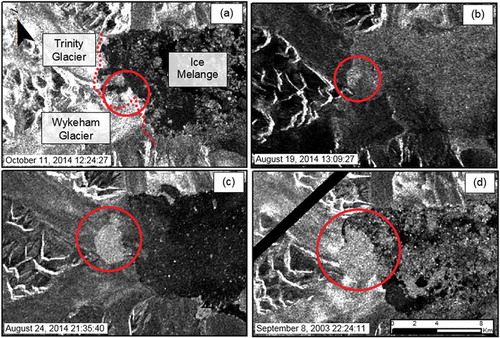
Based on the methodology of Herdes et al. (Citation2012), iceberg plume events were categorized into four size classifications: size 1 represents an iceberg plume event which is <1 km2 in extent, size 2 represents a plume event which is 1–10 km2, size 3 represents a plume that is 10–20 km2, and size 4 represents a plume event that is 20–30 km2 (). No events were detected with a plume size >30 km2.
Figure 2. Examples of iceberg plume classification for Radarsat-2 ScanSAR Wide beam mode imagery (100 m resolution): (a) size 1 (<1 km2); (b) size 2 (1–10 km2); (c) size 3 (10–20 km2); and (d) size 4 (20–30 km2). Dotted line shows the approximate terminus outline for Trinity and Wykeham glaciers. Data and Products © MacDONALD, DETTWILER AND ASSOCIATES LTD (2015) – All Rights Reserved. RADARSAT is an official mark of the Canadian Space Agency.
Where possible, glaciers in the study area were identified using their official name as provided by the Geographical Names Board of Canada (https://www.nrcan.gc.ca/earth-sciences/geography/place-names/search/9170). However, where an official name was not available, they were identified using names provided by Van Wychen et al. (Citation2014). Glaciers without an official name and not previously identified by Van Wychen et al. (Citation2014) were named according to their location and proximity to other known glaciers.
Glacier terminus changes
All of the tidewater glaciers in Talbot Inlet () had their frontal positions recorded for the years 2009 and 2015, with mean retreat rates calculated between these years. The positions were manually digitized from Landsat 7 and 8 imagery, and frontal changes were calculated using the “box method” (Moon and Joughin Citation2008; Lea, Mair, and Rea Citation2014; Cook et al. Citation2019). This method results in mean changes in glacier area (km2 a−1), and glacier length (m a−1) based on the width of the glacier at its terminus.
To provide a basic assessment of the proportion and relative importance of ice motion vs. terminus retreat in contributing to iceberg plume event production in greater detail, the annual positions of the termini of Trinity and Wykeham glaciers were recorded for each year between 1997–2015 (). Terminus outlines were digitized for each year, within a one-to-two-week period at the end of summer (approximately September), using predominantly Landsat 7 and 8 imagery. Radarsat-1 ScanSAR imagery was used for periods prior to 1999, when there was no Landsat imagery available.
Sea ice freeze-up and break-up patterns
The annual dates of sea ice freeze-up and break-up around the POW Icefield were determined from the Canadian Ice Service (CIS) archive. Historical weekly sea ice charts for the Eastern Canadian Arctic (https://www.ec.gc.ca/glaces-ice/default.asp?lang=Enandn=0A70E5EB-1) were used to identify the break-up date each summer as the period when the sea ice was no longer classified as “landfast ice.” These changes in stage of development were based on the CIS MANICE egg code classification system, using Form of Ice, Code 8 (CIS, Citation2005). Conversely, sea ice freeze-up was identified as the period when sea ice was first classified as “landfast ice” in the weekly CIS charts. These were verified against the satellite imagery used for the plume event analysis, particularly in smaller fiords, where there was little local detail in the sea ice charts. The same week of sea ice break-up and freeze-up was assigned to glaciers located in the same fiord or general region of POW Icefield (e.g., all glaciers located in Talbot Inlet).
Climatic, oceanic, and tidal analysis
National Centers for Environmental Prediction–National Center for Atmospheric Research (NCEP-NCAR) climate reanalysis data were used to extract seasonal mean surface air temperature for the CAA and, more specifically, the POW Icefield (https://www.esrl.noaa.gov/psd/data/gridded/data.ncep.reanalysis.html). Seasonal surface air temperature anomalies and mean seasonal data (June to September), based on the 1981–2010 climatology were used to create plots for each year from 1997 to 2015. There are no permanent weather stations at POW Icefield, so reanalysis data were used due to the lack of available observational data. NCEP-NCAR data has been verified by previous studies in the CAA, and when compared to observational data on Northern Ellesmere, Baffin, and Bylot Islands, no significant differences were found between the two products (Gardner et al. Citation2011, Citation2012; White and Copland Citation2018). As a result, these data were deemed suitable for use in this study, given the lack of other climate data for the entire time period (1997–2015).
The World Ocean Database (WOD13) was used for in-situ mean ocean temperature measurements (up to 100 km offshore) for the waters surrounding the POW Icefield (77–79°N) from 1972–2010 (Boyer et al. Citation2013; Cook et al. Citation2019). There are no data available for this region after 2010. Results were used to determine whether a relationship exists between variations in ocean temperature and the production of iceberg plume events from POW Icefield.
Data from the online WWW Tide/Current Predictor (http://tbone.biol.sc.edu/tide/tideshow.cgi) were used to predict historical tidal heights for the study region. The WWW Tide/Current Predictor has been calibrated against past tidal measurements made in 1962 at Pim Island, located ~1 km off the NE coast of POW Icefield, directly north of Leffert Glacier (78.0667° N, 74.0167° W). High resolution information concerning the timing of iceberg plume events is required to understand the potential influence of tidal height variations on a sub-daily basis, so analysis of the tidal data was restricted to 2011–2015 for Trinity and Wykeham glaciers, when the most complete satellite imagery was available ().
Uncertainty analysis
The spatial and temporal resolution of satellite imagery and the detectability of iceberg plume events in both optical and SAR scenes have created a level of uncertainty in the results of this study. For example, a comparison between hourly time-lapse camera photos and satellite imagery collected at the terminus of Trinity Glacier in 2016–2017 shows that some small iceberg plume events photographed at the glacier terminus were not always detected in satellite imagery. These data were collected by the primary author during fieldwork in 2017. This likely arises due to the relatively low resolution of ScanSAR Wide imagery, the potential delay between an iceberg plume event and the timing of a satellite image acquisition, and the fact that single small iceberg production events do not always produce an associated plume. However, large calving events are consistently identified in the satellite imagery as iceberg plumes.
It is also worth noting that the availability of satellite imagery decreases outside of the summer season and that the availability of imagery from year to year was inconsistent, with some years having significantly more images available than others. There is a positive correlation between the raw number of detected iceberg plume events and the number of available satellite scenes in a given year. The number of plume events identified in this study was therefore normalized based on the number of available satellite scenes for each year (). Results show that there was a decline in iceberg plume events produced between 1997 and 2008, followed by an increase from 2009–2015, when the number of satellite scenes was not taken into account (). With the availability of satellite scenes considered, there is an increase in iceberg plume events observed between 1997 and 2005, followed by a decrease from 2006–2015 ().
Figure 3. (a) Total yearly plume events produced by Trinity and Wykeham glaciers (dark grey) compared to plume events from all other major glaciers in the study (light grey). Figures above columns represent the proportion (%) of total iceberg plumes produced by Trinity and Wykeham glaciers. (b) Normalized yearly plume events (number of plume events per number of available satellite scenes) produced by all glaciers in the study.
Since the availability of data and methods used to detect iceberg plume events were the same for all glaciers in the study, the potential bias is consistent across POW Icefield. This study remains the first estimate of the total number of plume events produced from an entire ice cap in the CAA. However, the number of plume events identified in this study should be considered a minimum estimate of the total produced, since many plume events likely went undetected, due to their size and the availability of imagery.
Results
Of the 40 tidewater glaciers analyzed in this study, 25 produced at least one plume event between 1997 and 2015. The remaining 15 glaciers did not produce any detectable iceberg plume events during this period (; ). To provide a measure of the spatial distribution of plume activity, the glaciers with plume activity were classified into those having produced 1–10 events, 11–50 events, 51–100 events, and 101–150 events ().
Table 2. Total yearly detected plume events produced by all glaciers in the study between 1997 and 2015. The values show the total number of events per size category per glacier for each year (i.e. 0,0,0,0,= size 1 events, size 2 events, size 3 events, size 4 events).
Plume activity: 1–10 events
The majority of the glaciers in this study produced <10 iceberg plume events over the 18-year time period. Of the 25 glaciers identified as active producers of iceberg plume events, 16 of them only produced between 1 and 10 plume events between 1997 and 2015, at an average rate of <1 event per year (). For these 16 glaciers, ~35% of events occurred in the open water season (between approximately July and October), and some immediately prior to or following the start of the open water season, with ~65% occurring when sea ice was present (). Only size 1 and size 2 plume events were produced by these glaciers.
Table 3. Distribution of total plume events for all glaciers in the study from 1997–2015 based on sea ice conditions.
Plume activity: 11–50 events
Unnamed 1 South and Tanquary glaciers were the most active producers of iceberg plume events in this group (). Unnamed 1 South Glacier, on the north side of Talbot Inlet, produced most iceberg plume events between 2009 and 2015, the majority of which were size 1 in magnitude. Tanquary Glacier produced more plume events consistently over the time period, the majority of which were size 2. For Tanquary Glacier, 48.6% of plume events were produced during the open water season that occupied an average of 23.0% of the year. For Unnamed 1 South Glacier, 28.6% of the annual plume events occurred during the open water season ().
Plume activity: 51–100 events
Only South 2 and South 7 glaciers, located on the southern coast of Ellesmere Island, produced a total of 51–100 plume events between 1997 and 2015 (; ). Both glaciers were actively producing iceberg plume events between 1997 and 2003 (66 and 54 plume events, respectively), but no iceberg plume events were identified from either glacier in 2004. Plume events from these glaciers occurred more than twice as frequently during the open water season (between approximately July and October) compared to the rest of the year (). When South 2 and South 7 glaciers produced icebergs when sea ice was present (between approximately November and August), these events were restricted to smaller size 1 plume events compared to size 1, 2, and 3 plume events produced during the open water season.
Plume activity: 101–150 events
The satellite image analysis showed that four glaciers, all located on the eastern side of POW Icefield, produced a total of >100 plume events each over the study period. Cadogan and Ekblaw glaciers produced 105 and 102 plumes, respectively, between 1997 and 2015 (; ). Both of these glaciers produced icebergs consistently over this period, with Cadogan Glacier producing size 1, 2, and 3 plume events while Ekblaw Glacier primarily produced size 2 plume events ( and ). The largest plume events produced by Cadogan Glacier (size 3) coincided within ~1 week before or after the annual sea ice break up. Similar to the other active glaciers in the study, an average of 0.25 plume events per week were produced from both Cadogan and Ekblaw glaciers during the open water season that occupied 17.9% and 23.0% of the year, respectively (; ). Some events also occurred immediately prior to or following the open water season, with fewer events occurring when sea ice was present.
Table 4. Number of plume events per week for the four most active glaciers in the study based on sea ice conditions.
Figure 4. Temporal variability of iceberg plumes produced by (a) Trinity Glacier, (b) Wykeham Glacier, (c) Cadogan Glacier, and (d) Ekblaw Glacier between 1997 and 2015. Grey area represents the presence of landfast sea ice and white area represents absence of landfast sea ice.
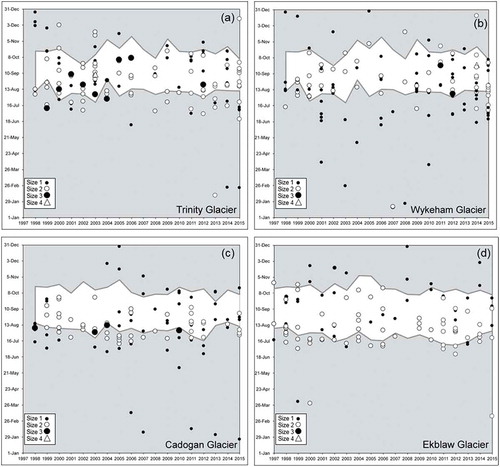
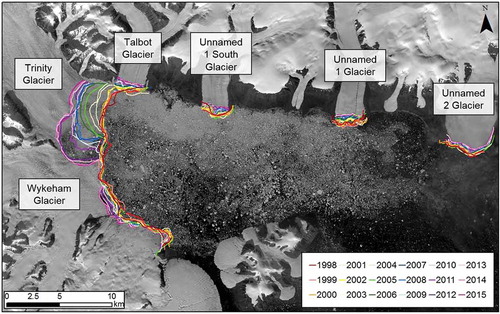
Figure 5. Terminus outlines 1998–2015 for Trinity, Wykeham, Talbot, Unnamed 1 South, Unnamed 1, and Unnamed 2 glaciers in Talbot Inlet. Base image: USGS/NASA Landsat August 29, 2014.
Trinity and Wykeham glaciers were the most active iceberg plume event producing glaciers on POW with 139 and 134 plumes detected, respectively ( and ; ). For Trinity and Wykeham glaciers, an average of 0.41 and 0.39 plumes events per week were produced during the open water season or immediately before or after it (; ). Most of the plume events produced by Trinity and Wykeham glaciers were size 1 or size 2 in magnitude ( and ; ). Trinity Glacier produced 11 size 3 plume events, a greater number than any other glacier in the study; these events occurred at least once per year between 1999 and 2006. Sea ice did not break out of Talbot Inlet in 1997, and no iceberg plume events were detected from either Trinity or Wykeham glaciers that year. About the same number of plume events are produced from Trinity and Wykeham glaciers during the ~2–3 month open water season as occurs during the rest of the year combined ().
Discussion
From the results, it is clear that there are marked variations in the number and size of iceberg plume events produced by the tidewater glaciers around POW Icefield, over both space and time. We determined that Trinity and Wykeham glaciers provide the primary source of icebergs from the POW Icefield (; and ), so these glaciers form a focus of the following discussion, although the patterns at other glaciers are also referenced where relevant. When assessing the causes and patterns of the observed iceberg plume events, the following two separate (but inter-related) questions need to be addressed:
Spatial analysis: Why are some glaciers more productive than others?
Temporal analysis: For a particular glacier, what controls the timing of iceberg production, both seasonally, and over the past 18 years?
These are addressed in the following sections.
Causes of spatial variability in iceberg plume events
To understand spatial controls on iceberg plume event production rates, comparisons can be made with glacier velocities and ice discharges for 2011–2015 reported by Van Wychen et al. (Citation2016), and the terminus retreat rates between 2009 and 2015 reported by Cook et al. (Citation2019) (). In total, 12 glaciers have both ice flux and terminus retreat data available. Because the amount of ice released by a plume event varies non-linearly based on its size (e.g., a size 3 plume event contains much more than 3 times the volume of a size 1 plume event), the number of plume events per glacier were weighted based on the scale y = x2 (i.e., size 1 = weight 1, size 2 = weight 4, size 3 = weight 9, and size 4 = weight 16). Although specific ice volumes per plume event cannot be determined since the thickness of calved ice is unknown, this approximately follows the power-law iceberg size distribution reported at glacier calving fronts (Åstrom et al. Citation2014). Based on these analyses, on a regional basis, the glaciers in this study can be divided into three broad categories:
Table 5. Comparison between plume events from 2011–2015, average ice flux from 2011–2015 (Van Wychen et al. Citation2016) and change in glacier length from 2009–2015 (Cook et al. Citation2019). Weighted Total and Type refers to categories and scale described in Section 5.1. Data is only shown for glaciers where ice flux and change in glacier area data was available.
Type I: Few iceberg plume events with low ice flux and average terminus retreat. Seven of the 12 glaciers fell into this category, with the production of generally small iceberg plume events (sizes 1 and 2) and relatively low surface velocities of ~50–150 m a−1 (Van Wychen et al. Citation2016). These low velocities are reflected in their relatively low ice fluxes (average <0.03 Gt a−1), with all of these glaciers together making up less than 8% of total POW Icefield ice flux over the period 2011–2015 (). All of these glaciers underwent a terminus retreat between 2009 and 2015, with an average retreat rate of 32.7 m a−1 that is similar to the QEI regional average of 29.1 m a−1 over this period (Cook et al. Citation2019). The glaciers that produced a higher number of iceberg plume events typically underwent the most retreat. Taken together, this indicates that the iceberg plume events for these glaciers may be controlled largely by their terminus retreat patterns.
Type II: Many iceberg plume events with moderate ice flux and above average terminus retreat. Three glaciers in the study were found to fit these characteristics: Cadogan, Ekblaw, and South 2. Ekblaw Glacier was identified as a pulse type glacier by Van Wychen et al. (Citation2016), meaning that it underwent marked velocity variations along the lower 10 km of its length between 1999 and 2015, including a deceleration between 2006 and 2015, from ~250 m a−1 to ~50 m a−1. No detectable change in velocity was observed for South 2 or Cadogan glaciers (Van Wychen et al. Citation2016). The average ice flux from 2011–2015 for these glaciers was moderate and ranged between 0.018 and 0.092 Gt a−1 (). These glaciers underwent retreat rates 150% to 400% greater than the QEI regional average of 29.1 m a−1 (Cook et al. Citation2019). These patterns indicate that terminus retreat may be an important component of ice discharge from these glaciers, rather than steady state ice flux through the terminus gate.
Type III: Numerous iceberg plume events with high ice flux and rapid terminus retreat. Trinity and Wykeham glaciers differed from all other glaciers around POW Icefield due to their high production of iceberg plume events, acceleration in their velocities, and rapid terminus retreat (Van Wychen et al. Citation2016). For Wykeham Glacier, velocities increased consistently from ~250 m a−1 in 1999–2000 to ~450 m a−1 in 2015. Trinity Glacier is currently the fastest flowing glacier in the Canadian Arctic, after increasing in velocity from ~300–550 m a−1 in 1999–2002 to ~1 km a−1 in 2015 (Van Wychen et al. Citation2016). These high velocities are consistent with the high average total combined ice flux from Trinity and Wykeham glaciers which are responsible for ~80% of total ice discharge from the POW Icefield (Mair, Burgess, and Sharp Citation2009; Van Wychen et al. Citation2016). The terminus of Trinity Glacier retreated by an average of 99 m a−1, and Wykeham Glacier by 109 m a−1, over this period (Cook et al. Citation2019). When compared to the timing of plume events found by this study, there is no clear correlation between years with significant retreat (e.g., in 2011–2012) and an increase in plume events, or vice versa in years with limited terminus retreat. However, these findings are consistent with the velocity variations found by Van Wychen et al. (Citation2016), indicating that plume events from these glaciers may be primarily driven by ice moving through the terminus, as opposed to terminus retreat.
Causes of temporal variability in iceberg plume events
After categorizing the glaciers based on their spatial variability, it is clear that there are still unexplained temporal variations in their production of iceberg plume events. To investigate whether iceberg discharge rates are changing in response to external forcing, it is useful to review the influence of seasonal changes in sea ice patterns, glacier dynamics or external forcing, such as oceanic and atmospheric heat variations.
Sea ice patterns
Previous studies have suggested that there is a strong relationship between the presence of sea ice at the terminus of a glacier and the stability of the calving front (Reeh et al. Citation2001; Herdes et al. Citation2012; Pope, Copland, and Mueller Citation2012; Carr, Vieli, and Stokes Citation2013; Carr, Stokes, and Vieli Citation2014; Moon, Joughin, and Smith Citation2015). The plume event analysis from 1997 to 2015 indicates that this relationship also exists at the termini of tidewater glaciers around POW Icefield, with plume events occurring predominantly during the open water season, immediately prior to the breakup of landfast ice or immediately following the formation of landfast ice (). Nearly 50% of all plume events occurred during the open water season, which on average lasts for only 21% (78 days) of the year for the glaciers in this study. The larger size 3 and 4 plume events occurred almost exclusively during the open water season, whereas most plume events produced when sea ice was present were size 1 or 2.
Between 1997 and 2015, Trinity Glacier produced 61 iceberg plume events during the ~2–3 month open water season compared to 78 events when landfast sea ice was present during the remaining ~9–10 months of the year (). Similar values were seen for Wykeham Glacier, with 75 plume events produced during the open water season, and 59 when sea ice was present (). A major exception was for 1997, when landfast sea ice did not break out in front of the glaciers in Talbot Inlet or those immediately surrounding Cadogan Glacier. No iceberg plume events were detected from any of the glaciers during this year. In this study, it was found that landfast sea ice typically broke apart at each glacier every year, with break-up dates usually occurring between July and August and freeze-up dates between October and November (). One exception to the typical freeze-up dates was for Leffert and Alfred Newton glaciers (located on the NE POW Icefield), which displayed a pattern of sea ice break-up date becoming progressively earlier between 1997 and 2014, while the freeze-up date remained relatively constant.
The findings of this study that plume events occurred ~2–3 times more frequently when open water was present, rather than landfast sea ice, is consistent with the results of Herdes et al. (Citation2012) for the CAA, and studies in Greenland (; ; Reeh et al. Citation2001; Carr, Stokes, and Vieli Citation2014; Moon, Joughin, and Smith Citation2015). Pimentel et al. (Citation2017) modeled the effects of sea ice on backstress at the terminus of Belcher Glacier, and found that backstress decreases as the sea ice weakens in the early melt season. This could be responsible for the steady increases in glacier velocity recorded across the terminus at this time, which would help to explain the enhanced calving. However, since plume events also occurred while landfast sea ice was present for Belcher and POW Icefield glaciers, it is likely that other contributing factors are also important such as ocean temperature, timing of tides, and air temperature.
Oceanic conditions
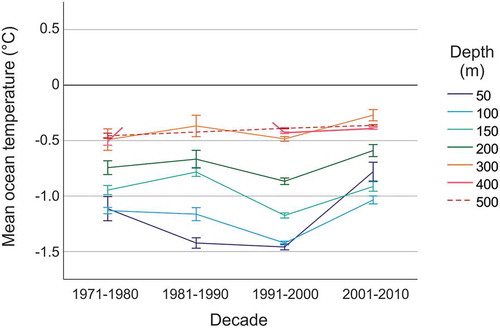
Measurements of mean ocean temperature from the WOD13 showed that water temperatures at all depths did not rise above 0°C within 100 km of the POW Icefield between 1970 and 2010 (; Boyer et al. Citation2013; Cook et al. Citation2019). It therefore seems likely that oceanic changes did not cause significant melting of the calving front from below and changes in iceberg productivity over this period. However, due to the lack of long-term ocean temperature measurements taken near the termini of individual glaciers, more research is needed to verify the validity of this conclusion.
Figure 6. Temporal trends from World Ocean Database (WOD13) data (up to 100 km offshore). Mean oceanic temperatures from 1972–2010 for 77–79°N (POW Icefield) for 50–500m depths. Error bars are ±1 SE.
Modeled tidal data from WWW Tide/Current Predictor from 2011–2015 shows no clear relationship between the timing of spring and neap tides and the production of icebergs from Trinity and Wykeham glaciers. Iceberg plume events were observed during both spring and neap tidal periods, as well as periods in between, with no clear consistency. The low availability of smaller temporal and spatial scale observational data for this region could account for the lack of relationship detected between tidal cycles and glacier plume events and should be investigated further if possible.
Atmospheric conditions
The NCEP-NCAR reanalysis shows a general increase in mean monthly temperatures during the open water season from 1997 to 2015 at a rate of approximately 0.8°C decade−1, although with low statistical significance (). These findings indicate that summer air temperatures in the POW Icefield region have generally warmed over the study period, with the exception of a few anomalously cold years such as 2013. A decrease in mean seasonal surface air temperature from −1.06°C in 2012 to −3.16°C in 2013 coincides with a drop in total POW Icefield plume events from 60 events in 2012 to 34 in 2013.
Figure 7. Mean monthly air temperatures for POW Icefield from July to October for 1997–2015 produced from NCEP-NCAR Reanalysis data (1981–2010 climatology). Source: Kalnay et al. (Citation1996).
To characterize the magnitude and timing of plume events that occurred for the four most active glaciers in the study (Trinity, Wykeham, Ekblaw, and Cadogan glaciers) during the open water and sea ice seasons, the total number of plume events were normalized based on number of available satellite scenes and compared to the average monthly temperatures for the open water season. Results showed that while more plume events occurred during the open water season (July to October) than when sea ice was present (November to June), the correlation was not found to be statistically significant. There was no correlation found between the number of plume events produced and the number of satellite scenes when sea ice was present. Atmospheric temperatures have a direct control on sea ice duration, making it difficult to disentangle the relative importance of each one in controlling iceberg production rates.
Conclusions
This study presents the first comprehensive assessment of iceberg production from glaciers around POW Icefield, including the identification of timing and magnitude of individual plume events in relation to local sea ice, tidal, oceanographic, and atmospheric conditions. The study used a total of 8,426 SAR and optical satellite images from 1997 to 2015 to identify iceberg plume events for 40 tidewater glaciers with a terminus width of >1 km, of which 25 glaciers were found to be active iceberg producers.
On a regional basis, it appears that both long-term spatial and temporal variability in glacier velocity (i.e., ice discharge), as well as terminus retreat rates, provide the primary controls on the frequency and magnitude of plume events. Glaciers in this study were found to fall into three main types based on their iceberg plume event production, average ice flux, and terminus retreat. Most glaciers were classified as Type I, characterized by the production of few iceberg plume events, low ice flux, and average terminus retreat. Three glaciers, Cadogan, Ekblaw, and South 2, fell into the Type II category, which is characterized by the production of many iceberg plume events, moderate ice flux, and above average terminus retreat. Only two glaciers, Trinity and Wykeham, were classified as Type III, which are characterized by numerous iceberg plume events, high ice flux, and rapid terminus retreat. These glaciers were identified by Van Wychen et al. (Citation2016) to be the only two glaciers in the CAA to have consistently accelerated since ~2000. As a result, plume events from these glaciers may be attributed to ice moving through the terminus as opposed to terminus retreat, though this should be investigated further.
Another significant finding from this study is that the presence of landfast sea ice at the terminus of tidewater glaciers is a primary controlling factor on the annual timing of iceberg calving for all glaciers. These results are consistent with the findings of others in Greenland and the Canadian Arctic (Reeh et al. Citation2001; Pope, Copland, and Mueller Citation2012; Carr, Vieli, and Stokes Citation2013) and most relevant to the findings of Herdes et al. (Citation2012) who conducted a similar study on two glaciers on Devon Ice Cap. Findings also show that mid-winter plume events still occur when sea ice is present, but these events are less common and generally smaller in size than the summer events. There was no clear relationship identified between tidal cycles or ocean temperatures and the production of iceberg plume events from POW Icefield glaciers. Summer air temperatures in the POW Icefield region have generally increased between 1999 and 2015, with a weak positive correlation to the number of iceberg plume events, although this may be as much an effect related to changes in sea ice conditions than direct surface melting. In the future, locally measured observational data and more regular and higher resolution SAR imagery would enable better determination of whether there is a clear relationship between the timing of plume events from individual glaciers and variations in tides and oceanic and surface air temperatures.
These findings hold importance for the impacts of climate change in the region. Past studies have shown that sea ice extent and thickness are declining in all regions of the Canadian Arctic, and that the open water season is lengthening. This suggests that in the future there will be less sea ice present at the terminus of CAA glaciers to act as a barrier between the open ocean and the calving front, which could lead to an increase in icebergs being discharged into Canadian waters. Increased presence of icebergs in Canadian waters can pose a threat for shipping lanes and offshore oil exploration projects, in addition to contributing to sea level rise if they result in more ice being discharged from the land.
Acknowledgments
Support for this research has been provided by the University of Ottawa, the Canadian Ice Service (CIS), Natural Resources Canada (Program of Energy Research and Development), ArcticNet, the Northern Scientific Training Program, the Canadian Space Agency (Radarsat Constellation Mission Data Utilization and Application Plan), MEOPAR, NSERC, Canada Foundation for Innovation, Ontario Research Fund, Polar Continental Shelf Program and Transport Canada. Support for travel to conferences and attendance of courses was generously provided by the ArcticNet Training Fund, GlacioEx, and the SIU High North Fellowship. We thank the communities of Grise Fiord and Resolute Bay for permission to undertake fieldwork in our study region.
Disclosure statement
No potential conflict of interest was reported by the authors.
References
- Amundson, J. M., M. Fahnestock, M. Truffer, J. Brown, M. P. Lüthi, and R. J. Motyka. 2010. Ice mélange dynamics and implications for terminus stability, Jakobshavn Isbræ, Greenland. Journal of Geophysical Research 115 (F1):1–12. doi:10.1029/2009JF001405.
- Åstrom, J. A., D. Vallot, M. Schäfer, E. Z. Welty, T. C. O’Neel, Y. L. Bartholomaus, T. I. Riikilä, T. Zwinger, J. Timonen, and J. C. Moore. 2014. Termini of calving glaciers as self-organized critical systems. Nature Geoscience 7:874–78. doi:10.1038/NGEO2290.
- Boyer, T. P., J. I. Antonov, O. K. Baranova, C. Coleman, H. E. Garcia, A. Grodsky, D. R. Johnson, R. A. Locarnini, A. V. Mishonov, T. D. O’Brien, et al. 2013. World ocean database 2013. NOAA Atlas NESDIS 72, S. Levitus, Ed., A. Mishonov, Technical Ed, 209. Silver Spring, MD. doi:10.7289/V5NZ85MT.
- Canadian Ice Service (CIS). 2005. MANICE. Online. https://www.canada.ca/en/environment-climate-change/services/weather-manuals-documentation/manice-manual-of-ice.html.
- Carr, R., C. Stokes, and A. Vieli. 2014. Recent retreat of major outlet glaciers on Novaya Zemlya, Russian Arctic, influenced by fjord geometry and sea-ice conditions. Journal of Glaciology 60:155–70. doi:10.3189/2014JoG13J122.
- Carr, R. J., A. Vieli, and C. Stokes. 2013. Influence of sea ice decline, atmospheric warming, and glacier width on marine-terminating outlet glacier behavior in northwest Greenland at seasonal to interannual timescales. Journal of Geophysical Research: Earth Surface 118:1–17. doi:10.1002/jgrf.20088.
- Christoffersen, P., M. O'Leary, J. Van Angelen, and M. van den Broeke. 2012. Partitioning effects from ocean and atmosphere on the calving stability of Kangerdlugssuaq Glacier, East Greenland. Annals of Glaciology 53 (60):249–56. doi:10.3189/2012AoG60A087.
- Cohen, J., J. A. Screen, J. C. Furtado, M. Barlow, D. Whittleston, D. Coumou, J. Francis, K. Dethloff, D. Entekhabi, J. Overland, et al. 2014. Recent arctic amplification and extreme mid-latitude weather. Nature Geoscience 7:627–37. doi:10.1038/ngeo2234.
- Cook, A. J., L. Copland, B. P. Y. Noel, C. R. Stokes, M. J. Bentley, M. J. Sharp, R. G. Bingham, and M. J. van den Broeke. 2019. Atmospheric forcing of rapid marine-terminating glacier retreat in the Canadian Arctic Archipelago. Science Advances 5 (3):eaau8507. doi:10.1126/sciadv.aau8507.
- Dowdeswell J. A., and M. O. Jeffries. 2017. Arctic ice shelves: An introduction. In Arctic ice shelves and ice islands, ed. L. Copland and D. Mueller. Dordrecht: Springer Polar Sciences.
- Gardner, A., G. Moholdt, A. Arendt, and B. Wouters. 2012. Accelerated contributions of Canada’s Baffin and Bylot Island glaciers to sea level rise over the past half century. The Cryosphere 6:1103–25. doi:10.5194/tc-6-1103-2012.
- Gardner, A. S., M. Moholdt, B. Wouters, G. J. Wolken, D. O. Burgess, M. Sharp, J. G. Cogley, C. Braun, and C. Labine. 2011. Sharply increased mass loss from glaciers and ice caps in the Canadian Arctic Archipelago. Nature 473 (7347):357–60. doi:10.1038/nature10089.
- Harig, C., and F. J. Simons. 2016. Ice mass loss in Greenland, the Gulf of Alaska, and the Canadian Archipelago: Seasonal cycles and decadal trends. Geophysical Research Letters 43 (7):3150–59. doi:10.1002/2016GL067759.
- Herdes, E., L. Copland, B. Danielson, and M. Sharp. 2012. Relationships between iceberg plumes and sea-ice conditions on northeast Devon Ice Cap, Nunavut, Canada. Annals of Glaciology 53 (60):1–9. doi:10.3189/2012AoG60A163.
- Higgins, A. K. 1991. North Greenland glacier velocities and calf ice production. Polarforschung 60 (1):1–23.
- Howat, I. M., J. E. Box, Y. Ahn, A. Herrington, and E. M. McFadden. 2010. Seasonal variability in the dynamics of marine-terminating outlet glaciers in Greenland. Journal of Glaciology 56 (198):601–13. doi:10.3189/002214310793146232.
- Kalnay, E., M. Kanamitsu, R. Kistler, W. Collins, D. Deaven, L. Gandin, M. Iredell, S. Saha, G. White, J. Woollen, et al. 1996. The NCEP/NCAR 40-year reanalysis project. Bulletin of the American Meteorological Society 77:437–71. doi:10.1175/1520-0477(1996)077<0437:TNYRP>2.0.CO;2.
- Lea, J. M., D. W. F. Mair, and B. R. Rea. 2014. Instruments and methods evaluation of existing and new methods of tracking glacier terminus change. Journal of Glaciology 60 (220):323–32. doi:10.3189/2014JoG13J061.
- Mair, D., D. O. Burgess, and M. J. Sharp. 2009. Mass balance of the Prince of Wales Icefield, Ellesmere Island, Nunavut, Canada. Journal of Geophysical Research 114:F02011. doi:10.1029/2008JF001082.
- Millan, R., J. Mouginot, and E. Rignot. 2017. Mass budget of the glaciers and ice caps of the Queen Elizabeth Islands, Canada, from 1991 to 2015. Environmental Research Letters 12:024016. doi:10.1088/1748-9326/aa5b04/.
- Moon, T., and I. Joughin. 2008. Changes in ice front position on Greenland’s outlet glaciers from 1992 to 2007. Journal of Geophysical Research 113 (F2):F02022. doi:10.1029/2007JF000927.
- Moon, T., I. Joughin, and B. Smith. 2015. Seasonal to multiyear variability of glacier surface velocity, terminus position, and sea ice/ice mélange in northwest Greenland. Journal of Geophysical Research: Earth Surface 120:818–33. doi:10.1002/2015JF003494.
- O'Leary, M., and P. Christoffersen. 2013. Calving on tidewater glaciers amplified by submarine frontal melting. The Cryosphere 7:119–28. doi:10.5194/tc-7-119-2013.
- Pimentel, S., G. E. Flowers, M. J. Sharp, B. Danielson, L. Copland, W. Van Wychen, A. Duncan, and J. Kavanaugh. 2017. Modelling intra-annual dynamics of a major marine-terminating Arctic glacier. Annals of Glaciology 58:118–30. doi:10.1017/aog.2017.23.
- Pope, S., L. Copland, and D. Mueller. 2012. Loss of multiyear landfast sea ice from Yelverton Bay, Ellesmere Island, Nunavut, Canada. Arctic, Antarctic, and Alpine Research 44 (2):210–21. doi:10.1657/1938-4246-44.2.210.
- Reeh, N., H. Højmark, A. K. Higgins, and A. Weidick. 2001. Sea ice and the stability of north and northeast Greenland floating glaciers. Annals of Glaciology 33:474–80. doi:10.3189/172756401781818554.
- Screen, J., and I. Simmonds. 2010. The central role of diminishing sea ice in the recent Arctic temperature amplification. Nature 464:1334–37. doi:10.1038/nature08940.
- Serreze, M. C., and R. G. Barry. 2011. Processes and impacts of Arctic amplification: A research synthesis. Global and Planetary Change 77:85–96. doi:10.1016/j.gloplacha.2011.03.004.
- Sharp, M., D. O. Burgess, F. Cawkwell, L. Copland, J. A. Davis, E. K. Dowdeswell, J. A. Dowdeswell, A. S. Gardner, D. Mair, L. Wang, et al. 2014. Remote sensing of recent glacier changes in the Canadian Arctic. In Global land ice measurements from space, Ch. 9, ed. J. S. Kargel, G. J. Leonard, M. P. Bishop, A. Kääb, and B. H. Raup, 205–28. Berlin, Heidelberg: Springer Praxis Books. doi:10.1007/978-3-540-79818-7_9.
- Snow, Water, Ice and Permafrost in the Arctic (SWIPA). 2017. Arctic Monitoring and Assessment Programme (AMAP). Oslo, Norway.
- Stroeve, J., M. Serreze, S. Drobot, S. Gearheard, M. Holland, J. Maslanik, W. Meier, and T. Scambos. 2008. Arctic Sea ice extent plummets in 2007. Eos, Transactions American Geophysical Union 89 (2):13–14. doi:10.1029/2008EO020001.
- Stroeve, J. C., T. Markus, L. Boisvert, J. Miller, and A. Barrett. 2014. Changes in Arctic melt season and implications for sea ice loss. Geophysical Research Letters 41:1216–25. doi:10.1002/2013GL058951.
- Van Wychen, W., D. O. Burgess, L. Gray, L. Copland, M. Sharp, J. Dowdeswell, and T. Benham. 2014. Glacier velocities and dynamic ice discharge from the Queen Elizabeth Islands, Nunavut, Canada. Geophysical Research Letters 41 (2):484–90. doi:10.1002/2013GL058558.
- Van Wychen, W., J. Davis, D. O. Burgess, L. Copland, L. Gray, M. Sharp, and C. Mortimer. 2016. Characterizing interannual variability of glacier dynamics and dynamic discharge (1999–2015) for the ice masses of Ellesmere and Axel Heiberg Islands, Nunavut, Canada. Journal of Geophysical Research: Earth Surface 121:39–63. doi:10.1002/2015JF003708.
- Van Wychen, W., J. Davis, L. Copland, D. O. Burgess, L. Gray, M. Sharp, J. Dowdeswell, and T. Benham. 2017. Variability in ice motion and dynamic discharge from Devon Ice Cap, Nunavut, Canada. Journal of Glaciology 63 (239):436–49. doi:10.1017/jog/2017.2.
- Van Wychen, W., L. Copland, D. Burgess, L. Gray, and N. Schaffer. 2015. Glacier velocities and dynamic discharge from the ice masses of Baffin Island and Bylot Island, Nunavut, Canada. Canadian Journal of Earth Sciences 52 (11):980–89. doi:10.1139/cjes-2015-0087.
- Vieli, A., and F. M. Nick. 2011. Understanding and modelling rapid dynamic changes of tidewater outlet glaciers: Issues and implications. Surveys in Geophysics 32 (4–5):437–58. doi:10.1007/s10712-011-9132-4.
- White, A., and L. Copland. 2018. Area changes of glaciers across Northern Ellesmere Island, Nunavut, between ~1999 and ~2015. Journal of Glaciology 64 (246):609–23. doi:10.1017/jog.2018.49.
- White, A., and L. Copland. 2019. Loss of floating glacier tongues from the Yelverton Bay region, Ellesmere Island, Canada. Journal of Glaciology 65 (251):376–94. doi:10.1017/jog.2019.15.
- Williamson, S., M. Sharp, J. Dowdeswell, and T. Benham. 2008. Iceberg calving rates from northern Ellesmere Island ice caps, Canadian Arctic, 1999–2003. Journal of Glaciology 54 (186):391–400. doi:10.3189/002214308785837048.