
 ?Mathematical formulae have been encoded as MathML and are displayed in this HTML version using MathJax in order to improve their display. Uncheck the box to turn MathJax off. This feature requires Javascript. Click on a formula to zoom.
ABSTRACT
Throughout the world, tropical glaciers are rapidly receding and some are at risk of complete loss within the next several decades. It is therefore important to monitor these glacial regions to better understand the factors affecting glacier loss and risks to nearby communities. Here, we provide an update on the summit glacier extents of Pico de Orizaba (19.03°N, 97.27°W) and Iztaccíhuatl (19.18°N, 98.64°W) in central Mexico, reporting areas every 1–11 years between 2001 and 2019 (depending on the availability of high-quality imagery). Glacier extents are derived from multispectral satellite imagery (Landsat 7–8 and the European Space Agency’s Sentinel-2) using a semi-automated mapping method that takes the ratio of the near-infrared (or panchromatic) and shortwave infrared bands and applies appropriate threshold(s) for glacier identification. We also use thermal band imagery from Landsat 7–8 to estimate surface temperatures of both the glaciers and the surrounding terrain to provide a more comprehensive understanding of the summit environment. We find that glacier retreat has continued on both summits, and surface temperatures (even over glacier ice) can be at or near the melting point of water during some parts of the year, particularly on lower-elevation Iztaccíhuatl, suggesting a risk of continued ice loss in the future.
Introduction
Glaciers can be found even in the Tropics (±20° latitude) at sufficiently high elevations. These represent significant sources of water for nearby communities but can also pose potential hazards. Equatorial glaciers have been a focus of studies characterizing glacial loss (Paul et al. Citation2004) and hazard analyses (Kääb et al. Citation2005), where events such as glacier outbursts, enhanced runoff, slope instability, mass movement, and interactions between ice and volcanic activity (e.g., lahars) may threaten downslope populations. Low-latitude glacial extents are restricted to the highest mountain regimes of Asia (Indonesia), Africa (e.g., Mt. Kilimanjaro in Tanzania), South America (including Ecuador, Peru, and Colombia), and North America (Mexico). Worldwide, alpine glaciers are particularly susceptible to temperature changes associated with climate change, because they are above the treeline and are subject to unobstructed influxes of solar radiation and positive feedbacks associated with their high albedos (Haeberli and Beniston Citation1998). In the case of tropical glaciers, changes in both air humidity and temperature (not just temperature alone) are thought to be drivers of glacier recession (Kaser Citation1999). In both mid- and low-latitude alpine regions, retreat has been observed in recent decades (e.g., Francou et al. Citation2005; Cullen et al. Citation2006; Soruco et al. Citation2009; Thompson et al. Citation2009, Citation2011), and it is possible that some of these glaciers will be lost completely within the next several decades (Zemp et al. Citation2006).
Here, we focus on two glacierized summits in south-central Mexico’s Cordillera Neovolcánica: Pico de Orizaba and Iztaccíhuatl (). The Cordillera Neovolcánica spans the southern edge of the North American plate and contains the highest peaks in Mexico, all dormant or active stratovolcanoes. The glaciers in this region are unique because they are the only permanent ice masses found near the 20°N latitude band. Although not strictly characterized as tropical glaciers because they lie outside of the oscillation range of the Intertropical Convergence Zone, Mexico’s glaciers are located within the latitudinal bounds of the Tropics and meet the thermal criteria for the Tropics (within the range where diurnal temperature variations exceed annual temperature variations; Kaser and Osmaston Citation2002). Due to the circulation of arid westerly winds during northern winter/spring and the northeasterly trade winds that bring in moist air during northern summer/fall, these glaciers do have seasonal patterns similar to those in some parts of the Tropics, with distinct humid and dry seasons (Kaser and Osmaston Citation2002). It is therefore plausible that these seasonal variations in atmospheric humidity, in addition to temperature, may play a role in driving the processes affecting these glaciers today. Some work has indicated that the glaciers in Mexico may not last beyond 2050 (Delgado-Granados et al. Citation2007), making this a critical region for monitoring glacier losses in real time; many other mountain regions are suffering from similar glacier retreat (e.g., Paul et al. Citation2004). Previous mapping efforts in these regions used aerial photography, fieldwork, orbital remote sensing, or a combination of these. The most recent updates are largely performed with orbital multispectral imagery using band ratio calculations that are shown to provide a rapid, robust means of identifying glacier boundaries (e.g., Schneider et al. Citation2008; Cortés-Ramos and Delgado-Granados Citation2012).
Figure 1. Map of the locations of the two glacierized summits in central Mexico: Pico de Orizaba (top right) and Iztaccíhuatl (lower left).
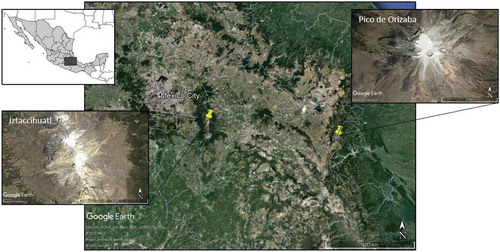
Pico de Orizaba (19.03°N, 97.27°W), at 5,636 m, is the highest point in Mexico and contains the country’s largest glacier. It is also notable for having one of the highest treelines in the world (Cruz-Kuri, McKay, and Navarro-González Citation2001). Previous mapping of the glaciers on Pico de Orizaba reported a total areal extent of 9.5 km2 in 1958 (Lorenzo Citation1964; White Citation1978); however, cartographic inconsistencies noted by Cortés-Ramos and Delgado-Granados (Citation2015) indicated that the mid-twentieth-century areal estimates were, in fact, significantly overestimated. By correcting these errors via rescaling of the glacier outlines to align with the INEGI (Citation2002) topographic map, an updated estimate of the 1958 glacier coverage was found to be 2.24 km2 (Cortés-Ramos and Delgado-Granados Citation2015). In addition, Cortés-Ramos and Delgado-Granados (Citation2015) constructed an outline of the glacier extent in 1975 based on aerial photography and found that the summit glaciers had lost approximately 24 percent of its area between 1958 and 1975. Historically, there were seven outlet glaciers extending from the Gran Glaciar Norte ice cap, along with Glaciar Oriental, a detached mountain glacier extending east from the summit (Lorenzo Citation1964; White Citation1978). The Chichimeco glacier tongue, which extended north from the ice cap, lost significant area between 1959 and 1975 (Cortés-Ramos and Delgado-Granados Citation2015) and was completely gone by 1988 (Palacios and Vázquez-Selem Citation1996). Extending northwest from Glaciar Norte was Glaciar de Jamapa (Lorenzo Citation1964; White Citation1978), which similarly experienced fairly significant losses by 1975 (Cortés-Ramos and Delgado-Granados Citation2015) and was no longer attached to the larger ice cap by the mid-1990s, limited in extent to two patches of ice downslope from the rest of the glacier (Palacios and Vázquez-Selem Citation1996). Several additional glacial tongues extended west and southwest from Glaciar Norte (Glaciar Occidental and Suroccidental, respectively) and experienced substantial losses between 1959 and 1996 (Palacios and Vázquez-Selem Citation1996). In 2001, the area of Glaciar Occidental was ~0.0895 km2, but by 2007 it has lost 74 percent of its area (Cortés-Ramos and Delgado-Granados Citation2012). Due to this retreat, most of the ice mass that remained on Pico de Orizaba by 1996 was limited to the ice cap, extending to a minimum elevation of 5,037 m (Palacios and Vázquez-Selem Citation1996). In 2001, the area of the Glaciar Norte ice cap was 0.93 km2, which shrank by approximately one third between 2001 and 2007 (Cortés-Ramos and Delgado-Granados Citation2013). Glaciar Oriental, which had a minimum altitude of 5,070 m and an area of roughly 0.118 km2 in 1958 (Lorenzo Citation1964; Palacios and Vázquez-Selem Citation1996; Cortés-Ramos and Delgado-Granados Citation2015), had remained more constant in size, with little apparent area loss between 1958 and 1988 (Palacios and Vázquez-Selem Citation1996). In 1996, Glaciar Oriental had a minimum altitude of 5,100 m (Palacios and Vázquez-Selem Citation1996). Between 2002 and 2007, only approximately 13 percent of its glacial area was lost (Cortés-Ramos and Delgado-Granados Citation2012).
The summit of Iztaccíhuatl (19.18°N, 98.64°W) once had a large glacial area, covering an area of ~6.4 km2 at the peak of the Little Ice Age (around 1850) based on mapping of the associated moraines (Schneider et al. [Citation2008], using the geologic maps of Nixon [Citation1989]; INEGI Citation1995). The earliest detailed map of glacier extent at Iztaccíhuatl combined aerial photographs from 1945 with fieldwork likely conducted in 1958 to obtain glacier coverage of 1.21 km2 across twelve named glaciers and two firn fields (Lorenzo Citation1964; White Citation1978). These glaciers spanned several subpeaks of Iztaccíhuatl; from northwest to southeast, relevant subpeaks are named La Cabeza, El Pecho, and La Panza. Several smaller ice masses were present in 1959 (Lorenzo Citation1964; White Citation1978): Glaciar de la Cabeza, a thin, 200-m-long ice mass on the northwest side of the La Cabeza summit (1959 area = 0.0144 km2); the Nororiental firn field southeast of the El Pecho summit (1959 area = 0.025 km2); Glaciar de San Augustin (1959 area = 0.0113 km2), southeast of La Panza; and Atzintli (1959 area = 0.0575 km2), which prior to 1918 was connected to Glaciar de Ayoloco, part of the La Panza glacier system (White Citation1978). However, many of these smaller masses have disappeared completely since the observations of Lorenzo (Citation1964). The San Augustin glacier was lost by 1982, the glaciers on and around the La Cabeza summit were gone by 1994, and the Atzintli glacier had receded completely by 2004 (Schneider et al. Citation2008). Over time, retreat has occurred such that only two glacierized regions remain, concentrated at the El Pecho and La Panza subpeaks. The total glacier area at the Iztaccíhuatl summit in 2007 was 0.273 km2 (Schneider et al. Citation2008), where El Pecho and La Panza had glacial extents of 0.14 and 0.133 km2, respectively. This reflects a loss of about 80 percent of the glacier area between the 1959 maps of Lorenzo (Citation1964) and 2007. Additionally, using the contours of the early glacier mapping and estimating the surface elevations using ground Global Positioning System measurements and orbital digital terrain models (from the Shuttle Radar Topography Mission, Shuttle Radar Topography Mission, and Terra/Advanced Spaceborne Thermal Emission and Reflection Radiometer [ASTER] Channel 3 images), it was observed that thinning of the remaining glaciers had occurred between 1959 and 2000, where El Pecho lost ~70 m in elevation and La Panza lost ~30 m (Schneider et al. Citation2008). Based on the degree of deglaciation observed, it was further surmised that total deglaciation was likely within several decades, perhaps as early as 2020 (Schneider et al. Citation2008).
Historically, the northern slope of Popocatépetl (19.02°N, 98.63°W), ~17 km south of Iztaccíhuatl, was also glaciated. In 1958, these glaciers covered an area of 0.729 km2 (Lorenzo Citation1964), comprising a firn field with three northward-extending glaciers (White Citation1978). However, these glaciers experienced rapid retreat through the latter half of the 1990s into the early 2000s. Much of this loss was driven by an increase in volcanic activity at the summit (Delgado-Granados et al. Citation2007), which began in 1994 with a series of explosive volcanic events and, after 1996, alternating effusive and explosive events that accelerated ice retreat. The deposition of tephra on the glacial ice likely played a key role in increasing melting (White Citation2002; Julio-Miranda et al. Citation2008). Through the use of pairs of aerial photographs and photogrammetric techniques, Andrés et al. (Citation2007) estimated the 3D ice loss at several time points, where almost 4 × 10⁶ m3 of volumetric loss was recorded between November 1997 and December 2002. By 2001, although ice masses were present on part of the summit, the ice no longer flowed and the glaciers were thus declared extinct (Delgado-Granados et al. Citation2007). Although the increase in volcanic activity (which has largely continued to the present day) is thought to be the primary driver for the glacier extinction at Popocatépetl, it has been hypothesized that climate change and air pollution due to its proximity to Mexico City may have played a small role (Delgado-Granados Citation2007).
Though neither Pico de Orizaba nor Iztaccíhuatl is currently erupting, they are not presently classified as extinct. Iztaccíhuatl is considered dormant, because there is no historic record of significant volcanic activity and much of the lavas at the summit are thought to be Pleistocene in age (Nixon Citation1989). Pico de Orizaba has experienced several ash eruptions and some fumarolic activity in recorded history (between 1530 and 1870 C.E.; Carrasco-Nùñez and Rose Citation1995; De la Cruz-Reyna and Carrasco-Nùñez Citation2002) and is considered active but presently dormant (Macías Citation2007). Therefore, future volcanic activity cannot be ruled out as a potential factor affecting the remaining glaciers in the upcoming decades.
Regions of temperate climate surround both Pico de Orizaba and Iztaccíhuatl, although at higher elevations (>4,300 m on Pico de Orizaba and >4,000 m on Iztaccíhuatl) tundra and ice cap climates predominate (White Citation1978). At lower elevations surrounding Pico de Orizaba, it is typically drier during the winter and rainier between late spring and early autumn (White Citation1978). Near Iztaccíhuatl, rain is more prevalent year-round at lower elevations, although winter is still typically the driest season (White Citation1978). Though long-term climate records do not appear to be available at either summit (within the tundra/ice cap climate regimes), weather stations are present at Sierra Negra (7 km southwest of Pico de Orizaba and over a kilometer lower in elevation). This summit area, home to the Large Millimeter Telescope and the High-Altitude Water Cherenkov Gamma Ray Observatory, is classified as a tundra environment (Carramiñana et al. Citation2007), and the annual average temperatures from 2000–2008 were at or just above 0°C (Carrasco et al. Citation2009).
Here, we aim to update the glacier monitoring of these summit regions over the last two decades, with a focus on variations since the 2007 update of Pico de Orizaba (Cortés-Ramos and Delgado-Granados Citation2013) and the 2008 update of Iztaccíhuatl (Schneider et al. Citation2008). We use the method of band ratios in order to provide a more robust understanding of the current and recent glacier changes in these areas. Some recent mapping of these regions was performed using the Normalized Difference Snow Index and a range of different Landsat and Sentinel-2 images over 15-year intervals (Veettil and Wang Citation2018); however, studies have shown that using band ratios, along with an additional threshold to help identify ice in shadows for Sentinel-2 images, provides more accurate results (Paul et al. Citation2016). We further explore higher-resolution temporal variations, comparing outlines derived from images collected 1–6 years apart (depending on the availability of high-quality, low-snow images). In addition, we use thermal-band Landsat images to estimate surface temperatures in order to obtain a more comprehensive understanding of the ground conditions within the summit areas.
Methods
Multispectral satellite imagery over the regions of interest was obtained from the U.S. Geological Survey (USGS) using the GloVis tool (glovis.usgs.gov; U.S. Department of the Interior/U.S. Geological Survey Citation2005). Several different instruments were used in this analysis:
Enhanced Thematic Imager Plus (ETM+) on Landsat 7. Visible, near-infrared (NIR), and short-wave infrared (SWIR) bands have a resolution of 30 m, the thermal infrared band resolution is 60 m (resampled to 30 m), and the panchromatic band resolution is 15 m. In operation since 1999, permitting a longer temporal observation range but limited by the 31 May 2003 failure of the Scan Line Corrector that led to significant gaps in the data coverage of images collected after this date.
Operational Land Imager (OLI) and Thermal Infrared Sensor on Landsat 8. The visible, NIR, and SWIR band resolution is 30 m, and the panchromatic band resolution is 15 m. The thermal infrared band resolution is 100 m (resampled to 30 m). In operation since 2013.
Multispectral Imager (MSI) on Sentinel-2 (European Space Agency). The visible and NIR band resolution is 10 m, and SWIR resolution is 20 m. Sentinel-2A has been in operation since 2015; Sentinel-2B has been in operation since 2017. Permits slightly higher-resolution observations but only in recent years.
For all instruments, cloud-free or nearly cloud-free images were identified, and only those where the summit region was not obscured were used for further analysis. Due to the frequency of re-imaging inherent to these orbital platforms (e.g., each Landsat orbiter covers the Earth’s surface every 16 days), it was possible to obtain many cloud-free images at each site, although, as expected, most of these images fall within the drier months except as noted.
All mapping was performed using the QGIS open-source software suite (http://qgis.osgeo.org; QGIS Development Team Citation2018), with some data processing steps performed with GRASS GIS (http://grass.osgeo.org; Grass Development Team Citation2018). The two primary tasks performed were semi-automated glacier mapping and surface temperature estimation (using thermal infrared imagery). In addition, the ASTER GDEM2 tiles over the study areas were obtained from the National Aeronautics and Space Administration’s (NASA) Earthdata (earthdata.nasa.gov) and used to produce elevation profiles in each summit area and to identify the lowest-elevation glacier extents at several different time steps. In general, the spatial resolution of the ASTER GDEM2 is ~75 m/pixel, and the vertical root mean square error (RMSE) is 8.68 m (ASTER GDEM Validation Team Citation2011). However, accuracy errors vary by location and by the number of images used to generate the GDEM at each pixel, where RMSEs are higher when fewer images are used (less than ten) but stabilize at scene counts above approximately fifteen (ASTER GDEM Validation Team Citation2011). Without obtaining higher resolution topography, we cannot validate the local RMSE but will make approximations of the accuracy based on scene counts.
Semi-automated glacier mapping
Because ice and snow are highly reflective in the red-infrared to NIR parts of the spectrum (Dozier Citation1989) and highly absorptive in the SWIR, taking the ratio of these bands has proven to be a highly robust method for identifying the boundaries of glaciers (Albert Citation2002; Paul et al. Citation2002; Paul and Kääb Citation2005). Historically, data from ASTER were one of the primary sources for this type of glacier mapping (e.g., Kääb et al. Citation2002; Svoboda and Paul Citation2009; Gjermundsen et al. Citation2011). However, with the failure of the onboard SWIR detectors in 2008, ASTER scenes collected after that point cannot be used for glacier mapping by this method. We therefore focus on Landsat data, supplemented with some more recent imagery from the European Space Agency’s Sentinel-2, in this study. The panchromatic bands of both ETM+ and OLI, which include both the red-infrared and NIR wavelengths, can be used in lieu of the narrower bands to obtain higher-resolution glacier boundaries (Paul et al. Citation2016). Due to the resolution of the instruments of interest (15 m at best using the panchromatic band of the Landsat imagers, 10 m for Sentinel-2), variations must be on the order of tens of meters in order to be detected using this method. Though month-to-month and/or interannual variations rarely meet this threshold, it is nevertheless a viable method for detecting glacier variations over time spans of several years to decades.
In all cases, the lower-resolution SWIR band was resampled such that both bands used have an equivalent resolution. The Raster Calculator was used to take the ratio of the NIR or panchromatic band to the SWIR band using raw digital numbers, as recommended by Paul et al. (Citation2002). A threshold ratio value for glacier classification was identified manually, using a false-color composite (NIR–red–green) for comparison. Typical glacier ratio thresholds are between two and three (Paul et al. [Citation2016] and references therein). For Sentinel-2 images, an additional blue band threshold was applied, because this has been shown to improve the classification of ice in shadows (Paul et al. Citation2016). Typical threshold values for this parameter are between 500 and 2,000 (Paul et al. Citation2016). The threshold(s) were then used to reclassify the raster and convert it to vector polygons. Polygons were manually edited down on an as-needed basis using visual interpretation, and glacier area extents were calculated. Glacier extents from Landsat imaging instruments (ETM+ and OLI) can be directly compared, although comparisons between outlines derived from Landsat and MSI on Sentinel-2 are more challenging due to inaccuracies in co-registration (Storey et al. Citation2016) between the two platforms. Nevertheless, qualitative interpretations can still be made in some cases (with potential errors noted throughout).
We only report glacial extents derived from images that contain the least visible snow. However, because ice and snow have similar spectral signatures (Dozier Citation1989), it is possible that there is some snow contamination in the glacier boundary mapping. Changes in the glacier extent over time were noted, along with instances of possible/likely snow contamination, and are described in the Discussion section.
Surface temperature estimation
To estimate the surface temperature throughout the summit region, thermal band data from Landsat 7 and 8 can be used, along with several assumptions regarding surface materials and properties. The basic equation for calculating land surface temperature (LST) is
where k1 and k2 are constants based on the thermal band (found in image metadata) and L is the surface radiance of the thermal band (USGS Citation2018). Surface radiance is calculated by first converting the raw digital numbers (Qcal) to at-sensor radiance (Lλ):
where ML and AL are the multiplicative and additive constants for the thermal band (found in image metadata; USGS Citation2018). A simple atmospheric correction is performed using the tool developed by Barsi et al. Citation2003, Citation2005), available at atmcorr.gsfc.nasa.gov (Barsi et al. Citation2003). This tool identifies appropriate atmospheric profiles (of pressure, air temperature, and water vapor) from the National Centers for Environmental Prediction based on the image date, time, and location and applies a radiative transfer model to calculate the applicable values for transmissivity (τ) and upwelling and downwelling radiance (Lu and Ld, respectively). A calculation of the corrected, at-surface thermal radiance (L) is performed as follows (Barsi, Barker, and Schott Citation2003; Lo Vecchio et al. Citation2018):
This atmospheric correction and surface radiance calculation method is expected to predict surface temperatures within ±2°C where surface emissivity (ε) is known. In this study, in situ measurements of emissivity are not available. We instead use simple landscape classification assignments, where typical emissivity values for each surface type are assumed. For the glacierized and snow-covered regions, extents are derived using the methods described in the previous subsection, and a constant emissivity of 0.98 is assigned (Rees Citation1990). There is some variability in the emissivity of snow and different types of ice (between 0.98 and 0.995), which introduces uncertainties of around ±0.4°C when calculating the brightness temperature (Rees Citation1993). For all other surface types, we use the Normalized Difference Vegetation Index (NDVI), which has a known relationship to surface emissivity (Caselles and Sobrino Citation1989). NDVI is often used in the classification of vegetation from remote sensing data sets (Tucker and Sellers Citation1986) and is calculated from the red-infrared and NIR reflectance using the following equation:
In order to more accurately obtain the NDVI values at the surface, it is important to perform the calculation in Equation (4) using atmospherically and topographically corrected surface reflectance rasters (Moreira et al. Citation2016). To obtain these for both the NIR and red channels, we first convert the raw digital number values to at-sensor reflectance using appropriate constants (USGS Citation2018) and perform a simple Dark Object Subtraction (DOS) correction using the GRASS GIS function i.landsat.toar. DOS is a purely image-based atmospheric method that infers a uniform correction where the darkest pixel in a scene is assumed to have a reflectance of zero. The GRASS GIS function i.topo.corr was then used to generate an illumination model based on (1) the scene’s topography from the ASTER GDEM2 tile over the region of interest and (2) local illumination conditions at the time of image acquisition (solar zenith and azimuth, found in image metadata). This illumination model and the GRASS GIS function i.topo.corr were then used to perform a topographic correction on the DOS-corrected surface reflectance data.
From the NDVI map, and using threshold values for the NDVI of fully vegetated (NDVIv) and bare soil (NDVIs), we can calculate a proportion of vegetation (PV), or the fraction of vegetation per pixel (Carlson and Ripley Citation1997):
All pixels with NDVI values less than NDVIs, which was set to 0.2, are assumed to be 100 percent bare soil (PV = 0), whereas all pixels with NDVI values greater than NDVIv, set to 0.5, are assumed to be fully (PV = 1) vegetated (Sobrino, Jiménez-Muñoz, and Paolini Citation2004). Constant emissivity values are assumed for each of these surfaces using reasonable values for each material type. For mixed pixels, where the vegetation proportion is between 0.2 and 0.5, the emissivity (ε) is calculated as follows (Caselles and Sobrino Citation1989; Sobrino, Jiménez-Muñoz, and Paolini Citation2004):
where εv and εs are the emissivity values for pure vegetation and soil, respectively assigned as 0.973 and 0.996 (Avdan and Jovanovska Citation2016). It is important to note that the atmospheric correction performed on the thermal band data is expected to estimate surface temperatures within ±2°C, where emissivity values are known (Barsi et al. Citation2005). Because emissivity values for each land-type classification span a range and we do not have field measurements of this parameter, the values used are only approximations and may result in additional errors in surface temperature estimation. In the case of snow/ice and vegetation, with narrower ranges of typical emissivity, this error is on the order of around ±0.5°C. For bare soil, with much more variation in typical emissivity values and a stronger dependence on soil moisture (Mira et al. Citation2017), errors could be on the order of up to around 5°C. Because the output land surface temperature maps produce realistic results (see next section), we conclude that they provide a reasonable estimate of the actual surface temperature.
Results
Semi-automated glacier mapping
Pico de Orizaba, Glaciar Norte
At Glaciar Norte on Pico de Orizaba, reasonably snow-free and cloud-free images were obtained between 2001 and 2019. Most of these images were collected during the dry season (November through February), although a couple of August images were cloud-free and appeared to have very little snow cover (2013 and 2015) and were included to allow for better temporal coverage of glacier changes. shows the derived glacial boundaries, as well as the glacier areas at most of these time points. Due to gaps in the image data for the Landsat 7, areas could not be derived for any ETM+ images after May 2003. Although there are slight orthorectification differences between Landsat and Sentinel-2 (causing a small shift in the derived glacier outlines), we include an outline from the 23 February 2018 MSI image for comparison. A recently obtained outline from a Landsat 8 image obtained on 11 March 2019 was also included in .
Figure 2. Boundaries of Glaciar Norte (Pico de Orizaba) derived from mostly snow-free images since 2001 using Landsat 7 (ETM+), Landsat 8 (OLI), and Sentinel-2 (MSI). Outlines are overlain on a false-color composite of the Landsat 8 image from March 2019. Note that there is a slight shift in the georeferencing between Landsat and Sentinel-2, so the 2018 outline is somewhat offset. White boxes highlight the regions of greatest change since 2001.
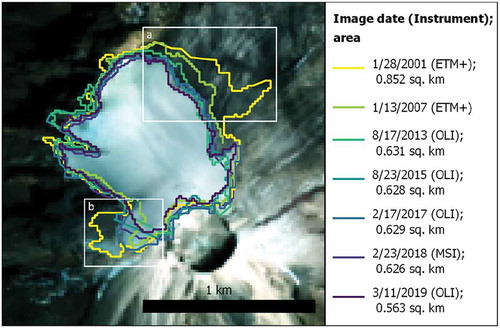
The extent of Glaciar Norte has generally decreased over time, where an areal loss of approximately 30 percent was observed between 2001 and 2019. The largest region of retreat was located on the northeastern edge of the glacier (). Between 2001 and 2017, a total loss of 0.18 km2 was observed in this region of the summit. In the decade between 2007 and 2017, approximately 100 m of linear retreat was observed in this location, accounting for an area loss of approximately 0.066 km2.
We also find that glacier changes have occurred to the west of the summit crater, where there was a larger extent observed in 2001 as compared to 2019 (). There are some small increases in apparent glacier extent in this region (e.g., in February 2017), which are likely due to classification errors where snow adjacent to the glacier is indistinguishable from ice. However, the larger overall change from 2001 to 2019, a difference in area of 0.064 km2, may be related to the final retreat of the occidental/suroccidental glacier tongues.
Pico de Orizaba, Glaciar Oriental
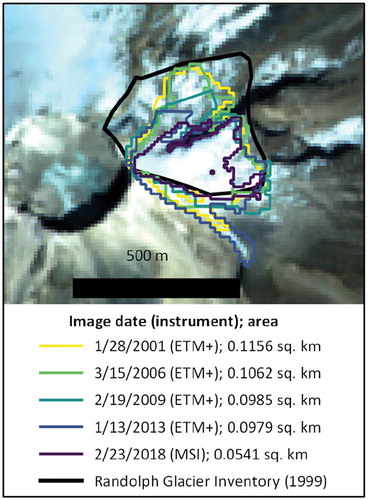
Because Glaciar Oriental is rather small, it is not always detectable in Landsat images due to a range of challenges, including obvious snow adjacent to the glacier, small clouds that obscure observations, difficulties identifying boundaries at the resolution of orbital imagery, and, in the case of ETM+ images, losing all or a significant part of the glacier to data gaps. We use the extents in the Randolph Glacier Inventory to help identify the glacier location (RGI Consortium Citation2017). It should be noted that though the latest inventory released is from 2017, the outlines pertaining to this particular region have not been updated and still reflect the approximate extent in 1999. Moreover, the Randolph Glacier Inventory (RGI) outlines are rather generalized and do not do a good job of characterizing the more subtle surface variations that are apparent when analyzing these features in detail. Due to the size of this glacier, it was possible to identify Landsat 7 ETM+ images where data gaps do not interfere with mapping the extent, so we exclusively use images that yield complete outlines and valid areal extents for this analysis.
shows the outline of Glaciar Oriental on Pico de Orizaba. We find that the area of Glaciar Oriental as of 2001 was 0.116 km2, similar in extent to the outline found in the RGI (black line in ; RGI Consortium Citation2017) and roughly consistent with the observations of Cortés-Ramos and Delgado-Granados (Citation2015), who found that the area of Glaciar Oriental did not change significantly from the observations of Lorenzo (Citation1964). However, over the last several decades, we have recorded additional losses to the areal extent of Glaciar Oriental: by 2018, the areal extent measured was 50 percent smaller than that which was observed in 2001, where the bulk of the ice loss occurred from 2013 to 2018. Furthermore, the most recent outlines indicate that ice is currently only present in the southern part of the area that was glacierized in 2001. There is a north-facing cliff (around tens of meters high as estimated from the ASTER GDEM2) that bisects this region; ice only remains above this cliff, on the higher-elevation southern surface and above ~5,315 m in altitude.
Figure 3. Changes in Glaciar Oriental on Pico de Orizaba between 2001 and 2018, compared to the outline in the RGI from 2009. Most outlines are derived from images from ETM+ on Landsat 7 with the exception of 23 February 2018, from MSI on Sentinel-2. The background image is a color composite of the image from February 2018.
Iztaccíhuatl (El Pecho and La Panza)
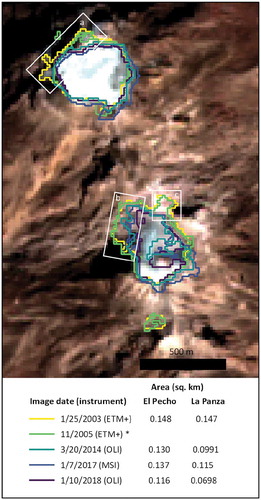
shows the glacier outlines at the summit of Iztaccíhuatl from 2003 to 2018 using the best cloud- and snow-free images from Landsat 7 and 8 and Sentinel-2 and includes the areal extents of both the El Pecho (northern) and La Panza (southern) glacial regions. The Sentinel-2 outline from 2017 is slightly shifted south and east of the Landsat-derived outlines, which accounts for some of the apparent deviations. Much of the glacier retreat observed at Iztaccíhuatl has been on the northern/western part of El Pecho (), constituting ~0.024 km2 of areal ice/snow loss between 2003 and 2014, with an additional loss of ~0.017 km2 distributed around the entire glacier between 2014 and 2018 (for a total areal loss of ~0.034 km2). At La Panza, there has also been some ice loss in the northwestern () and northeastern () parts of the glacier, as well as a gap in the middle of the glacier that account for a total area difference of 0.078 km2 between 2003 and 2018. It is also possible that some ice has been misclassified due to debris cover or other darkening at La Panza, particularly in the 2014 image (which appears to have the lowest areal extent in ), because although this region looks somewhat darker in 2014, it once again has a band ratio consistent with ice in the subsequent images from MSI in 2017 and OLI in 2018. It is also notable that there is a small ice detection south of La Panza derived from the earliest images in , consistent with the location of the Atzintli Glacier, which is no longer present (Schneider et al. Citation2008). In 2018, we observe that 80 percent of the 2001 El Pecho area remains, whereas La Panza lost approximately 52.5 percent of its areal extent since 2003.
Figure 4. Glacier outlines at the summit of Iztaccíhuatl derived from Landsat images collected between 2003 and 2018 and a Sentinel-2 image from 2017. White boxes highlight some of the observed areas of retreat. Outlines are overlain on the OLI image from January 2018. *Two different ETM+ images from 14 November and 30 November 2005 are included to obtain an improved outline across data gaps. However, we do not use this merged outline to obtain the areal extent at this time point.
Surface temperature estimation
Surface temperature maps were derived using the methods described in the previous section for all noncloudy Landsat 7 and 8 images over both summit areas, including images where the summit is snow covered. Note that all surface temperatures are rough estimates, due to both the approximation of surface properties like emissivity and the intrinsic errors in the atmospheric correction of thermal data (Barsi et al. Citation2005). In addition, all Landsat images are collected at a similar time of day (around 5 p.m. GMT/11 a.m. local time), and many images collected during the wet season include clouds over the summit. Therefore, all temperature estimates described here only offer rough approximations and do not represent all possible times/variations.
Pico de Orizaba
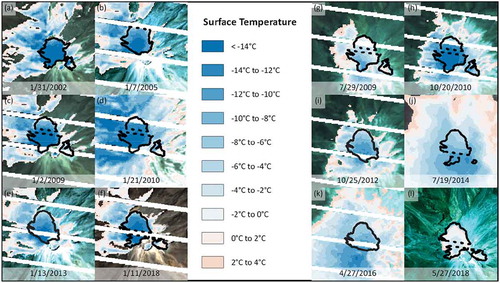
show the land surface temperature maps for a selection of cloud-free January images collected since 2002. Because these images are from the peak of the dry season at Pico de Orizaba, they tend to have the least visible snow and cloud contamination. The temperatures over Glaciar Norte itself are generally well below freezing, as is the surrounding soil at the summit (although it is important to note that, due to the inherent variability in soil emissivity and the lack of ground observations, the temperature of bare soil is subject to higher errors than that of ice or vegetation). We also show some of the LST maps collected during the wet season (), although there were fewer usable (cloud-free) images available during these months. Ice surface temperatures during the wet season are 5°C–10°C warmer than those seen during the dry season but are generally well below the freezing point of water. Snow-covered soil, abundant in some of the wet season images (most notably in July 2014 [] and April 2016 []) also tend to be below freezing for tens to hundreds of meters downslope from the glacier. However, the image from 27 May 2018 indicates that the ice surface temperatures on the northern part of the glacier are at or near the melting point of water. We also note that the region northeast of the glacier generally tends to have the warmest surface temperatures over the summit area, reaching about 15°C during several months.
Figure 5. Land surface temperature maps (for temperatures less than 4°C) at Pico de Orizaba, derived from a selection of Landsat images (a)–(f) during the dry season in January and (g)–(l) during the wet season (April–October) on Pico de Orizaba. Glacier outlines shown are from , where the outline from the temporally closest snow-free image was used for each time point: (a) 28 January 2001; (b) 7 January 2005; (c), (d), (g), (h) 19 February 2009; (e), (i) 17 August 2013; (j) 18 December 2014; (f), (l) 11 January 2018; and (k) 29 November 2016. At all January time points shown, the ice temperatures are colder than −8°C. In many cases, the surface temperatures adjacent to the glacier are also below freezing. Many of the wet season images contain extensive snow cover, with the exception of (g) and (l).
In order to better understand surface temperature variations throughout the year, we collected the average temperature profile for each month using as many cloud-free images as possible across all available years from all Landsat 7 and 8 LST maps. Profiles were taken crosswise over Glaciar Norte to span the region of retreat shown in , as well as down the center of the glacier, extending northwest from the summit crater. Each monthly profile is the result of averaging over two to twelve observations depending on image availability and data gaps (ETM+), where most dry season months were composed of more than seven profiles and most wet season months were averaged over less than five profiles (and months with only one image available were excluded). Resulting average monthly temperature profiles are shown in and , respectively. For both of these plots, regions with a white background are on the glacier itself (based on the glacier extent mapped in 2018) and the regions that are shaded gray are bare ground adjacent to the glacier. Each figure also includes the elevation derived from the ASTER GDEM2 along the profile. We find that the surface temperature of the glacier itself is generally below freezing along both profiles, with some seasonal variability. In the wet season (approximately April through October), ice temperatures are warmer by about 5°C–10°C compared to the peak of the winter dry season (November through February). In addition, we observe average monthly soil temperatures that are 15°C–20°C warmer on the northeastern side of profile A to A′ compared to the southwestern part of the profile ().
Figure 6. (Top) Monthly average surface temperatures across Pico de Orizaba’s Glaciar Norte and the (bottom) associated elevation profile. Regions shaded in gray are adjacent to the glacier (using the boundaries mapped in 2018). Inset map shows the location of the profile (superposed on a 2018 OLI image), and the dashed cyan line demarcates the freezing point of water. The standard error for each profile is within a few degrees (see Supplemental Figure 1 for error bands).
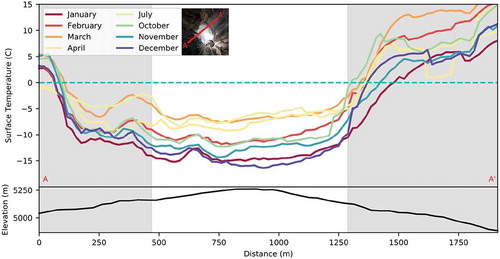
Figure 7. (Top) Monthly average surface temperature profiles of Glaciar Norte on Pico de Orizaba, along a profile that extends northwest from the summit crater, with the (bottom) associated elevation profile. The gray-shaded region is the soil beyond the edge of the glacier, and the dashed horizontal cyan line represents the freezing temperature of water. The standard error for each profile is generally plus or minus a few degrees (see Supplemental Figure 2 for error bands).
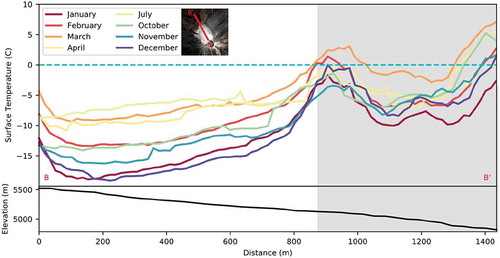
At Glaciar Oriental, we observe that surface temperatures over parts of the glacierized region remain below freezing year-round. However, both the northern and southern sides of the profile shown in peak at reasonably high temperatures, particularly during the spring and summer months (March–July). As discussed previously, we found that in 2001, the glacier area was roughly equivalent to the extent in the RGI (black outline in inset of ; RGI Consortium Citation2017). However, by 2013, the only region containing ice was the southern side of the small, north-facing cliff that bisects the RGI extent, as indicated by the shaded regions in (where the vertical dashed line represents the cliff location). The cliff height as measured using the ASTER GDEM2 is on the order of 10–30 m, fairly close to the vertical resolution and dwarfed by the overall elevation changes across profile C to C′ (bottom plot in ). Surface temperatures on the northern side of the cliff, with overall average monthly temperatures that peak at 5°C–10°C during the wet season at the lowest elevations, still tend to drop below freezing at the base of the cliff, likely due to shadowing effects. However, in images collected after 2013, no glacier ice is identified in this region, even when using an additional threshold in the blue band to better characterize ice in shadow (as recommended by Paul et al. Citation2016). The southern side of Glaciar Oriental also reaches temperatures that appear to be above the freezing point of water during several dry-season months, although this region remained glacierized in the images we analyzed. Note that, because there are fewer good images over smaller Glaciar Oriental, the standard error of these average profiles is fairly high (up to ±5°C; Supplemental Figure 3) in addition to the errors inherent to this method of estimating surface temperatures. Furthermore, it is probable that at the edge of the glacier extent, pixels are a mix of ice and bare soil. These uncertainties likely account for the apparent higher (above melting) temperatures at the southernmost edge of profile C to C′, where the ice itself is probably closer to 0°C. It is possible that this region of the glacier is thinning due to these warmer temperatures and may be at risk for additional areal retreat in the near future.
Figure 8. Average monthly surface temperature profiles across Glaciar Oriental on Pico de Orizaba, spanning the outline from the RGI (black outline in inset). Gray-shaded regions do not contain glaciers (each boundary is labeled with the year at which the glacier ended at that point along the profile). The dashed vertical gray line represents the ridge that bisects the region, where the glacier is presently limited in extent to south of the ridge. The bottom plot shows the elevation along the profile from the ASTER GDEM2 (see Supplemental Figure 3 for error bands).
Iztaccíhuatl
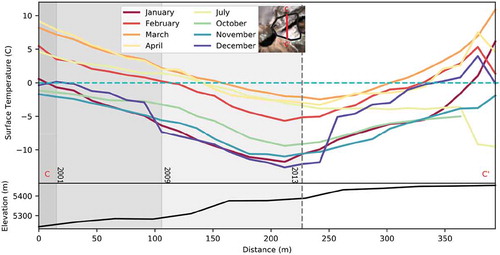
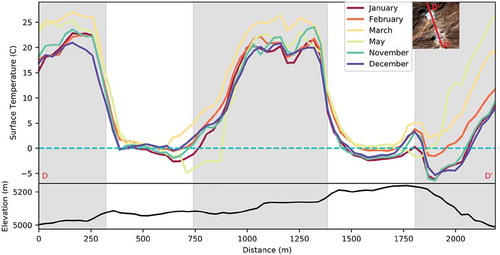
In general, surface temperatures at the subpeaks of Iztaccíhuatl are warmer than those at Pico de Orizaba. We similarly average over all available LST profiles by month to obtain monthly averages using all available cloud-free Landsat images between 1999 and 2018, where there are more total usable profiles between November and February (more than seven) compared to those in March and May (less than four). There are two or less images available for April and June through October, so these months are excluded. We see a trend similar to that of Pico de Orizaba, where the average temperatures are generally higher in the spring months than during the winter. In addition, the temperatures of the bare ground surrounding the glaciers is significantly higher than at Pico de Orizaba (averaging >15°C year-round and as high as 25°C in March and April). The only non-icy region that tends to have surface temperatures below 10°C is the northernmost part of profile D to D′ (), which is relatively higher in elevation and experiences some topographic shadowing. The surface temperatures of the glaciers are markedly lower than the surrounding regions, consistently at or just below the freezing point of water throughout the year. Apparent ice temperatures above 0°C at the glacier edges are likely attributable to errors in temperature calculation and the influenced of mixed materials in the pixels at the ice boundaries. Winter (dry season) surface temperatures also appear to be slightly higher (by a few degrees) at the lower-elevation La Panza summit compared to the El Pecho summit. The La Panza summit has experienced more extensive ice loss over the last decade (see section “Iztaccíhuatl (El Pecho and La Panza)”), although the differences in ice surface temperatures over each glacier are similar in magnitude to the error bars (Supplemental Figure 4) and are therefore not considered significant. It is plausible that these glaciers are experiencing thinning in addition to the areal losses observed, and they may also be at risk of continued areal loss due to the fact that their surface temperatures are very close to the melting point of water throughout the year.
Figure 9. Surface temperature profiles, averaged by month since 2002, spanning the two remaining glaciers on Iztaccíhuatl. Gray-shaded regions do not contain glaciers, whereas the regions with white backgrounds cover (from left to right) La Panza and El Pecho. The bottom plot shows the variation in elevation along the track from the ASTER GDEM2 (for error bands, see Supplemental Figure 4).
Discussion
At Pico de Orizaba, we find that most of the areal ice loss is concentrated in the northern/eastern side of the Glaciar Norte ice cap, as well as just west of the summit crater. In 2001, the downslope remnants of Glaciar de Jamapa observed by Palacios and Vázquez-Selem (Citation1996) were no longer apparent, consistent with their estimate that the two ice patches would not survive more than 5–10 years. We also observed changes in Glaciar Oriental, on the eastern part of the Pico de Orizaba summit.
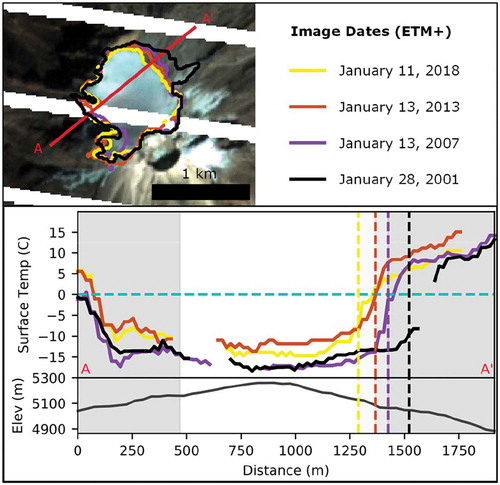
Unsurprisingly, the location with the most consistent retreat over the last two decades (the northeast side of Glaciar Norte) tended to have higher surface temperatures as estimated from the Landsat thermal band imagery. shows four selected glacier outlines (from 2001, 2007, 2013, and 2018), as well as profiles of surface temperatures across the glacier derived from the associated thermal band data (plotted above the profile’s elevation from the ASTER GDEM2). We find that the surface temperatures within this region of concentrated retreat are significantly warmer than the soil on the opposite side of the glacier (by about 15°C–20°C). The southwestern side of the glacier is ~30 m higher in elevation and is topographically shadowed, allowing the surface temperatures adjacent to the glacier to persist at temperature below freezing for several hundred meters in all images observed. To what extent regional air pollution is affecting the retreat of Glaciar Norte is unknown. Atmospheric sampling of nitrogen dioxide (NO2), carbon monoxide (CO), and sulfur dioxide (SO2) performed on the northwest of Pico de Orizaba (at 3,300 m.a.s.l.) shows a daily pattern that suggests the influence of pollution generated by anthropogenic processes from the Mexico City basin (Márquez et al. Citation2005). The transport of air pollutants outside the Mexico City basin exhibit three wind circulation patterns (de Foy et al. Citation2005). For one in particular, referred to as O3-South (because it corresponds to days when the ozone is highest in the south of Mexico City), the plume leaves the basin mainly to the south and fans out and impacts both the Pacific coast to the west and the Gulf coast to the east. The air pollutants that are transported to the east show some looping around the Pico de Orizaba volcano due east, with northward transport along the flanks of the Sierra Madre Oriental (de Foy et al. Citation2006). This atmospheric transport of air pollutants from the Mexico City basin is correlated with the retreat of the glacier, and it is possible that pollution plays some role in glacier loss. However, we cannot definitively determine causation with the present data. The altitudinal retreat of the glacier in this northeastern summit area (as measured using the ASTER GDEM2) between 2001 and 2018 was approximately 40 m, from 5,020 to 5,058 m.a.s.l. Over the Pico de Orizaba summit region, approximately 4 percent of ASTER GDEM2 pixels had scene counts of less than ten, and aproximately 85 percent of pixels had scene counts greater than fifteen, so we expect that the RMSEs are reasonably low (≤9 m). Because the measured elevation changes are on the order of around four times larger than the typical RSME, this difference is well above the expected limit of detection using the ASTER GDEM2 and provides a reasonable estimate of altitudinal retreat.
Figure 10. (Top) Retreat of Glaciar Norte at Pico de Orizaba and (bottom) associated surface temperature and elevation profiles from A to A′. Glacier outlines were obtained from ETM+ images collected around the same time of year (dashed parts of the outlines reflect gaps in image coverage) and are overlain on a false-color composite from January 2018. The dashed horizontal cyan line in the temperature profile plot highlights the freezing point of water, and the vertical dashed lines show the retreat of the glacier edge at each time point. All yellow lines correspond to 2018; all orange lines correspond to 2013; all purple lines correspond to 2007; and all black lines correspond to 2001. The bottom part of the profile plot shows the elevation along the profile.
Smaller Glaciar Oriental on Pico de Orizaba was also found to have experienced retreat in recent decades, in contrast to previous observations. Between 1958 and 2007, the area of Glaciar Oriental did not vary significantly compared to the other glaciers on Pico de Orizaba (Palacios and Vázquez-Selem Citation1996; Cortés-Ramos and Delgado-Granados Citation2012). The glacier extent that we measured in 2001 was roughly consistent with previous observations (Cortés-Ramos and Delgado-Granados Citation2015). However, areal ice loss appeared more rapid recently, especially in the last 5 years. By 2018, we observe that Glaciar Oriental lost approximately 50 percent of its 2001 area, where most of the remaining ice mass was limited to the higher-elevation, southern side of a cliff that extends ENE from the summit crater. It is possible that Glaciar Oriental has experienced thinning/surface lowering between 1958 and 2007, a phenomenon observed in many glacier systems throughout the world (e.g., Berthier et al. Citation2004; Paul and Haeberli Citation2008; Malecki, 2017; Dehecq et al. Citation2019). However, with the lack of elevation data with sufficiently high resolution, we cannot confirm this hypothesis. We further find that the surface temperatures are higher both in the region where retreat has occurred and at the southern margin of the remaining glacier area, indicating that it is possible that this region is at risk for future ice losses despite its relatively higher elevation. In 2001, we find that the lowest elevation glacial extent at Glaciar Oriental was 5,228 m, north of the cliff. By 2018, the glacier only extends to 5,293 m, at the southeasternmost edge of the glacier.
At Iztaccíhuatl, it was previously estimated that the glaciers may not persist beyond 2020 (Schneider et al. Citation2008). As of 2018, these glaciers were somewhat smaller in extent but not necessarily consistent with total loss within the next 2 years. Areal losses of 0.032 and 0.077 km2 were observed at El Pecho and La Panza between 2003 and 2018, where lower-elevation La Panza has suffered the most extensive loss. Compared to the rate of areal shrinking found between 1958 and 2007 (Schneider et al. Citation2008), the rate of loss that we observe over the last 15 years appears to be somewhat lower. However, it is important to note that these observations only account for area changes, not volume loss. Because volume change requires high-resolution topography, it is impossible to characterize such variations with existing orbital data and would likely require repeated field campaigns in the future to fully characterize the ice loss in 3D space. The surface temperatures at Iztaccíhuatl are largely found to be greater than those found at Pico de Orizaba, over both the glaciers themselves and especially over the surrounding bare soil at the summit. This is likely due in large part to lower elevation, where the peak of Iztaccíhuatl is approximately 500 m lower than Pico de Orizaba. Due to the warmer ice temperatures that approach the melting point of water, it is plausible that volume loss is actively taking place, at least during part of the year.
Over the summit region of Iztaccíhuatl, 68 percent of pixels in the ASTER GDEM2 had scene counts less than fifteen, suggesting higher overall RMSEs. We are therefore less confident in the accuracy of elevation changes at Iztaccíhuatl (for pixels with scene counts less than fifteen, typical RMSE ranges between 10 and 16 m). The observed change in elevation of La Panza between 2003 and 2018 was ~70 m, along the western side of the glacier. At El Pecho, over the same time span, approximately 45 m of altitudinal retreat was noted on the north side of the glacier (from 5,192 m to 5,238 m).
Conclusions
It is clear that glacier retreat is taking place at both Pico de Orizaba and Iztaccíhuatl. Semi-automated mapping using orbital multispectral imagery reveals two primary concentrations of retreat on Pico de Orizaba’s Glaciar Norte ice cap: the northeastern glacier face, which has retreated approximately 100 m in horizontal distance (and ~40 m in elevation) between 2007 and 2018, and west of the summit crater, where the occidental and suroccidental glaciers once extended down to 4,930 m and presently extends to only 5,310 m. We also observe retreat of Glaciar Oriental, on the eastern summit of Pico de Orizaba, which had shown little area change between 1958 and 2007 but lost approximately 50 percent of its areal extent between 2003 and 2018. At the lower-elevation summits of Iztaccíhuatl, we find that glaciers at El Pecho and La Panza have retreated by approximately 20 percent and 50 percent, respectively, between 2003 and 2018, although it is plausible that these glaciers will persist beyond 2020 (the time frame for total glacier loss estimated by Schneider et al. Citation2008). Fairly high temperatures over ice (at/near 0°C) and bare soil (up to ~15°C adjacent to glaciers) are noted, especially near/over parts of Glaciar Oriental, El Pecho, and La Panza, suggesting that these regions may be particularly susceptible to future ice loss. Continued monitoring of these sites is important, because these glaciers are part of a dwindling population of equatorial glaciers and are the only permanent ice masses at this latitude across the Northern Hemisphere. Among other things, the retreat of such glaciers could cause the loss of microbial diversity that is endemic to these environments (Callegan et al. Citation2008). Future in situ observations would be helpful to better quantify the factors that are impacting modern ice losses in this unique environment and to identify higher-resolution changes in ice volume over time.
Supplemental Material
Download Zip (3.2 MB)Acknowledgments
All Landsat 7, Landsat 8, and Sentinel-2 imagery used in this study are courtesy of the U.S. Geological Survey, obtained through the GloVis tool (glovis.usgs.gov). ASTER GDEM2 is a product of METI and NASA and was acquired from the Land Processes Distributed Active Archive Center (LP-DAAC) using the Earthdata tool (earthdata.nasa.gov).
Disclosure statement
No potential conflict of interest was reported by the authors.
Supplemental material
Supplemental data for this article can be accessed on the publisher’s website.
Additional information
Funding
References
- Albert, T. H. 2002. Evaluation of remote sensing techniques for ice-area classification applied to the tropical Quelccaya Ice Cap, Peru. Polar Geography 26:210–26. doi:10.1080/789610193.
- Andrés, N., J. J. Zamorano, J. J. Sanjosé, A. Atkinson, and D. Palacios. 2007. Glacier retreat during the recent eruptive period of Popocatépetl volcano, Mexico. Annals of Glaciology 45:73–82. doi:10.3189/172756407782282598.
- ASTER GDEM Validation Team. 2011. ASTER Global Digital Elevation Model Version 2 – Summary of validation results. https://asterweb.jpl.nasa.gov/gdem.asp.
- Avdan, U., and G. Jovanovska. 2016. Algorithm for automated mapping of land surface temperature using LANDSAT 8 satellite data. Journal of Sensors 2016: 1480307. doi:10.1155/2016/1480307.
- Barsi, J. A., J. L. Barker, and J. R. Schott. 2003. An atmospheric correction parameter calculator for a single thermal band earth-sensing instrument. IGARSS03, 21–25 July 2003, Centre de Congres Pierre Baudis, Toulouse, France.
- Barsi, J. A., J. R. Schott, F. D. Palluconi, and S. J. Hook. 2005. Validation of a web-based atmospheric correction tool for single thermal band instruments. Earth Observing Systems X, Proc. SPIE Vol. 5882, August 2005, San Diego, CA.
- Berthier, E., Y. Arnaud, D. Baratoux, C. Vincent, and F. Rémy. 2004. Recent rapid thinning of the “Mer de Glace” glacier derived from satellite optical images. Geophysical Research Letters 31:L17401. doi:10.1029/2004GL020706.
- Callegan, R. P., M. F. Nobre, P. McTernan, J. R. Battista, R. Navarro-González, C. P. McKay, M. S. Da Costa, and F. A. Rainey. 2008. Description of four novel psychrophilic, ionizing radiation sensitive species of the genus Deinococcus from alpine environments. International Journal of Systematic and Evolutionary Microbiology 58:1252–58. doi:10.1099/ijs.0.65405-0.
- Carlson, T. N., and D. A. Ripley. 1997. On the relation between NDVI, fractional vegetation cover, and leaf area index. Remote Sensing of the Environment 62:241–52. doi:10.1016/S0034-4257(97)00104-1.
- Carramiñana, A., E. Mendoza, J. Nava, and L. Vázquez. 2007. The HAWC experiment at the Parque Nacional Pico de Orizaba: A feasibility study for the HAWC Collaboration. https://hawc-observatory.org/publications/docs/repfin.pdf.
- Carrasco, E., A. Carramiñana, R. Avila, C. Gutiérrez, J. L. Avilés, J. Reyes, J. Meza, and O. Yam. 2009. Weather at Sierra Negra: 7.3-yr statistics and a new method to estimate the temporal fraction of cloud cover. Monthly Notices of the Royal Astronomical Society 398:407–21. doi:10.1111/mnr.2009.398.issue-1.
- Carrasco-Nùñez, G., and W. I. Rose. 1995. Eruption of a major Holocene pyroclastic flow at Citlaltépetl volcano (Pico de Orizaba), México, 8.5-9.0 ka. Journal of Volcanology and Geothermal Research 69:197–215. doi:10.1016/0377-0273(95)00023-2.
- Caselles, V., and J. A. Sobrino. 1989. Determination of frosts in orange groves from NOAA-9 AVHRR data. Remote Sensing of Environment 29:135–46. doi:10.1016/0034-4257(89)90022-9.
- Cortés-Ramos, J., and H. Delgado-Granados. 2012. The recent retreat of Mexican glaciers on Citlaltépetl Volcano detected using ASTER data. The Cryosphere Discussions 6:3149–76. doi:10.5194/tcd-6-3149-2012.
- Cortés-Ramos, J., and H. Delgado-Granados. 2013. La evolucion del mayor glaciar de Mexico vista desde el espacio. Mexico: UNAM, Coordinacion de Estudios de Posgrado.
- Cortés-Ramos, J., and H. Delgado-Granados. 2015. Reconstruction of glacier area on Citlaltépetl volcano, 1958 and implications for Mexico’s deglaciation rates. Geofisica Internacional 54:111–25. doi:10.1016/j.gi.2015.04.008.
- Cruz-Kuri, L., C. P. McKay, and R. Navarro-González. 2001. Spacial and temporal patterns of some climate parameters around the timberline of Pico de Orizaba. In First steps in the origin of life in the universe, ed. J. Chela-Flores, T. Pwen, and F. Rauling, 293–301. Dordrecht: Springer.
- Cullen, N. J., T. Molg, G. Kaser, K. Hussein, K. Steffen, and D. R. Hardy. 2006. Kilimanjaro glaciers: Recent areal extent from satellite data and new interpretation of observed 20th century retreat rates. Geophysical Research Letters 33:L16502. doi:10.1029/2006GL027084.
- de Foy, B., E. Caetano, V. Magaña, A. Zitácuaro, B. Cárdenas, A. Retama, R. Ramos, L. T. Molina, and M. J. Molina. 2005. Mexico City basin wind circulation during the MCMA-2003 field campaign. Atmospheric Chemistry and Physics 5:2267–88. doi:10.5194/acp-5-2267-2005.
- de Foy, B., J. R. Varela, L. T. Molina, and M. J. Molina. 2006. Rapid ventilation of the Mexico City basin and regional fate of the urban plume. Atmospheric Chemistry and Physics 6:2321–35. doi:10.5194/acp-6-2321-2006.
- De la Cruz-Reyna, S., and G. Carrasco-Nùñez. 2002. Probabilistic hazard analysis of Citlaltépetl (Pico de Orizaba) Volcano, eastern Mexican Volcanic Belt. Journal of Volcanology and Geothermal Research 113:307–18. doi:10.1016/S0377-0273(01)00263-3.
- Dehecq, A., N. Gourmelen, A. S. Gardner, F. Brun, D. Goldberg, P. W. Nienow, E. Berthier, C. Vincent, P. Wagnon, and E. Trouvé. 2019. Twenty-first century glacier slowdown driven by mass loss in High Mountain Asia. Nature Geoscience 12:22–27. doi:10.1038/s41561-018-0271-9.
- Delgado-Granados, H. 2007. Climate change vs. volcanic activity: Forcing Mexican glaciers to extinguish and related hazards. Proceedings of the First International Conference on the Impact of Climate Change: On High-Mountain Systems, Bogotá, Colombia.
- Delgado-Granados, H., P. Julio Miranda, C. Huggel, S. Ortega Del Valle, and M. A. Altorre Ibargüegoitia. 2007. Chronicle of a death foretold: Extinction of the small-size tropical glaciers of Popocatépetl volcano (Mexico). Global and Planetary Change 56:13–22. doi:10.1016/j.gloplacha.2006.07.010.
- Dozier, J. 1989. Spectral signature of alpine snow cover from Landsat 5 TM. Remote Sensing of the Environment 28:9–22. doi:10.1016/0034-4257(89)90101-6.
- Francou, B. P., P. Ribsteain, P. Wagnon, E. Ramirez, and B. Pouyaud. 2005. Glaciers of the tropical Andes: Indicators of global climate variability. In Global change and mountain regions, advances in global change research, ed. U. M. Huber, H. K. Bugmann, and M. A. Reasoner, Vol. 23, 197–204. Dordrecht: Springer.
- Gjermundsen, E. F., R. Mathieu, A. Kääb, T. Chinn, B. Fitzharris, and J. O. Hagen. 2011. Assessment of multispectral glacier mapping methods and derivation of glacier area changes, 1978-2002, in the central Southern Alps, New Zealand, from ASTER satellite data, field survey and existing inventory data. Journal of Glaciology 57:667–83. doi:10.3189/002214311797409749.
- Grass Development Team. 2018. Geographic Resources Analysis Support System (GRASS) Software, Version 7.4. Open Source Geospatial Foundation. http://grass.osgeo.org.
- Haeberli, W., and M. Beniston. 1998. Climate change and its impact on glaciers and permafrost in the Alps. Ambio 27:258–65.
- INEGI (Instituto Nacional de Estadística Geografía e Informática). 1995. Topographic map, Huejotzingo, 1:50,000, map no. E14B42.
- INEGI (Instituto Nacional de Estadística Geografía e Informática). 2002. Mapa topografico escala 1:50,000. Coscomapetec de Bravo, zona E14B46.
- Julio-Miranda, P., H. Delgado-Granados, C. Huggel, and A. Kääb. 2008. Impact of the eruptive activity on glacier evolution at Popocatépetl Volcano (Mexico) during 1994-2004. Journal of Volcanology and Geothermal Research 170:86–98. doi:10.1016/j.jvolgeores.2007.09.011.
- Kääb, A., C. Huggel, F. Paul, R. Wessels, B. Raup, H. Kieffer, and J. Kargel. 2002. Glacier monitoring from ASTER imagery: Accuracy and applications. Proceedings of EARSeL-LISSIG-Workshop Observing out Cryosphere from Space, 43–53. Bern.
- Kääb, A., C. Huggel, L. Fischer, S. Guex, F. Paul, I. Roer, N. Salzmann, S. Schlaefli, K. Schmutz, D. Schneider, et al. 2005. Remote sensing of glacier- and permafrost-related hazards in high mountains: An overview. Natural Hazards and Earth System Science 5:527–54. doi:10.5194/nhess-5-527-2005.
- Kaser, G. 1999. A review of the modern fluctuations of tropical glaciers. Global and Planetary Change 22:93–103. doi:10.1016/S0921-8181(99)00028-4.
- Kaser, G., and H. Osmaston. 2002. Tropical Glaciers. Cambridge, UK: Cambridge University Press.
- Lo Vecchio, A., M. G. Lenzano, M. Durand, E. Lannutti, R. Bruce, and L. Lenzano. 2018. Estimation of surface flow speed and ice surface temperature from optical satellite imagery at Viedma glacier, Argentina. Global and Planetary Change 169:202–13. doi:10.1016/j.gloplacha.2018.08.001.
- Lorenzo, J. L. 1964. Los glaciares de Mexico. Mexico City, Mexico: Universidad Nacional Autonoma de Mexico.
- Macías, J. L. 2007. Geology and eruptive history of some active volcanoes of Mexico. In Geological Society of Mexico: Geological Society of America Special Paper 422, ed. S. A. Alaniz-Alvarez and A. F. Nieto-Samaniego, 183–232. Boulder, CO: The Geological Society of America.
- Malecki, J. 2016. Accelerating retreat and high-elevation thinning of glaciers in central Spitsbergen. The Cryosphere 10:1317–29. doi:10.5194/tc-10-1317-2016.
- Márquez, C., T. Castro, A. Muhlia, M. Moya, A. Martínez-Arroyo, and A. Báez. 2005. Measurements of aerosol particles, gases and flux radiation in the Pico de Orizaba National Park, and its relationship to air pollution transport. Atmospheric Environment 39:3877–90. doi:10.1016/j.atmosenv.2005.03.015.
- Mira, M., E. Valor, R. Boluda, V. Caselles, and C. Coll. 2017. Influence of soil water content on the thermal infrared emissivity of bare soils: Implications for land surface temperature determination. Journal of Geophysical Research 112:F04003.
- Moreira, E. P., M. de Morisson Valeriano, I. Del Arco Sanches, and A. R. Formaggio. 2016. Topographic effect on spectral vegetation indices from Landsat TM data: Is topographic correction necessary? BCG - Boletim De Ciencias Geodesicas 22:95–107. doi:10.1590/S1982-21702016000100006.
- Nixon, G. T. 1989. The geology of Iztaccíhuatl Volcano and adjacent areas of the Sierra Nevada and Valley of Mexico. Special Paper 219, Geological Society of America, 58.
- Palacios, D., and L. Vázquez-Selem. 1996. Geomorphic effects of the retreat of Jamapa Glacier, Pico de Orizaba volcano (Mexico). In Geografiska Annaler: Series A, Physical Geography, 78 (1), 19–34. doi:10.1080/04353676.1996.11880449.
- Paul, F., and A. Kääb. 2005. Perspectives on the production of a glacier inventory from multispectral satellite data in Arctic Canada: Cumberland Peninsula, Baffin Island. Annals of Glaciology 42:59–66. doi:10.3189/172756405781813087.
- Paul, F., A. Kääb, M. Maisch, T. Kellenberger, and W. Haeberli. 2002. The new remote-sensing-derived Swiss glacier inventory: I. Methods. Annals of Glaciology 34:355–61. doi:10.3189/172756402781817941.
- Paul, F., A. Kääb, M. Maisch, T. Kellenberger, and W. Haeberli. 2004. Rapid disintegration of Alpine glaciers observed with satellite data. Geophysical Research Letters 31:L21402. doi:10.1029/2004GL020816.
- Paul, F., S. H. Winsvold, A. Kääb, T. Nagler, and G. Schwaizer. 2016. Glacier remote sensing using Sentinel-2. Part II: Mapping glacier extents and surface facies, and comparison to Landsat 8. Remote Sensing 8:575. doi:10.3390/rs8070575.
- Paul, F., and W. Haeberli. 2008. Spatial variability of glacier elevation changes in the Swiss Alps obtained from two digital elevation models. Geophysical Research Letters 35:L21502. doi:10.1029/2008GL034718.
- QGIS Development Team. 2018. QGIS geographic information system. Open Source Geospatial Foundation Project. http://qgis.osgeo.org
- Rees, W. G. 1990. Physical principles of remote sensing. Cambridge: Cambridge University Press.
- Rees, W. G. 1993. Infrared emissivities of Arctic land cover types. International Journal of Remote Sensing 14:1013–17. doi:10.1080/01431169308904392.
- RGI Consortium. 2017. Randolph Glacier Inventory - A dataset of global glacier outlines: Version 6.0. Colorado, USA: Technical Report, Global Land Ice Measurements from Space. doi:10.7265/N5-RGI-60.
- Schneider, D., H. Delgado-Granados, C. Huggel, and A. Kääb. 2008. Assessing lahars from ice-capped volcanoes using ASTER satellite data, the SRTM DTM and two different flow models: Case study on Iztaccíhuatl (Central Mexico). Natural Hazards and Earth System Sciences 8:559–71. doi:10.5194/nhess-8-559-2008.
- Sobrino, J. A., J. C. Jiménez-Muñoz, and L. Paolini. 2004. Land surface temperature retrieval from LANDSAT TM 5. Remote Sensing of Environment 90:434–40. doi:10.1016/j.rse.2004.02.003.
- Soruco, A., C. Vincent, B. Francou, and J. F. Gonzalez. 2009. Glacier decline between 1963 and 2006 in the Cordillera Real, Bolivia. Geophysical Research Letters 36:L03502. doi:10.1029/2008GL036238.
- Storey, J., D. P. Roy, J. Masek, F. Gascon, J. Dwyer, and M. Choate. 2016. A note on the temporary misregistration of Landsat-8 Operational Land Imager (OLI) and Sentinel-2 Multi Spectral Instrument (MSI) imagery. Remote Sensing of Environment 186:121–22. doi:10.1016/j.rse.2016.08.025.
- Svoboda, F., and F. Paul. 2009. A new glacier inventory on southern Baffin Island, Canada, from ASTER data: I. Applied methods, challenges, and solutions. Annals of Glaciology 50:11–21. doi:10.3189/172756410790595912.
- Thompson, L. G., E. Mosley-Thompson, M. E. Davis, and H. H. Brecher. 2011. Tropical glaciers, recorders and indicators of climate change, are disappearing globally. Annals of Glaciology 52:23–34. doi:10.3189/172756411799096231.
- Thompson, L. G., H. H. Brecher, E. Mosley-Thompson, D. R. Hardy, and B. G. Mark. 2009. Glacier loss on Kilimanjaro continues unabated. PNAS 106:19770–75. doi:10.1073/pnas.0906029106.
- Tucker, C. J., and P. J. Sellers. 1986. Satellite remote sensing of primary production. International Journal of Remote Sensing 7:1395–416. doi:10.1080/01431168608948944.
- U. S. Department of the Interior/U. S. Geological Survey. 2005. Global visualization (GloVis) viewer. https://glovis.usgs.gov/.
- USGS. 2018. Landsat 8 (L8) data users handbook. Sioux Falls, SD: Department of the Interior, U.S. Geological Survey.
- Veettil, B. K., and S. Wang. 2018. An update on recent glacier changes in Mexico using Sentinel-2A data. Geografiska Annaler: Series A, Physical Geography. doi:10.1080/04353676.2018.1478672.
- White, S. E. 1978. Glaciers of Mexico. In Satellite image atlas of glaciers of the world, ed. R. S. Williams and J. G. Ferrigno, 383–405. Washington, D.C.: United States Government Printing Office.
- White, S. E. 2002. Glaciers of Mexico. In Satellite image atlas of glaciers of the world, ed. R. S. Williams and J. G. Ferrigno, 383–405. Washington, D.C.: United States Government Printing Office.
- Zemp, M., W. Haeberli, M. Hoelzle, and F. Paul. 2006. Alpine glaciers to disappear within decade? Geophysical Research Letters 33:L13504. doi:10.1029/2006GL026319.