
ABSTRACT
Palynological and sedimentological analyses of lacustrine cores from Baker Island, located in southeastern Alaska’s Alexander Archipelago, indicate that the beginning of the Younger Dryas chronozone, between approximately 12,900 cal yr BP and approximately 12,600 cal yr BP, was cooler and drier than modern conditions, based on decreases in the percentages of Pinus (pine) and Tsuga mertensiana (mountain hemlock) pollen accompanied by increases in Alnus (alder) pollen and fern spores. This initial cool period, lasting only 300 years, was relatively mild compared to the North Atlantic region, with an estimated temperature reduction of approximately 2°C from modern. Further, there is no sedimentological evidence of glaciation within the lake basin during this time interval. A subsequent increase in the percentages of Pinus and Picea cf. sitchensis (Sitka spruce) indicates that conditions ameliorated during the latter portion of the YD, between approximately 12,600 cal yr BP and approximately 11,700 cal yr BP.
Introduction
Climate during the Younger Dryas (YD) chronozone (~12,900 and ~11,700 cal yr BP; Rasmussen et al. Citation2006) is linked to a breakdown of thermohaline circulation in the North Atlantic (Broecker, Peteet, and Rind Citation1985; Broecker et al. Citation1989), resulting in severe cooling of that region (Broecker, Peteet, and Rind Citation1985; Bohncke Citation1993; Isarin and Renssen Citation1999; Clark et al. Citation2009). Modeling experiments (Mikolajewicz et al. Citation1997; Okumura et al. Citation2009) and foraminiferal oxygen isotope records from the Gulf of Alaska (Praetorius et al. Citation2020) indicate coeval cooling of the North Pacific by both oceanic and atmospheric pathways. Lake records in southeastern Alaska also record cooling that is roughly synchronous with the YD in the North Atlantic (Engstrom, Hansen, and Wright Citation1990; Hansen and Engstrom Citation1996).
Although the timing of YD in the North Pacific has been found to be largely synchronous with that in the North Atlantic, the nature and magnitude of the climatic change is poorly constrained. This is primarily due to the spatial heterogeneity of the YD signal (Kokorowski et al. Citation2008), which is especially apparent in coastal Alaska and British Columbia. Some studies report a change in vegetation consistent with a dry, cool climate (Peteet and Mann Citation1994; Hansen and Engstrom Citation1996; Ager and Rosenbaum Citation2009); others find evidence of a wet, cool climate (Mathewes, Heusser, and Patterson Citation1993), and still others find no evidence of a change in vegetation during the YD (Lacourse, Mathewes, and Fedje Citation2005).
Here, we present palynological and sedimentological data in an attempt to elucidate the nature and expression of the YD in the Pacific Northwest. Multiproxy analysis of a lacustrine core from southeastern Alaska’s Baker Island indicates a relatively brief cool period at the onset of the YD, followed by climatic amelioration for the remainder of the chronozone, a result that explains some puzzling discrepancies between YD records from coastal Alaska and British Columbia.
Study area
The informally named Bonsai Lake is located at ′′55° 16′ 52.44′′ N, 133° 38′ 15.21′′ W (107 m a.s.l.) in a granitic glacial valley (Ayuso et al. Citation2005) on Baker Island in southeastern Alaska’s Alexander Archipelago (). The lake is in a bedrock-dammed catchment with one outlet on the west end (). It has a maximum depth of 27 m and a surface area of approximately 0.35 km2. The modern ocean shoreline is 1.3 km west of the lake.
Figure 1. Location of study sites in southeastern Alaska: (1) Baker Island (this record); (2) Pass Lake, Prince of Wales Island (Ager and Rosenbaum Citation2009); (3) Mitkof Island (Ager et al. Citation2010); (4) Pleasant Island (Hansen and Engstrom Citation1996); (5) Lily Lake, Chilkat Peninsula (Cwynar Citation1990); (6) Haida Gwaii (Queen Charlotte Islands; Mathewes, Heusser, and Patterson Citation1993); (7) Haida Gwaii (Lacourse, Mathewes, and Fedje Citation2005); (8) Hummingbird Lake, Baranof Island (Ager Citation2019); (9) El Capitan Cave, Prince of Wales Island (Wilcox, Dorale, et al. Citation2019)
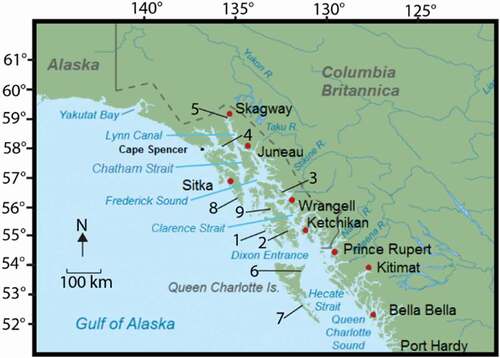
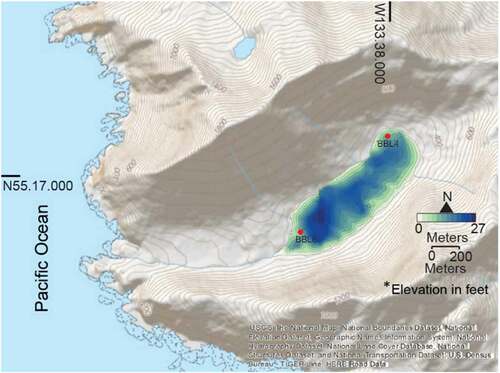
Figure 2. Bathymetry of Bonsai Lake with core site locations BBL4 and BBL6. Detailed analysis was only performed on BBL4
Neighboring Prince of Wales Island () has a maritime climate characterized by cool, generally wet conditions. Mean annual temperature and precipitation from Craig, Alaska, 37 km northeast of Bonsai Lake, are 7.2°C and 2,500 mm, respectively (1936–2016; Western Regional Climate Center).
Taxonomy herein is based on the CitationFlora of North America (Flora of North America Editorial Committee 1993+), and vegetation characterization is based on the classification of Viereck et al. (Citation1992). Common tree species in the Alexander Archipelago include western hemlock (Tsuga heterophylla) and Sitka spruce (Picea sitchensis). At higher elevations, mountain hemlock (Tsuga mertensiana) is more abundant. Also present are shore pine (Pinus contorta ssp. contorta), yellow cedar (Chamaecyparis nootkatensis), and red cedar (Thuja plicata). Alders are also common in the region. Red alder trees (Alnus rubra) occupy lower elevations, and Sitka alder shrubs (Alnus virdis ssp. sinuata) form dense thickets along rocky coastlines and stream banks, in avalanche scars, at forest edges, and in the subalpine zone (Pawuk and Kissinger Citation1989). Modern tree line on Baker Island is approximately 455 m a.s.l.
Methods
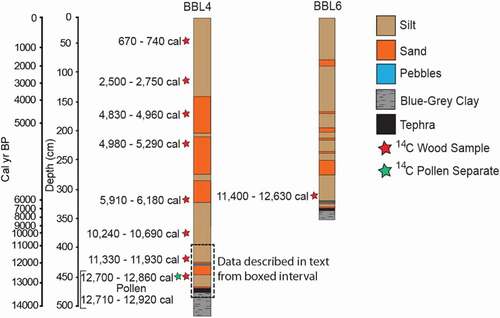
Sediment cores were collected in August 2014, following a bathymetric survey conducted with a Humminbird Matrix 47 3D sonar/GPS unit. Cores were collected from a modular raft. Surface cores were collected with a Bolivia corer and stabilized with Zorbitrol. Subsequent drives were extracted with a Livingstone corer. Near the northeast end of the lake, a 5.18-m core was extracted from 10.19 m of water at site BBL4 (′′55° 17′ 7.98′′ N, 133° 38′ 3.91′′ W; ). A correlative 3.5-m core was collected from the opposite side of the lake (core BBL6) and contains the same lithological units represented in core BBL4 (). Results described herein focus on the basal part of the cores (), which captures the entire YD interval.
Figure 3. Sediment cores BBL4 and BBL6 from Baker Island showing lithologic changes and radiocarbon sampling sites
Cores were logged and scanned at the National Lacustrine Core Facility (LacCore) in Minneapolis, Minnesota. High-resolution imaging was performed on a digital line scanner, producing an approximately 50 MB single image per 1.5-m core section at a resolution of 10 pixels per millimeter. Magnetic susceptibility analyses were conducted on split cores with a Geotek MSCL-XYZ core scanner at a resolution of 0.5 cm.
Grain size analysis was performed at the Arctic Coastal Geoscience Lab (ACGL) at the University of Alaska–Fairbanks (UAF) using a Beckman Coulter Counter LS 320. Samples were collected every 4 cm from 475 to 430 cm and every 10 cm from 430 to 400 cm. A gravel unit at 430 cm was too large to analyze in the Beckman Coulter counter. Prior to analysis, organic matter was removed by oxidation. Samples (1 cm3) were placed in approximately 10 mL of 30 percent hydrogen peroxide at room temperature until frothing ceased (~12–24 hours). Samples were then washed in deionized water, centrifuged, decanted, and placed in approximately 10 mL of 1 percent sodium hexametaphosphate solution for approximately 24 hours prior to analysis to inhibit flocculation.
Loss on ignition (LOI, % organics) was also conducted at the ACGL. One cubic centimeter of sediment was collected from core BBL4 every 1 cm from 470 to 425 cm and every 2 cm from 425 to 400 cm. We followed the standard ACGL lab procedure and heated samples for 1.5 hours at 550°C.
Ratios of carbon and nitrogen stable isotopes from bulk homogenized sediment samples were assessed using a ThermoFinnigan continuous-flow isotope ratio mass spectrometer at the UAF Alaska Stable Isotope Facility. Bulk sediment samples from core BBL4, which were not acid washed or acid fumigated, were collected every 4 cm from 470 to 430 cm and every 10 cm from 430 to 400 cm. USGS40 (glutamic acid) and USGS41 (glutamic acid enriched in 13C and 15N) were used as the standards. The mass of the bulk sediment varied from 2 to 15 mg depending on the organic content, with smaller masses derived from organic-rich horizons identified by loss on ignition. Analytical precision is 0.2 per mill for δ13C and 0.1 per mill for δ15N.
One cubic centimeter of sediment every 2 cm from 475 to 425 cm and every 4 cm from 425 to 400 cm was collected and processed for pollen analysis. Palynological processing at UAF followed a modified version of the standard methods described in Traverse (Citation1988), including treatment with 10 percent HCl, 10 percent KOH, and HF to remove carbonates, humic acids, and silicates. Acetolysis was not employed. A Lycopodium tablet (9,666 spores ± 6.9 percent Lycopodium, batch #3862) was added to each sample. Assemblage data are based on identification of at least 300 terrestrial pollen grains per sample. Spores were not included in the basic pollen sum. Pollen diagrams were created in Tilia software, v1.7.16 (Grimm Citation2011). Percentages of pollen taxa are based on the sum of all terrestrial pollen. Percentages of spores were calculated based on the sum of terrestrial pollen and spore taxa. Pollen and spore influx rates were calculated to determine grains per square centimeter per year (Faegri, Kaland, and Krzywinski Citation1989). Pollen zones are based on CONISS cluster analyses (Grimm Citation1987) and visual inspection. Alder pollen grains from selected horizons throughout the record were reexamined in order to differentiate Alnus viridis ssp. sinuata type from A. rubra type, following the criteria outlined in May and Lacourse (Citation2012).
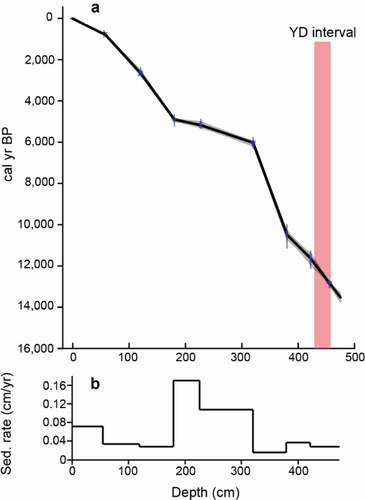
The chronology is based on radiocarbon dates of eight wood fragments from BBL4 (). Due to the location of the lake in a granite basin, terrestrial macrofossils and pollen derived from the drainage are unlikely to be contaminated by bedrock-derived carbon. Wood fragments and a pollen separate were sent to Lawrence Livermore National Laboratory for accelerator mass spectrometer dating on an HVEC 10 MV Model FN Tandem Van de Graaff Accelerator. Accelerator mass spectrometer ages were calibrated using IntCal13 with 2σ range (Reimer et al. Citation2013). The age–depth model was produced using Clam, v2.2 (Blaauw Citation2010; ). The age–depth model () uses linear interpolation between the eight dated wood fragments and extrapolates to the base of the core. The top of the core (0 cm) was assumed to be modern (0 cal yr BP).
Table 1. List of radiocarbon dates on Baker Island
Figure 4. (A) Age–depth model fit in the Clam package in R (Blaauw Citation2010), based on simple linear interpolation between calibrated ages and extrapolated to a depth of 475 cm. The YD unit (Rasmussen et al. Citation2006) is highlighted in red. (B) Variable sedimentation rates based on age model in (A)
Results
Lithology
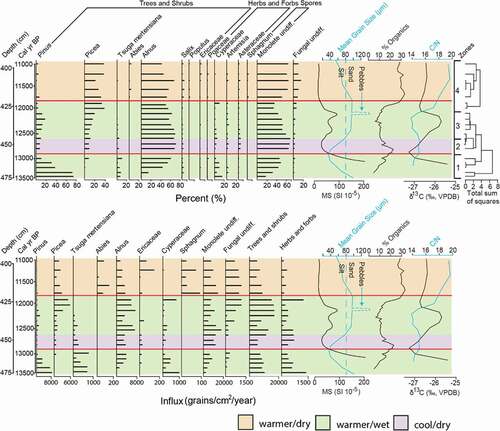
Sediment from depths ≥480 cm consists of blue-gray clay (mean grain size ~3 µm) with relatively high magnetic susceptibility of approximately 500 × 10−5 SI. The basal clay is overlain by the Baker Island tephra (Wilcox, Addison, et al. Citation2019). Overlying the Baker Island tephra (at 475 cm) in core BBL4 is light tan-colored sand (mean grain size of ~100 µm), with low organic percentages (~5 percent), high magnetic susceptibility (~200 × 10−5 SI), and δ13C of −25.4 per mill (). At 458 cm, mean grain size, magnetic susceptibility, and δ13C decreases to approximately 40 µm, approximately 70 × 10−5 SI, and −27.3 per mill, respectively. The organic fraction increases to 23 percent during this same depth interval (). A subsequent increase in mean grain size, magnetic susceptibility, and δ13C begins at 456 cm and culminates at 436 cm with a mean grain size of approximately 100 µm, magnetic susceptibility of 100 × 10−5 SI, and δ13C of −25.8 per mill. Conversely, organics decrease after 458 cm to approximately 6 percent at 440 cm. At 430 cm, pebbles are present. Above this gravel layer the sediment is light tan-colored silt with low magnetic susceptibility (<10 × 10−5 SI). Grain size decreases to approximately 50 µm by 400 cm. δ13C decreases after 436 cm, where it stabilizes at around −26.8 per mill. Organic percentages rise at 425 cm and reach 32 percent at 416 cm, where values stabilize. The C/N ratio varies between 14.1 and 15 between 470 to 435 cm, above which it increases to 19.5 at 410 cm.
Figure 5. Pollen percentage and influx rates during the late Pleistocene. Mean grain size, magnetic susceptibility, percentage organics, C/N, δ13C, pollen zones, and CONISS cluster diagram are to the right of both pollen percentage and influx rates. The YD interval (Rasmussen et al. Citation2006) is bounded by red lines based on the 14C age model (see )
Palynology
Alder taxa
Reexamination of Alnus pollen from selected horizons was conducted in an attempt to distinguish red alder trees, represented by A. rubra type, from Sitka alder shrubs, represented by A. viridis ssp. sinuata type. Of the grains identified, 90 to 100 percent of the 619 grains preserved in polar view (and thus measurable) from seven horizons were identified as A. viridis ssp. sinuata type. This may be an underestimate, because only three grains were identified as A. rubra type on the basis of quantitative factors. An additional 36 grains were assigned to A. rubra type based solely on the strength of the arci; all quantitative criteria for these grains are indicative of A. viridis ssp. sinuata type. Of the measurable grains, 100 percent from the basal horizon (475 cm) and 93 percent from the uppermost horizon (400 cm) were identified as A. viridis ssp. sinuata type; frequencies of A. viridis ssp. sinuata type from six intermediate horizons range from 90 to 96 percent. We therefore conclude that A. viridis ssp. sinuata type dominates throughout the record and that Sitka alder shrubs were the predominant alder species on Baker Island.
Zone 1 (475–460 cm)
Palynomorphs are absent from the blue-gray clay. Pinus (pine) pollen dominates the basal assemblage at 475 cm (13,500 cal yr BP), with 74 percent (8,000 grains/cm2/yr) of total pollen grains. Pinus decreases to 10 percent (4,000 grains/cm2/yr) by 460 cm, and Alnus (alder) increases from 18 to 61 percent (1,500 to 4,100 grains/cm2/yr) in the same interval. Cyperaceae (sedge) represents 16 percent of total pollen grains in the basal assemblage but decreases to 3 percent by 460 cm. Monolete spores increase from an initial 18 percent at 475 cm to 46 percent at 460 cm (2,000 to 9,500 spores/cm2/yr). Picea (spruce) first appears in the pollen record at 470 cm (13,200 cal yr BP) with less than 1 percent of total pollen grains. Tsuga mertensiana (mountain hemlock) is present at higher frequencies (>8 percent) only between 475 and 460 cm, where it comprises up to 10 percent (800 grains/cm2/yr) of total pollen grains. The vegetation between 475 and 460 cm can be characterized as pine woodland with areas of alder scrub but transitioning to an alder scrubland after 468 cm.
Zone 2 (460–445 cm)
A total of three pollen samples were analyzed in this zone. Pinus is found at less than 10 percent (<5000 grains/cm2/yr) and Picea comprises approximately 9 percent (~1,500 grains/cm2/yr). Tsuga mertensiana declines in this zone to less than 4 percent (<150 grains/cm2/yr). Alnus reaches its peak frequency with 75 percent total pollen grains; however, influx remains at approximately 4,000 grains/cm2/yr. Monolete spores are abundant, with frequencies up to 60 percent, but influx rates only increase slightly to 11,000 grains/cm2/yr. This vegetation can be classified as an alder scrubland.
Zone 3 (445–430 cm)
Pinus and Picea increase slightly to 15 percent (1,000 grains/cm2/yr) and 20 percent (4,100 grains/cm2/yr), respectively, and Alnus and monolete spores decrease to 60 and 38 percent, respectively. However, Alnus and monolete spore influx rates are more variable, ranging between 2,000 to 7,500 and 3,500 to 19,000 grains(spores)/cm2/yr, respectively. Tsuga mertensiana frequencies remain low (<4 percent). The increased frequency of conifers suggests that this may be a transitional period between an alder scrubland and a spruce woodland.
Zone 4 (430–400 cm)
Pinus decreases to minor amounts (<5 percent) and Picea increases to 40 percent (6,000 grains/cm2/yr). However, Picea influx values decrease to less than 1,000 grains/cm2/yr at 418 cm. Alnus is found at 60 percent (~7,000 grains/cm2/yr), with influx values decreasing to 4,500 grains/cm2/yr at 418 cm. Monolete spores have frequencies of 32 percent (10,000 spores/cm2/yr) but increase to 60 percent (~10,000 spores/cm2/yr) at 418 cm. An increase and high frequency in the pollen of Picea cf. sitchensis signifies a spruce woodland. However, there is a significant decrease in the influx of Picea cf. sitchensis beginning at 418 cm, which may indicate that the woodland was becoming more open.
Chronology
The chronology used to construct the age model of BBL4 is based on eight ages ( and ) with no reversals. The age model was used to place the YD chronozone between 460 and 418 cm. The 42 cm YD interval has a sedimentation rate of approximately 0.04 cm/yr ().
Discussion
Deglaciation and Bølling–Allerød warmth (13,500–12,900 cal yr BP)
Early in the record, at approximately 13,500 cal yr BP, mean grain size indicates deposition of sand (). The underlying unit is blue-gray clay, which is characteristic of glacial deposits (Lusas et al. Citation2017), likely from meltwater input following retreat of the ice from the immediate vicinity of the lake. We therefore infer that the sand was deposited during or after withdrawal of glaciers from the drainage. The abundance of Pinus (74 percent; ) at approximately 13,500 cal yr BP may be partially attributed to the lithology, because Pinus contorta favors sandy substrates (Viereck and Little Citation2007). Due to the broad climatic niche of Pinus, it is difficult to place constraints on climatic parameters based on the presence of this genus. However, the abundance (10 percent; ) of Tsuga mertensiana indicates moderate temperatures and relatively wet conditions at this time, because this taxon is characteristic of modern-day humid subalpine environments (Hebda Citation1983). The arrival of Picea cf. sitchensis at approximately 13,200 cal yr BP also indicates rising temperatures and/or increased precipitation because this taxon occupies modern-day temperate rainforests in southeastern Alaska (Viereck and Little Citation2007). An increase in the organic fraction between 13,500 and 12,900 cal yr BP () may indicate an increase in the density of the vegetation surrounding the lake. However, C/N ratios of approximately 14 suggest that the organic fraction is at least partially derived from primary productivity within the lake (; Meyers and Ishiwatari Citation1993). These observations are consistent with warming during the Bølling–Allerød period (Shakun and Carlson Citation2010).
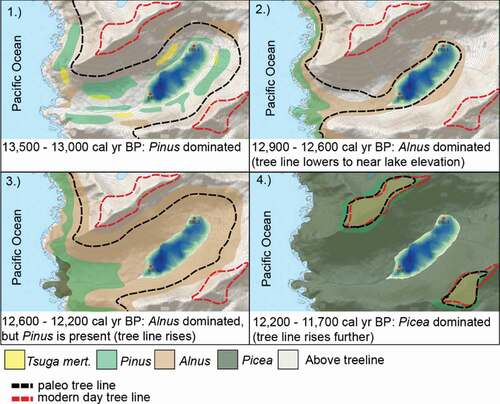
Figure 6. An interpretation of vegetation changes based on data from at distinct time intervals leading up to and during the YD chronozone
An early but brief cooling during the Younger Dryas (12,900–12,600 cal yr BP)
At approximately 12,900 cal yr BP, Pinus percentages decrease dramatically and assemblages are dominated by Alnus pollen and monolete spores (). This Alnus- and monolete spore–dominated assemblage is comparable to the modern pollen rain at tree line in the Malaspina Glacier District near Yakutat, southeastern Alaska (Peteet Citation1986), where the vegetation is dominated by a thick cover of the shrub Alnus viridis ssp. sinuata and ferns of the genus Dryopteris (personal communication, D.M.P., May 15th, 2017). Furthermore, 96 percent of Alnus pollen grains measured from a horizon in this zone are classified as A. viridis ssp. sinuata type based on the criteria of May and Lacourse (Citation2012). We infer that the pine woodland present in the drainage prior to the YD was replaced by alder scrub at the onset of the YD, when the elevation of tree line decreased in response to cooler temperatures (). Lowering of the tree line is further supported by an overall decrease in the influx of tree and shrub pollen, accompanied by an increase in the influx of herb and forb pollen, resulting in some of the lowest and highest values, respectively, between approximately 12,900 and approximately 12,600 cal yr BP (). We therefore place the elevation of Bonsai Lake at or near tree line during the first approximately 300 years of the YD.
Numerous sites in southeastern Alaska and coastal British Columbia (e.g., Hansen and Engstrom Citation1996; Lacourse, Mathewes, and Fedje Citation2005; Ager and Rosenbaum Citation2009; Ager et al. Citation2010; Ager Citation2019; ) record a decrease in Pinus immediately prior to the YD, signaling regional cooling (Ager Citation2019). Vegetation changes after this decrease vary from south to north. On Baker Island (this record), Prince of Wales Island approximately 70 km to the east (Ager and Rosenbaum Citation2009; ), and Baranof Island 160 km to the north (Ager Citation2019; ), Alnus pollen and monolete spores dominate after Pinus percentages decrease. On Pleasant Island, approximately 370 km north of Baker Island, herbaceous taxa are more prevalent after Pinus percentages drop (Engstrom, Hansen, and Wright Citation1990; Hansen and Engstrom Citation1996). This also appears to be the case at Lily Lake on the Chilkat Peninsula, approximately 450 km north of Baker Island (Cwynar Citation1990; ). However, the base of the Lily Lake record is nearly coeval with the start of the YD, obscuring changes in the vegetation. On Haida Gwaii, approximately 200 km south of Baker Island, Picea is replaced by pine parkland during the YD (Mathewes, Heusser, and Patterson Citation1993; ). Greater decreases of tree line at more northern sites at the onset of the YD may be responsible for the differences in vegetation changes between sites. A variable tree line response could enhance the YD cooling signal at more northern sites, such as Pleasant Island, where herbaceous taxa expand during the first half of the chronozone (e.g., Engstrom, Hansen, and Wright Citation1990). In between Pleasant Island and Haida Gwaii (), an abrupt decrease in percentages of Pinus is a widespread indicator of cooling associated with the YD (Ager Citation2019)
Neither northward migration nor ecological succession are considered viable explanations for the simultaneous decreases in Pinus percentages throughout southeastern Alaska. Maps of first arrivals of Pinus, Picea, and Tsuga heterophylla (Wilcox Citation2017; Ager Citation2019) following deglaciation show no evidence of a latitudinal trend; Pinus arrived on Pleasant and Baranof Islands () more than 1,000 years prior to arriving on Haida Gwaii. Furthermore, arrival times of Pinus are typically older to the west and younger to the east (Ager Citation2019), possibly indicating recolonization from scattered refugia on the west coast. Given the relatively early appearances of both Picea and Pinus at approximately 13,200 and approximately 13,500 cal yr BP on Baker Island, respectively, we hypothesize that these taxa dispersed from local refugia (Buma et al. Citation2014), and further succession was interrupted by YD cooling. With variations in arrival times on the order of several thousand years, ecological succession fails to explain widespread and coeval disappearance of pine parkland throughout southeastern Alaska at the onset of the YD.
From this evidence, we conclude that the transition from Pinus to Alnus during the onset of the YD on Baker Island is indicative of cooling conditions. Though the presence of Alnus can be indicative of warming and colonization of newly exposed land after glacial recession (Peteet et al. Citation2016), this record finds no evidence of glaciation in the lake basin immediately before or during the YD chronozone. This is based on the disappearance of blue-gray glacial deposits after approximately 13,500 cal yr BP. These findings are consistent with Ager (Citation2019), showing that increases in Alnus pollen and decreases in Pinus throughout southeastern Alaska reflect expansion of Sitka alder (A. viridis ssp. sinuata) shrubs as a result of colder temperatures.
The highest combined frequencies of Alnus and monolete spores occur between approximately 12,900 and approximately 12,600 cal yr BP (), representing the coldest part of the YD. If our hypothesis that tree line was at or near the elevation of Bonsai Lake (107 m a.s.l.) during the YD, whereas the modern-day tree line is at approximately 455 m a.s.l., then a temperature decrease of approximately 2°C from modern can be estimated if we assume a uniform wet adiabatic lapse rate through time (6°C/1,000 m). Because modern mean annual temperatures (MATs) in nearby Craig, Alaska, are 7.2°C (1936–2016; Western Regional Climate Center, Citation2017), MAT during the coldest part of the YD may have been approximately 5°C. A temperature decrease of approximately 2°C is roughly in agreement with pollen–climate transfer functions from Haida Gwaii (), which indicate a mean July temperature decrease of 2°C to 3°C from modern during the YD chronozone (Mathewes, Heusser, and Patterson Citation1993). Therefore, it appears that the onset of the YD was accompanied by relatively moderate cooling in southeastern Alaska and northern British Columbia.
In addition to moderate cooling and lowering of the tree line at the onset of the YD, the decrease in frequency of Tsuga mertensiana (to less than 4 percent) may indicate aridity, because T. mertensiana is the least drought tolerant of all Pacific Northwest coniferous trees (Minore Citation1979). Further evidence of increased aridity is provided by decreases in both magnetic susceptibility (from 200 to 20 × 10−5 SI) and mean grain size (from ~100 to ~40 µm) at approximately 12,900 cal yr BP, suggesting reduced sediment runoff, possibly from reduced rainfall.
C/N values of approximately 14 indicate a mixed aquatic/terrestrial source of organic matter (Meyers and Ishiwatari Citation1993). Thus, an increase in the organic fraction in conjunction with lower δ13C values at approximately 12,900 cal yr BP () may be driven by increased productivity within the lake and/or the vegetation transition from pine woodland to alder scrubland. Drier conditions during this period could have increased productivity due to increased light penetration, despite moderate cooling at the initiation of the YD.
Climate amelioration after the early Younger Dryas cooling and transition into the Holocene (12,600–11,000 cal yr BP)
An increase in the influx of tree/shrub pollen at approximately 12,600 () suggests rising tree line and warming temperatures. Rising tree line is further indicated at approximately 12,400 cal yr BP when Pinus increases to 15 percent. This is consistent with the increase of mean grain size to sand at approximately 12,500 cal yr BP, which would have been favorable for the spread of Pinus. These changes are accompanied by increasing δ13C values, possibly suggesting less light penetration as a result of increased sediment influx or a transition from alder scrubland to spruce woodland. Because C/N ratios are approximately 14, similar to earlier in the record, this could represent a mixed aquatic/terrestrial signal.
Beginning at approximately 12,200 cal yr BP, Picea cf. sitchensis increases in frequency to 25 percent as Pinus decreases to less than 5 percent (). This transition is indicative of an increase in temperature and/or precipitation. Because Picea cf. sitchensis initially appears at approximately 13,200 cal yr BP, we suggest that cold and/or dry conditions early in the YD may have prevented this taxon from increasing in frequency until the latter half of the chronozone, at approximately 12,200 cal yr BP, thereby disrupting successional order. C/N values also increase significantly at this time; ratios of approximately 20 suggest a predominantly terrestrial source (Meyers and Ishiwatari Citation1993), which may be attributed to an increase in precipitation and erosion. Low δ13C values and an increase in the organic fraction may therefore be indicative of the change in vegetation surrounding the lake, rather than aquatic productivity within the lake. A simultaneous increase in magnetic susceptibility to 100 × 10−5 SI () supports an influx of clastic material.
Atapproximately 11,700 cal yr BP, there is a significant decrease in the influx of trees/shrubs (), and may be the result of somewhat drier conditions. This is consistent with reconstructions of relatively warm and dry early- to mid-Holocene conditions throughout the Northern Hemisphere, driven by Earth’s orbital variations (Berger and Loutre Citation1991).
Reconstructions of mean July temperature during the YD chronozone based on a pollen–climate transfer function from southern British Columbia reveal minimal cooling; however, results indicate that warming occurred midway through the chronozone (Heusser, Heusser, and Peteet Citation1985). Mild conditions during the YD are also noted in other proxy records from the region. For example, a speleothem record from El Capitan Cave, 100 km north of Baker Island (), shows continual growth during the YD chronozone, suggesting no permafrost development or glaciers above the cave site (Wilcox, Dorale, et al. Citation2019). Glacial moraine studies in southwest British Columbia also show little evidence of glacial advancement during the YD (Clague et al. Citation1997).
Broader significance
Whereas records from coastal Alaska and British Columbia characterize the YD as either dry (Hansen and Engstrom Citation1996; Ager and Rosenbaum Citation2009) or humid (Mathewes, Heusser, and Patterson Citation1993), the Baker Island record reveals more variable conditions, with an abrupt, initial cooling followed by warmer and wetter conditions during the second half of the chronozone. This reconstruction is consistent with sedimentological indicators from Discovery Pond in south-central Alaska, which show an increase in temperature and effective moisture during the second half of the YD (Kaufman et al. Citation2010). Though the variability seen in the Baker Island record may be attributed to spatial heterogeneity of the climate signal throughout southeastern Alaska and coastal British Columbia, we prefer the interpretation that sample resolution may be responsible for the observed differences, in that samples from previous studies may represent only a portion of the YD. For example, three pollen samples span the YD on Hippa Island (Lacourse et al. Citation2012), whereas this reconstruction is based on ten samples throughout a 42-cm interval.
The early, cooler portion of the YD on Baker Island, between approximately 12,900 and approximately 12,600 cal yr BP, is coincident with a short period of North Atlantic Meridional Overturning Circulation collapse between approximately 12,920 and approximately 12,640 cal yr BP, reconstructed on the basis of precisely aligned Southern and Northern Hemisphere tree ring 14C records (Hogg et al. Citation2016). Additionally, 10Be ages from the Ahklun Mountains in southern Alaska indicate that glacier culminations occurred in the early and/or middle YD and constrain the age of a late-glacial moraine to 12.52 ± 0.24 yr BP (Young et al. Citation2019), providing further support for climatic amelioration prior to the end of the chronozone. Furthermore, δ18O values of planktonic foraminifera from the Gulf of Alaska show the most positive, or coldest, values during the early/mid YD, followed by decreasing values indicative of modest warming until 11,700 cal yr BP, when rapid warming occurs (Praetorius et al. Citation2020).
Speleothem records from the Pacific Northwest further support a brief, moderate YD response. A speleothem δ18O record from El Capitan Cave () reveals an approximately 0.6 per mill decrease in the first half of the chronozone, corresponding to a temperature and/or precipitation decrease (Wilcox, Dorale, et al. Citation2019). A stalagmite δ18O record from Oregon shows evidence of coldest conditions during the early-mid YD, with warming during the second half (Vacco et al. Citation2005). This speleothem record shows an approximately 1.6°C decrease in temperature based on calcite–water isotope fractionation estimations (Vacco et al. Citation2005). This is broadly consistent with the 2°C temperature reduction from this record.
Based on an estimated MAT decrease of approximately 2°C from modern on Baker Island between approximately 12,900 and approximately 12,600 cal yr BP, we suggest that YD cooling in the northeast Pacific was relatively mild compared to the North Atlantic, where records show atmospheric cooling of 5°C to 10°C (Alley Citation2000; Denton et al. Citation2005; Baldini et al. Citation2015). Therefore, we hypothesize that YD cooling in the northeast Pacific was driven by a weakening of the North Atlantic Meridional Overturning Circulation at the onset of the chronozone, and additional climatic forcings possibly strengthened the YD signal in the North Atlantic (Renssen et al. Citation2015; Hogg et al. Citation2016). However, further work will be needed to investigate this hypothesis.
Conclusion
This multiproxy record of the Younger Dryas from Baker Island, southeastern Alaska, provides evidence of variable climate within the chronozone. The chronozone began cool and dry at approximately 12,900 cal yr BP, but conditions became warmer and wetter by approximately 12,600 cal yr BP. Evidence of variability may help resolve differences in YD paleoclimate reconstructions from sites along the northeast Pacific coast. Furthermore, this record reveals differences in the magnitude of YD cooling between the northeast Pacific and North Atlantic, with this record indicating a relatively brief cooling at the onset of the YD and a more modest decrease in mean annual temperature compared to the North Atlantic.
Acknowledgments
We thank the University of Innsbruck and the USDA Forest Service Tongass National Forest Geology Program for the suppport they provided. We are also grateful to Dr. Nancy Bigelow for providing invaluable feedback over the years on this work in southeastern Alaska. Finally, we thank the anonymous reviewers for their critical feedback that thoroughly improved the article.
Disclosure statement
No potential conflict of interest was reported by the authors.
Additional information
Funding
References
- Ager, T. A. 2019. Late Quaternary vegetation development following deglaciation of northwestern Alexander Archipelago, Alaska. Frontiers in Earth Science 7:104. doi:https://doi.org/10.3389/feart.2019.00104.
- Ager, T. A., P. E. Carrara, J. L. Smith, V. Anne, and J. Johnson. 2010. Postglacial vegetation history of Mitkof Island, Alexander Archipelago, southeastern Alaska. Quaternary Research 73:259–68. doi:https://doi.org/10.1016/j.yqres.2009.12.005.
- Ager, T. A., and J. G. Rosenbaum. 2009. Late glacial-Holocene pollen-based vegetation history from Pass Lake, Prince of Wales Island, southeastern Alaska. US Geological Survey Professional Paper 1760–G.
- Alley, R. B. 2000. The Younger Dryas cold interval as viewed from central Greenland. Quaternary Science Reviews 19:213–26. doi:https://doi.org/10.1016/S0277-3791(99)00062-1.
- Ayuso, R. A., S. M. Karl, J. F. Slack, P. J. Haeussler, P. E. Bittenbender, G. A. Wandless, and A. S. Colvin. 2005. Oceanic Pb-isotopic sources of Proterozoic and Paleozoic volcanogenic massive sulfide deposits on Prince of Wales Island and vicinity, southeastern Alaska. Studies by the US Geological Survey in Alaska 1–20.
- Baldini, L. M., F. McDermott, J. U. Baldini, P. Arias, M. Cueto, I. J. Fairchild, D. L. Hoffmann, D. P. Mattey, W. Müller, D. C. Nita, et al. 2015. Regional temperature, atmospheric circulation, and sea-ice variability within the Younger Dryas event constrained using a speleothem from northern Iberia. Earth and Planetary Science Letters 419:101–10. doi:https://doi.org/10.1016/j.epsl.2015.03.015.
- Berger, A., and M. F. Loutre. 1991. Insolation values for the climate of the last 10 million years. Quaternary Science Reviews 10:297–317. doi:https://doi.org/10.1016/0277-3791(91)90033-Q.
- Blaauw, D. 2010. Clam version 2.2. Accessed November 11, 2016. http://www.chrono.qub.ac.uk/blaauw/clam.html.
- Bohncke, S. J. P. 1993. Lateglacial environmental changes in the Netherlands: Spatial and temporal patterns: A contribution to the ‘North Atlantic seaboard programme’ of IGCP-253, ‘Termination of the Pleistocene’. Quaternary Science Reviews 12:707–17. doi:https://doi.org/10.1016/0277-3791(93)90008-A.
- Broecker, W. S., J. P. Kennett, B. P. Flower, J. T. Teller, S. Trumbore, G. Bonani, and W. Wolfli. 1989. Routing of meltwater from the Laurentide Ice Sheet during the Younger Dryas cold episode. Nature 341:318–21. doi:https://doi.org/10.1038/341318a0.
- Broecker, W. S., D. M. Peteet, and D. Rind. 1985. Does the ocean-atmosphere system have more than one stable mode of operation? Nature 315:21–26. doi:https://doi.org/10.1038/315021a0.
- Buma, B., P. E. Hennon, A. L. Bidlack, J. F. Baichtal, T. A. Ager, and G. Streveier. 2014. Correspondence regarding “The problem of conifer species migration lag in the Pacific Northwest region since the last glaciation” by Eias, SA, (2013), Quaternary Science Reviews 77, 55-69. Quaternary Science Reviews 93:167–69. doi:https://doi.org/10.1016/j.quascirev.2014.02.020.
- Clague, J. J., R. W. Mathewes, J. P. Guilbault, I. Hutchinson, and B. D. Ricketts. 1997. Pre‐Younger Dryas resurgence of the southwestern margin of the Cordilleran ice sheet, British Columbia, Canada. Boreas 26:261–78. doi:https://doi.org/10.1111/j.1502-3885.1997.tb00855.x.
- Clark, P. U., A. S. Dyke, J. D. Shakun, A. E. Carlson, J. Clark, B. Wohlfarth, J. X. Mitrovica, S. W. Hostetler, and A. M. McCabe. 2009. The Last Glacial Maximum. Science 325:710–14. doi:https://doi.org/10.1126/science.1172873.
- Cwynar, L. C. 1990. A late Quaternary vegetation history from Lily Lake, Chilkat Peninsula, southeast Alaska. Canadian Journal of Botany 68:1106–12. doi:https://doi.org/10.1139/b90-139.
- Denton, G. H., R. B. Alley, G. C. Comer, and W. S. Broecker. 2005. The role of seasonality in abrupt climate change. Quaternary Science Reviews 24:1159–82. doi:https://doi.org/10.1016/j.quascirev.2004.12.002.
- Engstrom, D. R., B. C. S. Hansen, and H. E. Wright. 1990. A possible Younger Dryas record in southeastern Alaska. Science 250:1383–85. doi:https://doi.org/10.1126/science.250.4986.1383.
- Faegri, K., P. E. Kaland, and K. Krzywinski. 1989. Textbook of pollen analysis (No. Ed. 4). Hoboken, NJ: John Wiley & Sons Ltd.
- Flora of North America Editorial Committee, eds. 1993+. Flora of North America North of Mexico, Vol. 20+. New York: Oxford University Press.
- Grimm, E. C. 1987. CONISS: A FORTRAN 77 program for stratigraphically constrained cluster analysis by the method of incremental sum of squares. Computers & Geosciences 13:13–35. doi:https://doi.org/10.1016/0098-3004(87)90022-7.
- Grimm, E. C. 2011. TILIA software version 1.7.16. Springfield, IL: Illinois State Museum.
- Hansen, B. C. S., and D. R. Engstrom. 1996. Vegetation history of Pleasant Island, southeastern Alaska, since 13,000 yr B.P. Quaternary Research 46:161–75. doi:https://doi.org/10.1006/qres.1996.0056.
- Hebda, R. J. 1983. Late-glacial and postglacial vegetation history at Bear Cove Bog, northeast Vancouver Island, British Columbia. Canadian Journal of Botany 61:3172–92. doi:https://doi.org/10.1139/b83-355.
- Heusser, C. J., L. E. Heusser, and D. M. Peteet. 1985. Late-Quaternary climatic change on the American North Pacific coast. Nature 315:485–87. doi:https://doi.org/10.1038/315485a0.
- Hogg, A., J. Southon, C. Turney, J. Palmer, C. B. Ramsey, P. Fenwick, G. Boswijk, M. Friedrich, G. Helle, K. Hughen, et al. 2016. Punctuated shutdown of Atlantic meridional overturning circulation during Greenland Stadial 1. Scientific Reports 6. doi:https://doi.org/10.1038/srep25902.
- Isarin, R. F., and H. Renssen. 1999. Reconstructing and modelling Late Weichselian climates: The Younger Dryas in Europe as a case study. Earth-Science Reviews 48:1–38. doi:https://doi.org/10.1016/S0012-8252(99)00047-1.
- Kaufman, D. S., R. S. Anderson, F. S. Hu, E. Berg, and A. Werner. 2010. Evidence for a variable and wet Younger Dryas in southern Alaska. Quaternary Science Reviews 29:1445–52. doi:https://doi.org/10.1016/j.quascirev.2010.02.025.
- Kokorowski, H. D., P. M. Anderson, C. J. Mock, and A. V. Lozhkin. 2008. A re-evaluation and spatial analysis of evidence for a Younger Dryas climatic reversal in Beringia. Quaternary Science Reviews 27:1710–22. doi:https://doi.org/10.1016/j.quascirev.2008.06.010.
- Lacourse, T., J. M. Delepine, E. H. Hoffman, and R. W. Mathewes. 2012. A 14,000 year vegetation history of a hypermaritime island on the outer Pacific coast of Canada based on fossil pollen, spores and conifer stomata. Quaternary Research 78:572–82. doi:https://doi.org/10.1016/j.yqres.2012.08.008.
- Lacourse, T., R. W. Mathewes, and D. W. Fedje. 2005. Late-glacial vegetation dynamics of the Queen Charlotte Islands and adjacent continental shelf, British Columbia, Canada. Palaeogeography, Palaeoclimatology, Palaeoecology 226:36–57. doi:https://doi.org/10.1016/j.palaeo.2005.05.003.
- Lusas, A. R., B. L. Hall, T. V. Lowell, M. A. Kelly, O. Bennike, L. B. Levy, and W. Honsaker. 2017. Holocene climate and environmental history of East Greenland inferred from lake sediments. Journal of Paleolimnology 57:321–41. doi:https://doi.org/10.1007/s10933-017-9951-5.
- Mathewes, R. W., L. E. Heusser, and R. T. Patterson. 1993. Evidence for a Younger Dryas-like cooling event on the British Columbia coast. Geology 21:101–04. doi:https://doi.org/10.1130/0091-7613(1993)021<0101:EFAYDL>2.3.CO;2.
- May, L., and T. Lacourse. 2012. Morphological differentiation of Alnus (alder) pollen from western North America. Review of Palaeobotany and Palynology 180:15–24. doi:https://doi.org/10.1016/j.revpalbo.2012.04.007.
- Meyers, P. A., and R. Ishiwatari. 1993. Lacustrine organic geochemistry—an overview of indicators of organic matter sources and diagenesis in lake sediments. Organic Geochemistry 20:867–900. doi:https://doi.org/10.1016/0146-6380(93)90100-P.
- Mikolajewicz, U., T. J. Crowley, A. Schiller, and R. Voss. 1997. Modelling teleconnections between the North Atlantic and North Pacific during the Younger Dryas. Nature 387:384–87. doi:https://doi.org/10.1038/387384a0.
- Minore, D. 1979. Comparative autecological characteristics of northwestern tree species—a literature review. General Technical Report PNW-GTR-087, US Department of Agriculture, Forest Service, Pacific Northwest Research Station: 172, 87, Portland, OR.
- Okumura, Y. M., C. Deser, A. Hu, A. Timmermann, and S. P. Xie. 2009. North Pacific climate response to freshwater forcing in the subarctic North Atlantic: Oceanic and atmospheric pathways. Journal of Climate 22:1424–45. doi:https://doi.org/10.1175/2008JCLI2511.1.
- Pawuk, W. H., and E. J. Kissinger. 1989. Preliminary plant association classification of the Stikine Area, Tongass National Forest. U.S. Dept. of Agriculture Forest Service Report R10-TP-72. Juneau, Alaska: U.S. Dept. of Agriculture Forest Service.
- Peteet, D. M. 1986. Modern pollen rain and vegetational history of the Malaspina Glacier District, Alaska. Quaternary Research 25:100–20. doi:https://doi.org/10.1016/0033-5894(86)90047-5.
- Peteet, D. M., and D. H. Mann. 1994. Late-glacial vegetational, tephra, and climatic history on southwestern Kodiak Island, Alaska. Ecoscience 1:255–67. doi:https://doi.org/10.1080/11956860.1994.11682250.
- Peteet, D. M., J. E. Nichols, C. M. Moy, A. McGeachy, and M. Perez. 2016. Recent and Holocene climate change controls on vegetation and carbon accumulation in Alaskan coastal muskegs. Quaternary Science Reviews 131:168–78. doi:https://doi.org/10.1016/j.quascirev.2015.10.032.
- Praetorius, S. K., A. Condron, A. C. Mix, M. H. Walczak, J. L. McKay, and J. Du. 2020. The role of Northeast Pacific meltwater events in deglacial climate change. Science Advances 6 (9):eaay2915. doi:https://doi.org/10.1126/sciadv.aay2915.
- Rasmussen, S. O., K. K. Andersen, A. M. Svensson, J. P. Steffensen, B. M. Vinther, H. B. Clausen, M. L. Siggaard‐Andersen, S. J. Johnsen, L. B. Larsen, D. Dahl‐Jensen, et al. 2006. A new Greenland ice core chronology for the last glacial termination. Journal of Geophysical Research: Atmospheres 111 (D6). doi:https://doi.org/10.1029/2005JD006079.
- Reimer, P. J., E. Bard, A. Bayliss, J. W. Beck, P. G. Blackwell, C. B. Ramsey, C. E. Buck, H. Cheng, R. L. Edwards, M. Friedrich, et al. 2013. IntCal13 and Marine13 radiocarbon age calibration curves 0–50,000 years cal BP. Radiocarbon 55 (4):1869–87. doi:https://doi.org/10.2458/azu_js_rc.55.16947.
- Renssen, H., A. Mairesse, H. Goosse, P. Mathiot, O. Heiri, D. M. Roche, K. H. Nisancioglu, and P. J. Valdes. 2015. Multiple causes of the Younger Dryas cold period. Nature Geoscience 8:946. doi:https://doi.org/10.1038/ngeo2557.
- Shakun, J. D., and A. E. Carlson. 2010. A global perspective on Last Glacial Maximum to Holocene climate change. Quaternary Science Reviews 29:1801–16. doi:https://doi.org/10.1016/j.quascirev.2010.03.016.
- Traverse, A. T. 1988. Paleopalynology. Boston: Unwin Hyman.
- Vacco, D. A., P. U. Clark, A. C. Mix, H. Cheng, and R. L. Edwards. 2005. A speleothem record of younger Dryas cooling, Klamath Mountains, Oregon, USA. Quaternary Research 64:249–56. doi:https://doi.org/10.1016/j.yqres.2005.06.008.
- Viereck, L. A., C. T. Dyrness, A. R. Batten, and K. J. Wenzlick. 1992. The Alaska vegetation classification. General Technical Report PNW-GTR-286, U.S. Department of Agriculture, Forest Service, Pacific Northwest Research Station, Portland, OR.
- Viereck, L. A., and E. L. Little. 2007. Alaska trees and shrubs. Fairbanks: University of Alaska Press.
- Western Regional Climate Center. 2017. Craig Alaska climate summary. Accessed March 4, 2016, http://www.wrcc.dri.edu/cgi-bin/cliMAIN.pl?ak2227.
- Wilcox, P. S. 2017. 60,000 year climate and vegetation history of southeast Alaska Ph.D. thesis, University of Alaska, Fairbanks.
- Wilcox, P. S., J. Addison, S. J. Fowell, J. F. Baichtal, K. Severin, and D. H. Mann. 2019a. A new set of basaltic tephras from Southeast Alaska represent key stratigraphic markers for the late Pleistocene. Quaternary Research 92 (1):246–256. doi:https://doi.org/10.1017/qua.2018.154.
- Wilcox, P. S., J. A. Dorale, J. F. Baichtal, C. Spötl, S. J. Fowell, L. R. Edwards, and J. L. Kovarik. 2019b. Millennial-scale glacial climate variability in Southeastern Alaska follows Dansgaard-Oeschger cyclicity. Scientific Reports 9 (1):1–8. doi:https://doi.org/10.1038/s41598-019-44231-1.
- Young, N. E., J. P. Briner, J. Schaefer, S. Zimmerman, and R. C. Finkel. 2019. Early Younger Dryas glacier culmination in southern Alaska: Implications for North Atlantic climate change during the last deglaciation. Geology 47:550–54. doi:https://doi.org/10.1130/G46058.1.