
ABSTRACT
A multiyear study of forest-to-alpine ecotones across extensive krummholz zones in whitebark pine (WBP; Pinus albicaulis), Sierra Nevada, California, resolved mean treeline growing season temperature (GST) of 9.3°C, 2.6°C warmer than global thresholds previously described, and mean growing season length of 143 days. Temperatures declined with increasing elevation; GST at the upper krummholz line (8.9°C), however, was 2.2°C warmer than the mean global treeline threshold, suggesting that by thermal criteria these environments should support tree growth. Possible explanations for the warm conditions and persistence of krummholz rather than treeline advance include a role for moisture limitations, disequilibrium with Little Ice Age temperatures, and the influence of krummholz as a buffer to treeline dynamics. Radial growth in treeline WBP trees was negatively correlated with maximum annual temperature and positively correlated to water year precipitation. Krummholz stems had low correlations to one another, to treeline trees, and to climate, suggesting nonclimatic controls on growth. These findings underscore the variable nature of treeline response to climate change, suggest that krummholz ecotones behave differently from diffuse treelines, and add to examples of mountain conifers that may be exhibiting lag effects and have not shifted with contemporary warming.
Introduction
Mountain ecosystems are widely assumed to have characteristic vulnerabilities to changing climates (Beniston Citation2003; IPCC Citation2019). Isotherms are expected to shift up as temperatures rise, with concomitant upward migration of species as they seek favorable climates (Bell, Bradford, and Lauenroth Citation2014). For tree species, the alpine ecotone has long been recognized as responsive to climate, although controls are complex and continue to elude comprehensive understanding (Malanson et al. Citation2011, Citation2019; Camarero et al. Citation2017). The nature of treeline response has been informed by global studies that elucidated factors consistently correlating with limits of upper elevation tree growth (Körner and Paulsen Citation2004; Paulsen and Körner Citation2014). Körner and colleagues emphasized the role of upright tree stature at treeline for its coupling of the crown with free-air temperatures. Climatic treeline, where atmospheric conditions enforce the limits of tree occurrence, occurs at the highest extent of groups of trees growing ≥3 m in height and growing season ≥94 days (Körner and Paulsen Citation2004). Under those conditions global treeline coincided with mean growing season temperature (GST) of 6.7°C. Above climatic treeline meteorological conditions change abruptly as a result of upright tree absence. Low-stature vegetation becomes decoupled from regional air temperatures and microclimates increase in importance (Grace Citation1988; Holtmeier Citation2009). Plants in the alpine zone survive harsh conditions through multiple adaptations, with many tree species becoming stunted and shrubby, a form known as krummholz (“crooked wood”). The upper limits of species occurrence defines the upper species line (Körner Citation2012a). For conifers that form krummholz, species line can occur far above climatic treeline.
Although GST has been demonstrated to control many treeline limits, other factors influence treeline dynamics. A global review of 166 treeline sites suggested that diffuse treeline ecotones, where upright trees diminish in size as they approach their high-elevation limit, were most sensitive to GST and responsive to contemporary warming (Harsch et al. Citation2009). For example, undisturbed and diffuse treelines of Scots pine (Pinus sylvestris) showed rapid increase in density and movement upslope during the latter half of the twentieth century in response to summer warming (Kullman Citation2005). Krummholz-type treeline ecotones, by contrast, showed greater stability in the face of warming and appeared to be influenced by winter conditions more than by summer temperature (Harsch et al. Citation2009). Exceptions to these outcomes exist, however; for instance, where diffuse treelines have not shifted for 4,000 years (Millar et al. Citation2019) and where krummholz treeline ecotones did shift in response to summer warming during the late Holocene (LaMarche and Mooney Citation1972; Payette et al. Citation1989). Despite advances in understanding, the mechanisms that regulate specific treelines—particularly the influence of krummholz zones—relative to changing climates remain poorly understood (Körner Citation2012b; Camarero et al. Citation2017).
Stem growth in upper subalpine forest trees influences the response of alpine ecotones to changing climates. Controls on growth are complex and vary by species and location (Cook and Kairukstis Citation1990). For subalpine forests of semi-arid regions such as the American Great Basin, temperature has long been shown to control radial growth near upper treeline (UTL), whereas precipitation determined growth at the lower forest border (LaMarche Citation1974a, Citation1974b; LaMarche and Stockton Citation1974; Hughes and Funkhouser Citation2003). Recent studies, however, have revealed changing interactions of temperature and moisture on growth in trees near treeline that relate to contemporary climates (Salzer et al. Citation2009, Citation2014; Tran et al. Citation2017). In that zone, growth of bristlecone pines (Pinus longaeva) was related to micro-site, with precipitation playing a factor on warmer sites and temperature on cooler sites (Tran et al. Citation2017; Bunn et al. Citation2018). Moisture sensitivity appears to be a new factor affecting growth and potentially heralds changes in response at treeline in other species as well.
How this new pattern might relate to growth above treeline in krummholz has been little addressed. Studies of krummholz have focused on stem layering and genet age (King and Graumlich Citation1998), seedling recruitment (Daniels and Veblen Citation2004; Hofgaard, Dalen, and Hytteborn Citation2009; Schwab et al. Citation2016), and environmental controls of crown form, in particular the role of winter snowpack, wind abrasion, and low temperatures in flag release, survival, and mortality (e.g., Hadley and Smith Citation1987; Weisberg and Baker Citation1995; Smith et al. Citation2003; Millar et al. Citation2004; Devi et al. Citation2008; Maher, Nelson, and Larson Citation2020). Improved understanding of the influence of climate on stem growth in krummholz forms and its relation to upper subalpine forest growth could contribute to systematic understanding of treeline ecotone dynamics.
We sought to address specific uncertainties in response of treeline and in the krummholz zone with an integrated study of temperature and growth relationships in a representative North American treeline species, whitebark pine (WBP; Pinus albicaulis). WBP extends widely across western North American mountain ranges (Critchfield and Little Citation1966), where it is an important member of subalpine forest communities and commonly forms UTL. WBP has ready capacity to adopt stunted forms, but the expression of krummholz on the landscape varies geographically. In most parts of the species range the zone is narrow, occurring as a fringe above UTL or with scattered krummholz islands above treeline (Arno Citation1989). Throughout its range, WBP is a keystone ecological species, supporting critical ecosystem functions and serving as important wildlife habitat (Tomback, Arno, and Keane Citation2001). In many parts of its range WBP’s persistence is threatened by nonnative white pine blister rust (Cronartium ribicola), native bark beetles (Dendroctonous ponderosae), and effects of fire suppression (Keane et al. Citation1990). The impacts of combined disturbances on WBP mortality have been severe enough that the species has been designated as a candidate for listing under the Endangered Species Act in the United States and has been listed as endangered in Canada.
WBP is the dominant conifer of subalpine zones in California. We studied WBP treeline and krummholz vegetation in the eastern Sierra Nevada, California, where the species regularly develops broad zones of krummholz. Although little studied anywhere in its range, the WBP krummholz zone can harbor individuals of great age relative to upright trees (King and Graumlich Citation1998) and high genetic diversity (Rogers, Millar, and Westfall Citation1999); provide important wildlife habitat (Millar and Rundel Citation2016), snow retention, and watershed protection (Daly Citation1984); and serve as refugium in its apparent resistance to mountain pine beetle mortality (Maher Citation2018). Our study addressed the following questions:
What thermal conditions define the WBP forest-to-alpine ecotone in California, from treeline to upper krummholz (species) line (UKL)?
Does a consistent thermal threshold characterize UKL, and how does this differ from treeline temperatures?
How do treeline GSTs in WBP forests adjacent to extensive krummholz vegetation compare to global averages?
What relationships of radial growth to climate occur in krummholz WBP?
How do these compare to growth and climate relations of WBP upright tree growth at treeline?
Methods
Study area and field methods
We selected four sites along the eastern escarpment of the central Sierra Nevada, California (). These comprised two pairs of northern and southern aspect slopes, one at Tioga Peak/Tioga Crest and the other at Dunderberg Peak/Virginia Canyon. WBP dominated the upper subalpine forest and krummholz zone at all locations, although occasional lodgepole pines (Pinus contorta) co-occurred. In this region, krummholz hedges and matts extended across as much as 400 m altitude, from ~3,100 m at UTL to ~3,500 m, where it formed upper species line. Study transects at each site extended from UTL into the alpine zone, with elevations varying by site, aspect, and sampling type (, ). All sites were underlain by metamorphic substrates.
Table 1. Study sites, transects, and plot locations for tree-ring and temperature measurements. UTL and the tree core plots lower are upright trees; the remaining plots are krummholz
Figure 1. Map of the study region in the eastern Sierra Nevada, California, with location of four transect sites. See for site names
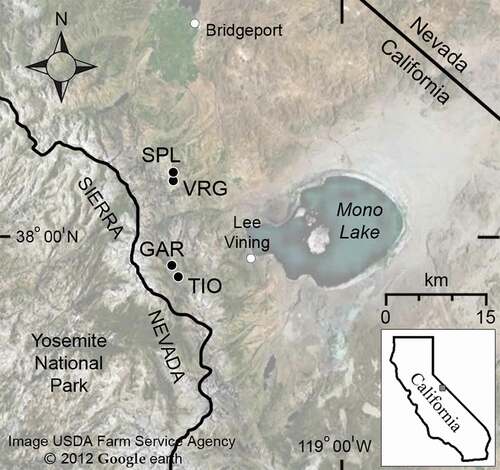
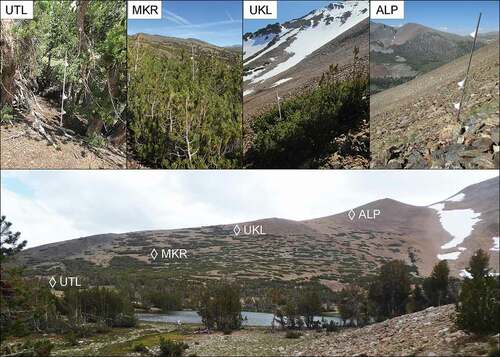
Figure 2. Transect design. Transects extended from UTL to ALP, with intermediate plots at MKR and UK (upper species line). Two pairs of transects were installed on adjacent northern and southern aspects for a total of four transects
Temperature measurements
To assess thermal conditions, four plots were established along each transect, situated at consistent ecological positions (, ). These were chosen by field examination of vegetation and stand structure and included: UTL (conditions per Körner [Citation2012a] and as described earlier), middle of the krummholz zone (MKR), UKL (upper species line, conditions per Körner Citation2012a), and the alpine zone above the upper species line (ALP). The MKR plot was located midway between the elevations of UTL and UKL, which varied by site; the ALP plot was situated above UKL by the same elevation interval (half the number of meters between UTL and UKL). Ground lengths of transects (UTL to ALP) ranged from 378 to 1,023 m ().
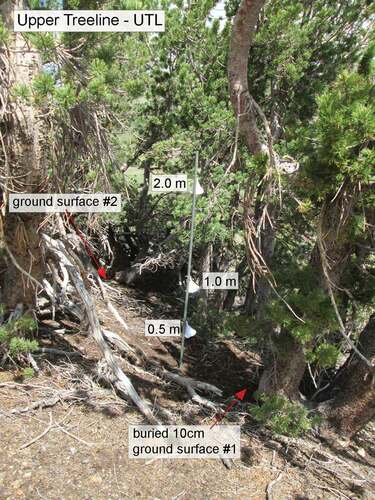
At each plot, a single 3-m PVC pole (“thermopole”) was anchored upright such that it extended at least 2 m above the ground. The bases of all but the ALP pole were in shade of forest or krummholz canopies, with the krummholz bases in deepest shade. Six temperature dataloggers (Maxim iButtons, models DS1921G and DS1922L) were deployed at each plot (). The positions for the dataloggers were chosen to investigate different questions. Three units were wired onto the thermopole, at 2.0 m, 1.0 m, and 0.5 m height—these monitored air temperatures at different heights within the forest or krummholz canopy or, at the ALP plots, open conditions, including standard free-air temperature (2.0 m). A fourth iButton was buried 10 cm below the ground surface near the base of the pole, which is a proxy for 2.0 m surface air temperature daily means at the expected range of treeline summer temperatures (Körner and Paulsen Citation2004). Two iButtons were deployed on the ground surface, one at the pole and another in an opening within approximately 5 m of the pole; these were intended as indicators of snow cover duration. During the first 2.5 years we used 17-cm white PVC funnels as radiation shields for the pole units, securing the iButtons inside 8-cm white PVC “T” tubes and these within funnels. Because funnels broke off during the 2017 severe winter, we subsequently used T tubes alone, a design we have used in prior studies, and the protection we used for the ground and buried units from the start.
Figure 3. Plot design. At each plot, six temperature loggers were deployed: three on a PVC pole, at 2.0 m, 1.0 m, and 0.5 m height; one buried 10 cm at the base of the pole; and two ground surface loggers, one at the base of the pole and one approximately 5 m distant
IButtons were programmed for 4-hour intervals, starting at noon on the day of deployment. Dataloggers were installed between 7 June and 7 July 2015. All units were exchanged at least once annually, attempting to maintain continuous measurement, and uninstalled in October 2019.
Growth measurements
To assess radial growth in trees near UTL and in the krummholz zone we used the same four transects as in the thermal studies, adding plots to obtain approximately 30 to 35 m elevation intervals (following Salzer et al. Citation2014). Because the elevation extent of each transect differed, so did the number of coring plots at each site (). We labeled the uppermost location sampled as the “0 plot,” which coincided with the UKL thermopole plot. Tree ring plots downhill were labeled 100, 200, etc., and adjusted slightly so that a plot fell near the MKR and UTL thermopole plots. A final coring plot was approximately 25 to 30 m below UTL and represented typical upper-subalpine WBP forest conditions. Total number of tree ring plots per transect varied from four to eight ().
In July 2016 plots were selected in the field by designating the plot center as the location where our Global Positioning System device first registered the predetermined elevation for the plot within the transect. Initially we attempted to select sample stems randomly starting with the nearest stem to the plot center in the north direction and moving clockwise around the center to reach the desired sample number (sixteen). We maintained at least 5 m between sample stems to avoid coring multiple stems of tree clusters. Beyond that we choose stems for coring without regard to diameter except that stems for coring were ≥10 cm at coring height. When a tree did not yield an adequate core, we moved to the next stem. Radial cores were retrieved from sample pines with standard increment borers, including the pith as possible. At the UTL plot and the plot below UTL, cores were taken from upright tree stems at approximately 0.5 m height from the ground. In the krummholz zone, cores were extracted as near to the base of the central stem as possible. Often it was impossible to identify or access the base and/or to core in the dense krummholz canopy. In those cases cores were taken either from near-basal branches or along the stem within 2 m of the krummholz base.
Laboratory and statistical analyses
Temperature evaluations
Temperature data were downloaded from iButtons after retrieval from the field. After final retrieval in 2019, data were concatenated chronologically by site, transect, plot, and position for the extent of the study. Occasional gaps occurred due to device failures and loss or displacement of units. When this occurred, values were imputed using training data from the entire period of record for datalogger positions at that plot, estimated by the JMP Bayesian imputation procedure (JMP 12.2; SAS Citation2015). Approximately 8 percent of the entire data set was imputed.
Temperature data were summarized for the following indicators: annual mean daily temperature (Tann); annual minimum mean daily temperature (Tann-min); annual maximum mean daily temperature (Tann-max); mean GST; mean growing season length (GSL), mean temperature of the warmest month (Twarm); mean number of snow-free days (DSF). GSL was calculated following Körner and Paulsen (Citation2004): For the 10 cm buried position, the first day of the growing season was the spring date when the unit first exceeded 3.2°C (coinciding with weekly mean free-air temperature of 0°C) and the last day was the autumn date when the buried unit first reached 3.2°C; GSL was the number of days between these dates. GST was the mean of daily temperatures during the growing season as defined. For the 2.0 m air temperature estimates, GST was estimated following Paulsen and Körner (Citation2014), using 0.9°C as the threshold for growing season. DSF was calculated by water year (WY) from the number of winter days for which the daily range of dataloggers was greater than 1.0°C (i.e., not snow covered; Lundquist and Lott Citation2008). To assess consistent temperature differences between the 2.0 m pole and 10-cm buried positions, we applied the matched pairs test in JMP (SAS Citation2015) based on mean daily temperatures.
Radial growth and climate analyses
Air-dried increment cores from the field were prepared for ring-width measurement, dating, and analysis using standard tree ring techniques (Holmes, Adams, and Fritts Citation1986; Cook and Kairukstis Citation1990). Cross-dating and quality control assessments were done using COFECHA (Holmes, Adams, and Fritts Citation1986; Krusic Citation2012). The chronology was built first by using series of well-correlated mature upright trees from the upper subalpine forest sites and adding the more recalcitrant krummholz series as the chronology became robust with samples. We used all intact cores to estimate tree and krummholz ages; for series that did not cross-date to the master chronology, we estimated tree age by counting rings (all trees were alive at the time of collection). We thus had two data set categories, one that composed the master chronologies (for growth correlations and climate analysis) and one for demography. In developing the master chronologies, we included series that had correlations ≥0.4. For both data sets, we grouped the samples into three sets: treeline (; tree core plots at UTL and below), middle krummholz (plots at UTL to MKR), and upper krummholz (plots at MKR to UKL).
For master chronologies, we imported raw ring widths into ARSTAN 44hc (Cook and Krusic Citation2016) for detrending and standardization of ring widths by biweight robust averaging to remove exogenous factors such as density and to maximize correlations with climate (Cook and Kairukstis Citation1990). Although the RCS (regional curve standardization) detrending algorithm (Esper, Cook, and Schweingruber Citation2002) is generally not used for short series, we used the method because it revealed low-frequency trends, showed increasing growth trends, and improved synchrony among the krummholz and tree sets. Data were detrended by a spline curve at 66 percent n (the period of record) at 50 percent cutoff. We also stabilized variance at 90 percent n with a 50 percent cutoff. Chronologies were developed for the three elevation groups at each of the four transect locations.
For assessment of radial growth with twentieth to twenty-first century climate, instrumental climate records were compiled from four Historical Climate Network (HCN) weather stations that we have used in past studies in the region: Lake Tahoe, Yosemite, and Independence, California, and Mina, Nevada (NCDC Citation2020). Following the approach of Millar et al. (Citation2012), we statistically combined data from the individual stations into composite records (1899–2018), taking the first principal component for mean monthly minimum and maximum temperature, respectively, and annual WY precipitation. To test relationships of climate and ecological responses, we analyzed simple linear correlations by cross-correlations in the time series platform in JMP (SAS Citation2015). For the latter, we conducted a second-order least squares response surface model (JMP; SAS Citation2015) of standardized ring widths versus minimum and maximum annual temperature, respectively, and WY precipitation. We evaluated the behavior of these variables in second-order response surface models of the form (x + y + …) + (x + y + …)2, where redundant interaction terms were omitted. Interactions in the surface model tested heterogeneity of slopes between the effects. Lead year cross-correlations were assessed in the time series analysis platform in JMP (SAS Citation2015). Two-year lead effect minimum and maximum temperatures and WY precipitation were the final variables used in the model.
Results
Temperature
Despite gaps in the record, mostly filled by imputation, temperature data were retrieved from all sites and plots for the 4.5 years of study, extending from early summer 2015 to autumn 2019 (, ). At UTL mean annual temperature was 3.0°C for 2.0 m (standard air temperature) and 3.6°C for 10 cm buried, with intermediate values at the 1.0 m and 0.5 m positions. Treeline growing season values were estimated from loggers at UTL plots at 2.0 m and 10 cm buried positions. These indicated mean GST 9.4°C across years and transects at 2.0 m, with mean GSL of 148 days and mean GST of 9.2°C with GSL of 128 days for the buried position. The longest snowfree duration occurred at 2.0 m (mean, 274 days) and shortest at the buried position (mean, 198 days; flat lines in ). High WY precipitation in 2017 resulted in lowest DSF for many transects, but despite variable precipitation in other years, DSF was not greatly affected.
Table 2. Temperature and growing season means based on daily means. Annual temperature (Tann); minimum (Tann-min) and maximum (Tann-max) annual temperature; GST; GSL; warmest month temperature (Twarm); number of DSF
Figure 4. Overlay plots for mean 2.0 m air temperature and mean 10 cm buried temperature, July 2015 to October 2019 for paired TIO (north) and GAR (south) transect sites, upper treeline and upper species line. (a) UTL at TIO; (b) UKL at TIO; (c) UTL at GAR; (d) UKL at GAR
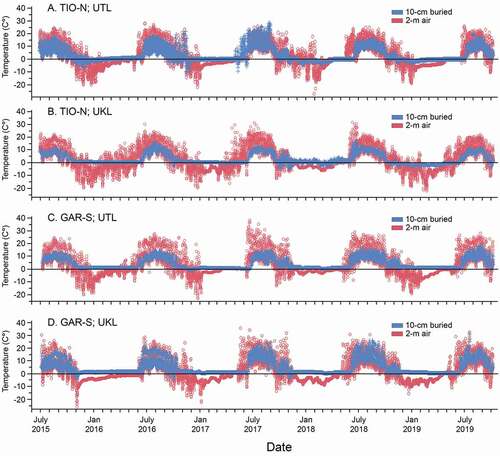
Comparing UTL conditions to UKL across years and transects indicated cooler mean annual temperatures at UKL, measured at 2.0 m as 2.2°C but not different at 10 cm buried (). Differences in air temperatures (0.8°C) and mean elevation (283 m) between UTL and UKL give a lapse rate of −2.8°C/1,000 m. The UKL loggers indicated cooler growing season thresholds at UKL than UTL. Mean GST estimated at 2.0 m was 8.6°C (difference of 0.8°C from UTL) with GSL of 168 days; at 10 cm buried GST was 9.1°C (difference of 0.1°C) with GSL of 123 days. At UKL, DSF for 2.0 m was longer than UTL (307 days), whereas for 10 cm buried DSF was shorter at UKL (164 days) than at UTL.
Above treeline, the ALP plots indicated strongest differences between buried and air temperatures of all elevations (). Mean annual temperatures were colder than other elevations for 2.0 m air temperature (1.6°C), whereas the buried position mean was warmest (3.7°C). The 2.0 m position had cooler mean GST (8.5°C) than other elevations, although the GSL (149 days) was not different from UTL. By contrast, mean GST for the 10 cm buried position was much warmer than other elevations (11.0°C), with shorter GSL (123 days). Snow cover differed between positions, with DSF estimated as 315 for 2.0 m vs. 195 days for the buried position.
Annual minimum mean daily air temperatures over years and transects at the 2.0 m position generally followed expected elevation patterns along transects, from warmest (low) to coolest (high): −17°C (UTL), −18°C (MKR), −20°C (UKL), and −19°C (ALP; ). Corresponding values for annual maximum mean daily temperatures similarly followed the elevation gradient: 22°C (UTL), 19°C (MKR), 18°C (UKL), and 17°C (ALP). The warmest month mean temperatures for the 2.0 m position were 13.1°C (UTL), 13.1°C (MKR), 12.7°C (UKL), and 11.9°C (ALP). These differences translate to mean lapse rates of −1.2°C/1,000 m for warmest month, −8.3°C/1,000 m for Tann-min, and −5.6°C/1,000 m for Tann-max.
Aspect differences in temperature followed expectations in mean annual air temperature for the SPL (Silverpine Lake)/VRG (Virginia Canyon) pair, with northern aspects colder than southern in all cases (). For the other pair (TIO (Tioga Peak)/GAR(Tioga Crest)) and for other annual means, aspect differences were inconsistent. Snow persisted longer on northern aspects (156 DSF) than southern (224 DSF), creating mostly consistent differences between aspects. In WY 2017 and 2019, northern aspects had fewer DSF than other years, whereas southern aspects generally showed little relationship between DSF and WY. Overall, northern aspects had significantly lower DSF than southern aspects, with the VRG transect particularly dry (p < .05). For the important GST and GSL estimates, differences were apparent between aspects but inconsistent in some variables (). At UTL, differences in GST were small (range = 0°C–0.4°C) at 2.0 m with no aspect effect but larger for the buried estimate (range = 0.5°C–3.1°C), with northern aspects unexpectedly warmer than southern. Mean GSLs showed large differences, with northern aspects shorter (GSL 137 days) and southern aspects longer (159 days).
Inconsistent aspect patterns occurred at UKL (). Annual mean temperatures between aspects were identical for one pair of sites; for the other (TIO/GAR), the southern aspect was 0.6°C cooler. Mean daily minimum and maximum annual temperatures did not show an aspect effect. Threshold GSTs measured at 2.0 m were warmer on the northern aspects by 0.3°C to 1.0°C relative to their paired southern sites. GSL was shorter by fifty-eight days on one northern aspect relative to the southern but basically the same number of days for the other north–south pair. At the 10-cm buried positions, GST was warmer by 1.7°C on the northern aspect than on the southern aspect in one pair of transects and cooler by 0.2°C in the other. GSL at the buried positions was shorter on northern aspects than on southern aspects by twelve to forty-five days.
Radial growth
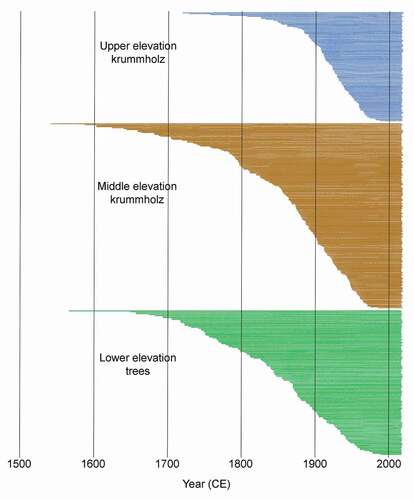
A total of 456 increment cores composed the demography data set (, ). Overall the trees were relatively young, and series ranged in age (estimated from ring number) from 28 to 475 years, with a mean of 146 years. Pooled by elevation and crown form strata, stems in the upper elevation krummholz zone were youngest (mean 99.6 years), and stems in the middle elevation krummholz and the lower elevation forest zones were older and similar in mean age (158.2 and 166.5 years, respectively) although the forest zone had more older trees than the middle krummholz.
Table 3. Mean number of rings (estimate of age) and number of series (cores) contributing to tree-ring demography database for krummholz and tree plots
Figure 5. Tree ring series, demography data set. Dated series from 456 live krummholz and upright trees sampled along four transects. Series pooled and arranged by upper elevation krummholz, middle elevation krummholz, and lower elevation (upper treeline) forest strata. All stems were live at the time of sampling
Ring-width behavior differed between the set of krummholz stems and that of forest trees. In general, trees had ring characteristics that are typical of WBP in Sierra Nevada environments (King and Graumlich Citation1998; Millar et al. Citation2012). That is, the ring series were relatively complacent, and generally fast growing with occasional periods of narrow rings. Filtering the master chronology to series with correlation ≥0.4 resulted in retaining 50 percent of the total number of tree series. The inability of 50 percent of the series to correlate at higher value was somewhat surprising, in that the cores were good quality and series excluded from the master chronology were not removed due to problems such as rot, knots, or poor cores. Nonetheless, based on our prior work with WBP dendrochronology, this was not unusual.
What was unusual in our experience was the far lower correlation of krummholz series to each other and to the master chronology, as estimated in COFECHA. These cores also were high quality, mostly fast growing, and free of damage that would prevent accurate dating. In some cases, series had intervals of extremely narrow rings; mostly these were asynchronous across the krummholz set (as frost rings might be), although neighboring stems within a plot occasionally exhibited coincident behavior. As a result, far fewer krummholz than tree series correlated with its master chronology, with only 19 percent of the total krummholz series correlated ≥0.4. No obvious differences in aspect characterized the ability to correlate the series, nor did age affect dating of one set versus the other.
The master chronology comprised 136 series. Detrending by the RCS method indicated synchronies in growth over the last 120 years among the krummholz and tree groups (). Large declines in growth occurred during 1920–1935; growth was greatest in the 1940s. The crown form groups showed simultaneous growth declines during 2000–2010, with increases in growth in the past decade, although the tree group showed a plateau and decline in growth in the last few years. A positive centennial trend in growth was present for both sets of krummholz stems but not for the trees.
Figure 6. (a)–(c) Whitebark pine radial growth and (d)–(f) composite HCN climate station means (monthly means, averaged annually, 1895–2020). Climate data averaged for Tahoe, Yosemite, Mina, and Independence HCN stations. Black dots, ring widths; red line, mean ring widths; green line, linear fit; blue curve, spline fit at lambda 10
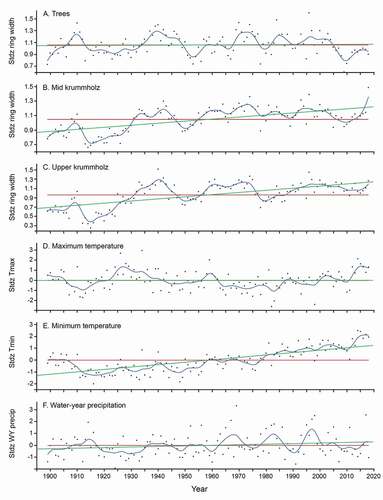
Model correlations for climate variables in the regression analyses for ring width () indicate that trees responded significantly if weakly to maximum temperature (negative correlation, p < .05) and WY precipitation (positive, p < .05). By contrast, the krummholz groups (the small set that correlated with the master chronology) had different and stronger correlations with climate, responding positively to increases in minimum temperature (p < .0001). Over the past 120 years, maximum temperature and WY precipitation () showed variability but no strong century trends. Increases in temperature in recent years correlated with declines in tree growth. The strong positive centennial increase in minimum temperature () correlated with increased growth in krummholz. Aspect differences in correlations further distinguished krummholz from tree groups, with trees having the stronger aspect effect (), although overall trees were more complacent with regard to climate (). Interestingly, series from the uppermost north-facing plots had a stronger relationship with WY precipitation than those on south-facing slopes.
Table 4. Model correlations and climate variables included in the best-fit stepwise regression analyses for radial ring-width models, based on the date range 1895–2020.a
Discussion
Potential biases in data
We report the first investigation of thermal relationships of WBP at treeline and within the WBP krummholz zone and, to our knowledge, the first study of threshold GSTs and lengths in krummholz zones for any conifer species. In that we sought to evaluate differences for krummholz vs. forest trees within our study area and to compare with treeline results from studies elsewhere, it is important that we review potential biases. Temperature is difficult to measure accurately under field conditions, in particular to protect loggers from direct sun effects. Our air units (loggers on poles), although protected by white PVC containers, potentially experienced heating in some cases. We summarize our assessments of bias here; more detail is provided in the Supplemental Material.
In the krummholz plots, the 0.5 m and 1.0 m pole units were consistently in deep shade of dense crowns and likely recorded temperatures relatively accurately. All pole positions at UTL plots similarly had dense overstory shade, whereas the krummholz 2.0 m pole positions mostly extended above the krummholz crown and were exposed to direct sunlight. Buried units in all plots except ALP were under deep shade and thus presumably were recording standard air temperatures when snow free with relative accuracy (Körner and Paulsen Citation2004). To assess effects of direct solar exposure on the upper pole units, we compared June to September temperatures between 2.0 m and buried units at UTL and UKL transects and found the pole units to record mostly warmer values (Supplemental Material). The buried units, however, were variously covered by snow during these months, biasing their values toward cooler temperatures. To avoid problems of comparing relative values within our study, we used the approach and results of Strachan and Daly (Citation2017) to provide an external assessment. In that comparison, our 2.0 m pole units gave no evidence for bias either warm or cold (Supplemental Material).
Thermal characteristics of upper treeline and species line; response to climate change
A striking finding in our 4.5-year study was the high GST at treeline (mean 9.3°C), which was 2.6°C higher than the global treeline threshold of 6.7°C calculated by Körner and Paulsen (Citation2004; 10 cm buried estimate) and more than three times beyond their ±0.8°C standard deviation. Considering Körner and Paulsen’s (Citation2004) finding that temperate and Mediterranean treelines have mean GST values higher (7°C–8°C) than other biomes, our GST estimates were warmer even than these. The two California sites (Tioga Pass, Sierra Nevada) used in Körner and Paulsen’s (Citation2004) study, which lie only 7 km from our nearest transect, yielded means warmer than the other Mediterranean locations in their global study. The authors did not include these values in estimating the global means due to what they felt was a bias effect from snowpack, explained below. GST estimates from their Tioga Pass sites were 9.4°C (southern aspect) and 8.0°C (northern aspect), which closely resemble our estimates. Our GSL (143 days), estimated using Körner and Paulsen’s (Citation2004) buried logger method, was longer than their global threshold of 94 days but similar to their global mean GSL of 135 days. A long growing season is expected relative to other parts of the world, given the extended Mediterranean-climate summers in the Sierra Nevada.
Körner and Paulsen (Citation2004) interpreted their exceptionally warm GST and short GSL at Tioga Pass to result from a single anomalous year of measurement. That year (WY 1997) included a very wet winter, with snowpack lasting into summer (DWR Citation2020). When buried dataloggers remain under snow (and thus record temperatures below the growth threshold) in summer, the estimated GST is elevated and GSL biased shorter. The five summers of our study, however, followed winters that spanned the range of California snowpack depths, from very heavy years (WYs 2017 and 2019) to exceptionally low (WY 2015) and low–moderate (WYs 2016 and 2018) years. Pooling data across years as we did should not only avoid effects of a single extreme year but provide more biologically meaningful values than data from any single year.
We had a second method, namely, air temperature, for estimating GST and comparing with the buried loggers. Temperature measured at 10 cm below the soil surface at our latitude is a surrogate for mean daily air temperature (2.0 m) during the growing season (Körner and Paulsen Citation2004). Following Paulsen and Körner’s (Citation2014) methods for air temperature assessment, our GST was again warmer, in this case by 2.9°C, than the global mean for air-estimated GST of 6.4°C (Körner Citation2012a; Paulsen and Körner Citation2014). Combining evidence, we propose that the treeline GST and GSL values estimated in the present study reflect relatively accurate values for the Sierra Nevada, suggest that those in Körner and Paulsen (Citation2004) were also not significantly biased, and argue that Sierra Nevada WBP treeline threshold values differ from other situations. We take up potential reasons for these deviations after further consideration of treeline and krummholz conditions.
To our knowledge there are only two published accounts of treeline growing season thresholds for pines in the Great Basin. Bruening et al. (Citation2017) reported thresholds based on air temperature for Great Basin bristlecone pine and foxtail pine (Pinus balfouriana). Their field methods were similar to ours, although they used loggers hung at 1.0 m in trees and measured temperatures only in one year (2015). Further, before calculating temperature thresholds, including GST (J. Bruening, pers. comm. 21 February 2020), 1.5°C was subtracted from all raw temperature measurements to adjust for disequilibrium of present-day conditions from Little Ice Age (LIA) effects. For Great Basin bristlecone pine in the Snake Range, eastern Nevada, and White Mountains, California, Bruening et al. (Citation2017) reported GST as 7.2°C and 6.3°C, respectively, and for foxtail pine in the southern Sierra Nevada, California, they reported GST as 5.5°C. Realigning their values (adding 1.5°C) to compare with the present study gives respective GSTs of 8.7°C, 7.8°C, and 7.0°C. Though these values are cooler than our estimates for WBP in the Sierra Nevada, they are warmer than the global mean threshold given by Paulsen and Körner (Citation2014). In the Bruening et al. (Citation2017) study, GSL ranged from 147 to 153 days, which is similar to our estimates. The other study of treeline temperatures in the Great Basin investigated a southern aspect limber pine (Pinus flexilis) ecotone in the arid Toquima Range, central Nevada (Millar Citationin press). Treeline attained at 3,311 m and GST estimated from air temperatures (methods as in the present work) across nine years (2009–2018) was 12.2°C with GSL of 106 days. This is 2.8°C warmer than the mean GST for WBP.
Thermal relationships we report for the krummholz zone do not have relevant field comparisons in the published literature but differ from theoretic expectations. The low, shrub-like stature of krummholz is expected to experience different microclimates from conditions of subalpine forest trees, whose crowns are coupled to atmospheric air temperatures (Körner et al. Citation2016). Decoupling in the krummholz vegetation should result in crown and ground surface temperatures warmer than under forest crowns at treeline (Hadley and Smith Citation1987; Grace Citation1988; Körner Citation2007). In our study, however, mean annual temperatures and GST followed patterns expected from atmospheric lapse processes; that is, cooling with increased elevation. We interpret the dense krummholz crowns to provide consistent and effective shading, which resists solar radiation–induced microclimatic variation on the ground and air surface below the crowns. Further, our 2.0 m air temperature measurements, which showed expected elevation-related decreases, do not represent foliar temperature, which likely would be much different (Grace Citation1988). Notably, the GST at upper species line (8.8°C, 0.5°C cooler on average than treeline GST) is also considerably warmer than the range of values given for global treelines (Körner and Paulsen Citation2004), suggesting, at first blush, that current thermal conditions at upper species line in the Sierra Nevada are appropriate to sustain upright tree growth.
We turn to consider potential reasons for these anomalous results; that is, GST warmer than expected at treeline, cooler temperatures (rather than warmer) through the krummholz zone to upper species line, and GST at upper species line apparently warm enough to support trees. Our results are similar to other Sierra Nevada and Great Basin studies that found warm treeline GSTs, as described above. Further, the finding of very warm upper species line GST (11.1°C) for limber pine in the Toquima Range (Millar Citationin press), also higher than global treeline values, corroborates the range of values we estimated. One possibility for these findings follows explanations given by Körner and Paulsen (Citation2004): In general they found that Mediterranean-climate treelines form at consistently warmer GSTs than do those in other biomes. Some treelines in Mediterranean regions, however, were not determined by climate but by taxon-specific factors. In that they found WBP treeline in the Sierra Nevada to occur at an isotherm much warmer than expected (yet similar to our results), unique characteristics related to WBP in the Sierra Nevada might limit the species ability to ascend to higher elevations. In particular, we propose one possibility that WBP treeline in the Sierra Nevada is influenced as much or more by growing season moisture availability than temperature. The limiting role of soil moisture, exacerbated under warming climates, has been demonstrated previously for Great Basin subalpine species in seedling and tree establishment (Millar et al. Citation2015, Citation2018, Citation2019). Further, the positive response of radial growth to increased moisture found in the current study as well as prior Great Basin pine studies (Millar et al. Citation2004, Citation2012, Citation2018, Citation2019; Tran et al. Citation2017; Bunn et al. Citation2018) points to a potential role of precipitation limitation for forests in these long, dry Mediterranean summer climate regions. The role of growing season moisture restrictions was considered but dismissed by Körner and Paulsen (Citation2004) and deserves further attention in these warm, semi-arid treeline regions.
Beyond these considerations, WBP treelines in the Sierra Nevada might be in disequilibrium with current climates and lagging in response to current temperature. The global LIA brought persistent cold and wet conditions to the Great Basin from 1400 CE to 1920 CE, initiating the largest glacial advance in the Sierra Nevada since the late Pleistocene (references in Millar et al. Citation2019). Decreases in summer minimum temperature of 0.2°C to 2°C and increases in winter precipitation of 3 to 26 cm compared to modern times have been interpreted to explain glacial conditions (Bowerman and Clark Citation2011). Summers significantly cooler than present persisted to 1930 CE (Feng and Epstein Citation1994). Five centuries of cold conditions could have depressed tree and species lines or at least enforced severe krummholz conditions. Depression of our GST values by 1.5°C to 2°C would put LIA treeline GST within the range expected for Mediterranean conditions elsewhere in the world. As noted, Bruening et al. (Citation2017) accepted an LIA disequilibrium in their analyses for bristlecone and foxtail pine treelines in the Great Basin, adjusting their observations accordingly. Other studies have interpreted anomalous treeline demography and temperatures to result from lag with contemporary climate and especially disequilibrium as a result of LIA conditions (Payette et al. Citation1989; Rupp, Chapin, and Starfield Citation2001; Harsch et al. Citation2009; Körner Citation2012a; Alexander et al. Citation2018; Smithers et al. Citation2018; Malanson et al. Citation2019).
The possible role of disequilibrium is informed by the age distribution of stems in our plots. Approximately 25 percent of stems in subalpine forest and middle krummholz plots and approximately 75 percent of stems in the highest krummholz plots, established since the end of the LIA (approximately 1920–1930 CE; Feng and Epstein Citation1994; Bowerman and Clark Citation2011), when summer temperatures began to warm consistently. Prior studies have reported the response of Sierran conifers to warming of the past 100 years to be densification of existing subalpine and krummholz communities without treeline advance (Vale and Vale Citation1994; Millar et al. Citation2004; Dolanc, Thorne, and Safford Citation2013). Although large-diameter stems grew in our krummholz zones, their occurrence was rare enough that by chance very old individuals were not included in our plots. By contrast, in a study of long-lived krummholz WBP near our study transects, King and Graumlich (Citation1998) targeted large-diameter stems for dating. They reported stems extending throughout the elevation range of the current krummholz zone as more than 1,000 years old and likely as old as 2,000 years. The occurrence of such individuals points to the ability of krummholz WBP to persist through great climate variability, including not only the cool LIA centuries but the warm, dry centuries of the Medieval Climate Anomaly (Stine Citation1994; Meko et al. Citation2001). The large proportion of young stems at our highest krummholz plots corroborates a hypothesis of infill around preexisting old stems with warming of the past century. The young plants at high elevations could originate not only from seeds of existing old-aged krummholz individuals (Maher Citation2018) but from seeds brought by birds from lower subalpine forest or middle-elevation krummholz stands (Rogers, Millar, and Westfall Citation1996). Because we did not study seedling age or abundance within forest or krummholz plots or above upper species line, we cannot conclude whether recruitment is still ongoing at those elevations. Anecdotal observations, however, as well as prior studies (Vale and Vale Citation1994; Dolanc, Thorne, and Safford Citation2013) have revealed little evidence for seedling recruitment above UKL into the current alpine zone.
A final consideration is that the krummholz WBP zone in the Sierra Nevada acts as a buffer to changing climates, with increases in stem densities during warm climate periods and decreases during cool periods. This follows observations of other krummholz-forming conifers, whose treelines appear relatively unresponsive to climate change (Harsch et al. Citation2009), and points to the influence of tree form on treeline dynamics (Harsch and Bader Citation2011). In addition to a role for growing season moisture limitation, winter conditions might enforce maintenance of the krummholz zone (Holtmeier and Broll Citation2010; Harsch and Bader Citation2011). Winter freezing damage, wind, abrasion, and snow breakage might regulate stem and branch dieback and seedling establishment, as found in other studies with WBP (Daly Citation1984; Millar et al. Citation2004; Maher, Nelson, and Larson Citation2020). Despite relative persistence of krummholz zones, however, there is evidence that this vegetation community does react to climate change over time, at least at its upper and lower borders. LaMarche and Mooney (Citation1972) observed a 100-m shift downward of the UKL during the neoglacial interval (4,000–2,000 years ago) in bristlecone pine in the eastern Great Basin, and Payette et al. (Citation1989) documented shifts up in spruce krummholz in spruce (Picea) in Canada relating to historic climate. Thus, a buffering effect relative to changing plant density might be an early response to climate change.
Radial growth of tree form versus krummholz
Whereas thermal relations in the krummholz zone were similar to those of the treeline forest, with expected elevation-related differences, radial growth differed unexpectedly between the forms. Despite interannual weather variability, ring widths of mature trees near treeline were relatively complacent. Given that the sites were chosen for representation and not for unusual stress, this was not surprising (King and Graumlich Citation1998). A well-correlated chronology could be constructed from the tree series, which showed responsiveness to centennial climate. By contrast, the krummholz series, with very low correlations to each other or to the tree chronology, suggest that something other than regional climate influenced their growth.
One possibility is that elongating branches at the top of krummholz crowns experience and respond to strong microclimatic differences (Hadley and Smith Citation1987; Grace Citation1988; King and Graumlich Citation1998) as trees in different micro-sites near treeline do (Bunn et al. Citation2018). Although we measured air temperatures within and above the krummholz crowns, foliar temperatures are likely very different, with elevated day and depressed night extremes relative to free air (Grace Citation1988; Körner Citation2007), and these would affect radial growth. Another possibility is that the highly compact, dense krummholz crowns, with multiple rooting bases, create strong competition effects on growth of individual stems. If highly local competitive factors dominate over regional or even micro-site climate, then ring widths would not show high correlation to one another or to forest trees.
For the krummholz stems that could be included in the master chronology, their stronger and differing climate correlations from tree stems point to further differences in WBP crown-form growth. Strong correlations to minimum temperature in krummholz, and thus increases in growth as Tmin increased over the past 120 years, conform to expectations about highest elevations being temperature sensitive. That expectation, however, has previously been evaluated for trees near treeline, not krummholz forms. In eastern Sierran WBP, the sensitivity to minimum temperature and precipitation resembles the situation of Great Basin bristlecone pine, where climate correlations near treeline varied by micro-site (Salzer et al. Citation2014; Bunn et al. Citation2018). This is corroborated by the aspect differences in WBP, wherein trees showed low climate sensitivities on northern aspects but strong correlations to minimum temperature and precipitation on southern aspects. By contrast, krummholz had strong correlations to both variables on northern and southern aspects.
Conclusions
A multiyear study of temperature across the extensive treeline–krummholz (shrub) ecotones of WBP in the central-eastern Sierra Nevada, California, indicated treeline GST of 9.3°C, which is 2.6°C warmer than mean global thresholds of Körner and Paulsen (Citation2004) and Paulsen and Körner (Citation2014). Declining temperatures with increasing elevation across the krummholz zone suggested that near-ground and free-air environments in krummholz were not experiencing expected warmer microclimates relative to forest conditions. At the UKL (upper species line), GSTs were 2.4°C warmer than the average global treeline threshold of Paulsen and Körner (Citation2014), suggesting that by thermal criteria these elevations could at present support tree growth. Lack of upright tree establishment above treeline and in the krummholz zone might result from taxon-specific idiosyncrasies of WBP in the Great Basin Mediterranean-climate region, including growing season moisture limitations and winter stresses that enforce krummholz persistence. Disequilibrium with LIA temperatures likely also creates lag in response of treeline to warming temperatures of the last century. Overall, we propose that the krummholz form influences the response of UTL, the density of vegetation in the krummholz zone, and likely movement of upper species line. As a result, the WBP treeline ecotone in the Sierra Nevada appears at present to be relatively stable.
Radial growth in WBP trees and krummholz showed differing responses to climate of the last 120 years. Low correlations of ring widths among krummholz within and across sites suggest that many individuals are responding to nonclimatic conditions and may be more influenced by intraspecies competition and microclimate. Ring-width patterns of upright trees, though having low sensitivity to climate, were in the range expected for WBP. Of the series that did correlate to a climate-sensitive chronology, krummholz growth responded positively to minimum annual temperature, which rose over the last 120 years, whereas tree growth responded negatively to maximum annual temperature and positively to precipitation, neither of which had dominant centennial trends. Though trees near treeline showed microsite differences (by aspect), paralleling recent studies with Great Basin bristlecone pine, krummholz growth was not responsive at this scale.
Results from the present study underscore the variable nature of treeline response to climate change and add to the examples of mountain conifers that may be exhibiting lag effects and have not shifted with contemporary warming. The WBP krummholz zone appears to affect dynamics of treeline ecotones, acting as buffers to treeline movement, increasing in stem density during warming, and responding to different growth cues than upright trees near treeline. If WBP in other locations and/or other krummholz-forming conifers behave in a similar manner, assessment of dynamics under changing climates can be made more accurate by taking into account climate response by these different conifer forms and effects of regional climates.
Supplemental Material
Download Zip (166.4 KB)Acknowledgments
We thank Christian Körner (University of Basel) for discussions over many years and especially for thoughtful and detailed conversations during our data analysis period. Discussions with other colleagues have shaped our thoughts and provided important insights; in particular, we thank Andy Bunn (Western Washington University), Greg Pederson (USGS), Scotty Strachan (University of Nevada, Reno), and Connie Woodhouse (University of Arizona). Chrissy Howell (USDA Forest Service) reviewed the draft manuscript. We thank Lynn Resler (Associate Editor, AAAR) and two anonymous reviewers for constructive review comments.
Disclosure statement
No potential conflict of interest was reported by the authors.
Supplementary material
Supplemental data for this article can be accessed on the publisher’s website.
Additional information
Funding
References
- Alexander, J. M., L. Chalmandrier, J. Lenoir, T. I. Burgess, F. Essl, S. Haider, C. Kueffer, K. McDougall, A. Milbau, M. A. Nuñez, et al. 2018. Lags in the response of mountain plant communities to climate change. Global Change Biology 24:563–79. doi:https://doi.org/10.1111/gcb.13976.
- Arno, S. F. 1989. Silvics of Whitebark Pine (Pinus albicaulis), vol. 253. Fort Collins, CO: US Department of Agriculture, Forest Service, Intermountain Research Station.
- Bell, D. M., J. B. Bradford, and W. K. Lauenroth. 2014. Mountain landscapes offer few opportunities for high-elevation tree species migration. Global Change Biology 20:1441–51. doi:https://doi.org/10.1111/gcb.12504.
- Beniston, M. 2003. Climatic change in mountain regions: A review of possible impacts. Climatic Change 59:5–31. doi:https://doi.org/10.1023/A:1024458411589.
- Bowerman, N. D., and D. H. Clark. 2011. Holocene glaciation of the central Sierra Nevada, California. Quaternary Science Reviews 30:1067–85. doi:https://doi.org/10.1016/j.quascirev.2010.10.014.
- Bruening, J. M., T. J. Tran, A. G. Bunn, S. B. Weiss, and M. W. Salzer. 2017. Fine-scale modeling of bristlecone pine treeline position in the Great Basin, USA. Environmental Research Letters 12:014008. doi:https://doi.org/10.1088/1748-9326/aa5432.
- Bunn, A. G., M. W. Salzer, K. J. Anchukaitis, J. M. Bruening, and M. K. Hughes. 2018. Spatiotemporal variability in the climate growth response of high elevation bristlecone pine in the White Mountains of California. Geophysical Research Letters 45:13–312. doi:https://doi.org/10.1029/2018GL080981.
- Camarero, J. J., J. C. Linares, A. I. Garcıa-Cervigon, E. Batllori, I. Martınez, and E. Gutierrez. 2017. Back to the future: The responses of alpine treelines to climate warming are constrained by the current ecotone structure. Ecosystems 20:683–700. doi:https://doi.org/10.1007/s10021-016-0046-3.
- Cook, E. R., and L. A. Kairukstis, eds. 1990. Methods of Dendrochronology, 394. Dordrecht, Netherlands: Kluwer.
- Cook, E. R., and P. J. Krusic. 2016. Program ARSTAN, v44h3. https://www.ldeo.columbia.edu/tree-ring-laboratory/resources/software.
- Critchfield, W. B., and E. L. Little. 1966. Geographic variation of pines of the world. Washington, DC: Misc. Pub 991, USDA Forest Service.
- Daly, C. 1984. Snow distribution patterns in the alpine krummholz zone. Progress in Physical Geography 8:157–75. doi:https://doi.org/10.1177/030913338400800201.
- Daniels, L. D., and T. T. Veblen. 2004. Spatiotemporal influences of climate on altitudinal treeline in northern Patagonia. Ecology 85:1284–96. doi:https://doi.org/10.1890/03-0092.
- Devi, N., F. Hagedorn, P. Moiseev, H. Bugmann, S. Shiyatov, V. Mazepa, and A. Rigling. 2008. Expanding forests and changing growth forms of Siberian larch at the Polar Urals treeline during the 20th century. Global Change Biology 14:1581–91. doi:https://doi.org/10.1111/j.1365-2486.2008.01583.x.
- Dolanc, C. R., J. H. Thorne, and H. D. Safford. 2013. Widespread shifts in the demographic structure of subalpine forests in the Sierra Nevada, California, 1934 to 2007. Global Ecology and Biogeography 22:264–76. doi:https://doi.org/10.1111/j.1466-8238.2011.00748.x.
- DWR (Department of Water Resources, State of California). 2020. California data exchange center, snow course data for Tioga Pass Station (“TGP”). Accessed January 5, 2020. http://cdec.water.ca.gov/dynamicapp/snowQuery.
- Esper, J., E. R. Cook, and F. H. Schweingruber. 2002. Low-frequency signals in long tree-ring chronologies for reconstructing past temperature variability. Science 295:2250–53. doi:https://doi.org/10.1126/science.1066208.
- Feng, X., and S. Epstein. 1994. Climatic implications of an 8000-year hydrogen isotope time series from bristlecone pine trees. Science 265:1079–81. doi:https://doi.org/10.1126/science.265.5175.1079.
- Grace, J. 1988. The functional significance of short stature in montane vegetation. Plant form and vegetation structure, 201–09. The Hague: SPB Academic Publishers.
- Hadley, J. L., and W. K. Smith. 1987. Influence of krummholz mat microclimate on needle physiology and survival. Oecologia 73:82–90. doi:https://doi.org/10.1007/BF00376981.
- Harsch, M. A., and M. Y. Bader. 2011. Treeline form—A potential key to understanding treeline dynamics. Global Ecology and Biogeography 20:582–96. doi:https://doi.org/10.1111/j.1466-8238.2010.00622.x.
- Harsch, M. A., P. E. Hulme, M. S. McGlone, and R. P. Duncan. 2009. Are treelines advancing? A global meta-analysis of treeline response to climate warming. Ecology Letters 12:1040–49. doi:https://doi.org/10.1111/j.1461-0248.2009.01355.x.
- Hofgaard, A., L. Dalen, and H. Hytteborn. 2009. Tree recruitment above the treeline and potential for climate-driven treeline change. Journal of Vegetation Science 20:1133–44. doi:https://doi.org/10.1111/j.1654-1103.2009.01114.x.
- Holmes, R. L., R. K. Adams, and H. C. Fritts. 1986. Tree-ring chronologies of western North America: California, Eastern Oregon, and Northern Great Basin with procedures used in the chronology development work including user’s manuals for computer programs COFECHA and ARSTAN. Chronology Series VI. Tucson: Lab of Tree-Ring Research, University of Arizona.
- Holtmeier, F.-K. 2009. Mountain timberlines: Ecology, patchiness, and dynamics, 2nd ed., 437. London: Springer.
- Holtmeier, F.-K., and G. Broll. 2010. Wind as an ecological agent at treelines in North America, the Alps, and the European Subarctic. Physical Geography 31:203–33. doi:https://doi.org/10.2747/0272-3646.31.3.203.
- Hughes, M. K., and G. Funkhouser. 2003. Frequency-dependent climate signal in upper and lower forest border tree rings in the mountains of the Great Basin. Climatic Change 59:233–44. doi:https://doi.org/10.1023/A:1024464909332.
- IPCC (Intergovernmental Panel on Climate Change). 2019. Special Report on the Oceans and Cryosphere in a Changing Climate (SROCC). Chapter 2, High Mountain Areas, 2–1 to 2–94. https://report.ipcc.ch/srocc/.
- Keane, R. E., S. F. Arno, J. K. Brown, and D. F. Tomback. 1990. Modelling stand dynamics in whitebark pine (Pinus albicaulis) forests. Ecological Modelling 51:73–95. doi:https://doi.org/10.1016/0304-3800(90)90059-P.
- King, J. C., and L. J. Graumlich. 1998. Stem-layering and genet longevity in whitebark pine. A final report on cooperative research with the National Park Service, CA 8000-2-9001.
- Körner, C. 2007. Climatic treelines: Conventions, global patterns, causes (Klimatische Baumgrenzen: Konventionen, globale Muster, Ursachen). Erdkunde 61:316–24. doi:https://doi.org/10.3112/erdkunde.2007.04.02.
- Körner, C. 2012a. Alpine treelines: Functional ecology of the global high elevation tree limits, 220. Basel: Springer.
- Körner, C. 2012b. Treelines will be understood once the functional difference between a tree and a shrub is. Ambio 41:197–206. doi:https://doi.org/10.1007/s13280-012-0313-2.
- Körner, C., D. Basler, G. Hoch, C. Kollas, A. Lenz, C. F. Randin, Y. Vitasse, and N. E. Zimmermann. 2016. Where, why and how? Explaining the low‐temperature range limits of temperate tree species. Journal of Ecology 104:1076–88. doi:https://doi.org/10.1111/1365-2745.12574.
- Körner, C., and J. Paulsen. 2004. A world-wide study of high altitude treeline temperatures. Journal of Biogeography 31:713–32. doi:https://doi.org/10.1111/j.1365-2699.2003.01043.x.
- Krusic, P. J. 2012. CofechaOSX_pjk2012, v6.02p. https://www.ldeo.columbia.edu/tree-ring-laboratory/resources/software.
- Kullman, L. 2005. Pine (Pinus sylvestris) treeline dynamics during the past millennium—a population study in west-central Sweden. Annales Botanici Fennici 42:95–106.
- LaMarche, V. C. 1974a. Frequency-dependent relationships between tree-ring series along an ecological gradient and some dendroclimatic implications. Tree-Ring Bulletin 34:1–20.
- LaMarche, V. C. 1974b. Paleo climatic inferences from long tree-ring records intersite comparison shows climatic anomalies that may be linked to features of the general circulation. Science 183:1043–48. doi:https://doi.org/10.1126/science.183.4129.1043.
- LaMarche, V. C., and C. W. Stockton. 1974. Chronologies from temperature-sensitive bristle cone pines at upper treeline in western United States. Tree-Ring Bulletin 34:21–45.
- LaMarche, V. C., Jr., and H. A. Mooney. 1972. Recent climatic change and development of the bristlecone pine (P. longaeva Bailey) krummholz zone, Mt. Washington, Nevada. Arctic and Alpine Research 4:61–72. doi:https://doi.org/10.2307/1550214.
- Lundquist, J. D., and F. Lott. 2008. Using inexpensive temperature sensors to monitor the duration and heterogeneity of snowcovered areas. Water Resources Research 44. doi:https://doi.org/10.1029/2008WR007035.
- Maher, C. T. 2018. Global change and whitebark pine: restoration, refugia, and Alpine treelines. PhD diss., University of Montana.
- Maher, C. T., C. R. Nelson, and A. J. Larson. 2020. Winter damage is more important than summer temperature for maintaining the krummholz growth form above alpine treeline. Journal of Ecology108 (3):1074–87.
- Malanson, G. P., L. M. Resler, D. R. Butler, and D. B. Fagre. 2019. Mountain plant communities: Uncertain sentinels? Progress in Physical Geography: Earth and Environment 43:521–43. doi:https://doi.org/10.1177/0309133319843873.
- Malanson, G. P., L. M. Resler, M. Y. Bader, F. K. Holtmeier, D. R. Butler, D. J. Weiss, L. D. Daniels, and D. B. Fagre. 2011. Mountain treelines: A roadmap for research orientation. Arctic, Antarctic, and Alpine Research 43:167–77. doi:https://doi.org/10.1657/1938-4246-43.2.167.
- Meko, D. M., M. D. Therrell, C. H. Baisan, and M. K. Hughes. 2001. Sacramento River flow reconstructed to AD 869 from tree rings. Journal of the American Water Resources Association 37:1029–40. doi:https://doi.org/10.1111/j.1752-1688.2001.tb05530.x.
- Millar, C. I. in press. Reconstruction of forest and alpine environments over three millennia in the high Toquima Range. Chapter 10. In Alta Toquima: Alpine archaeology and Shoshonean ethnogenesis, ed. D. H. Thomas, Anthropological Papers of the American Museum of Natural History.
- Millar, C. I., D. A. Charlet, D. L. Delany, J. C. King, and R. D. Westfall. 2019. Shifts of demography and growth in limber pine forests of the Great Basin, USA, across 4000 yr of climate variability. Quaternary Research 91:691–704. doi:https://doi.org/10.1017/qua.2018.120.
- Millar, C. I., D. A. Charlet, R. D. Westfall, J. C. King, D. L. Delany, A. L. Flint, and L. E. Flint. 2018. Do low-elevation ravines provide climate refugia for subalpine limber pine (Pinus flexilis) in the Great Basin, USA? Canadian Journal of Forest Research 48:663–71. doi:https://doi.org/10.1139/cjfr-2017-0374.
- Millar, C. I., and P. W. Rundel. 2016. Subalpine forests. Chapter 28. In Ecosystems of California, ed. E. Zavaleta and H. Mooney, 579–611. Berkeley: University of California Press.
- Millar, C. I., R. D. Westfall, D. L. Delany, A. L. Flint, and L. E. Flint. 2015. Recruitment patterns and growth of high-elevation pines in response to climatic variability (1883–2013), in the western Great Basin, USA. Canadian Journal of Forest Research 45:1299–312. doi:https://doi.org/10.1139/cjfr-2015-0025.
- Millar, C. I., R. D. Westfall, D. L. Delany, J. C. King, and L. J. Graumlich. 2004. Response of subalpine conifers in the Sierra Nevada, California, USA, to 20th-century warming and decadal climate variability. Arctic, Antarctic, and Alpine Research 36:181–200. doi:https://doi.org/10.1657/1523-0430(2004)036[0181:ROSCIT]2.0.CO;2.
- Millar, C. I., R. D. Westfall, D. L. Delany, M. J. Bokach, A. L. Flint, and L. E. Flint. 2012. Forest mortality in high-elevation whitebark pine (Pinus albicaulis) forests of eastern California, USA; influence of environmental context, bark beetles, climatic water deficit, and warming. Canadian Journal of Forest Research 42:749–65. doi:https://doi.org/10.1139/x2012-031.
- NCDC (National Climate Data Center). 2020. Accessed January 23, 2020. www.ncdc.noaa.gov/oa/climate/research/ushcn/.
- Paulsen, J., and C. Körner. 2014. A climate-based model to predict potential treeline position around the globe. Alpine Botany 124:1–12. doi:https://doi.org/10.1007/s00035-014-0124-0.
- Payette, S., L. Filion, A. Delwaide, and C. Bégin. 1989. Reconstruction of tree-line vegetation response to long-term climate change. Nature 341:429–32. doi:https://doi.org/10.1038/341429a0.
- Rogers, D. L., C. I. Millar, and R. D. Westfall. 1999. Fine‐scale genetic structure of whitebark pine (Pinus albicaulis): Associations with watershed and growth form. Evolution 53:74–90. doi:https://doi.org/10.1111/j.1558-5646.1999.tb05334.x.
- Rupp, T. S., F. S. Chapin III, and A. M. Starfield. 2001. Modeling the influence of topographic barriers on treeline at the forest-tundra ecotone in Northwestern Alaska. Climatic Change 48:399–416. doi:https://doi.org/10.1023/A:1010738502596.
- Salzer, M. W., E. R. Larson, A. G. Bunn, and M. K. Hughes. 2014. Changing climate response in near-treeline bristle cone pine with elevation and aspect. Environmental Research Letters 9:114007. doi:https://doi.org/10.1088/1748-9326/9/11/114007.
- Salzer, M. W., M. K. Hughes, A. G. Bunn, and K. F. Kipfmueller. 2009. Recent unprecedented tree-ring growth in bristlecone pine at the highest elevations and possible causes. Proceedings of the National Academy of Sciences 106:20,348–20,353. doi:https://doi.org/10.1073/pnas.0903029106.
- SAS (SAS Institute). 2015. SAS Online, Version 12. JMP®Statistics and Graphics Guide. Cary, NC.
- Schwab, N., U. Schickhoff, M. Müller, L. Gerlitz, B. Bürzle, J. Böhner, R. P. Chaudhary, and T. Scholten. 2016. Treeline responsiveness to climate warming: Insights from a krummholz treeline in Rolwaling Himal, Nepal. In Climate change, glacier response, and vegetation dynamics in the Himalaya, ed. R. B. Singh, Udo Schickhoff, and Suraj Mal, 307–45. Cham: Springer.
- Smith, W. K., M. J. Germino, T. E. Hancock, and D. M. Johnson. 2003. Another perspective on altitudinal limits of alpine timberlines. Tree Physiology 23:1101–12. doi:https://doi.org/10.1093/treephys/23.16.1101.
- Smithers, B. V., M. P. North, C. I. Millar, and A. M. Latimer. 2018. Leap frog in slow motion: Divergent responses of tree species and life stages to climatic warming in Great Basin subalpine forests. Global Change Biology 24:e442–e457. doi:https://doi.org/10.1111/gcb.13881.
- Stine, S. 1994. Extreme and persistent drought in California and Patagonia during Medieval time. Nature 369:546–49. doi:https://doi.org/10.1038/369546a0.
- Strachan, S., and C. Daly. 2017. Testing the daily PRISM air temperature model on semiarid mountain slopes. Journal of Geophysical Research: Atmospheres 122:5697–715.
- Tomback, D. F., S. F. Arno, and R. E. Keane, eds. 2001. Whitebark Pine communities: Ecology and restoration. Washington, DC: Island Press.
- Tran, T. J., J. M. Bruening, A. G. Bunn, M. W. Salzer, and S. B. Weiss. 2017. Cluster analysis and topoclimate modeling to examine bristlecone pine tree-ring growth signals in the Great Basin, USA. Environmental Research Letters 12:014007. doi:https://doi.org/10.1088/1748-9326/aa5388.
- Vale, T. R., and G. R. Vale. 1994. Time and the Tuolumne landscape: Continuity and change in the Yosemite high country. Salt Lake City, UT: University of Utah Press.
- Weisberg, P. J., and W. L. Baker. 1995. Spatial variation in tree seedling and krummholz growth in the forest-tundra ecotone of Rocky Mountain National Park, Colorado, USA. Arctic and Alpine Research 27:116–29. doi:https://doi.org/10.2307/1551893.