
ABSTRACT
Spring green-up in arctic and alpine systems is predominantly controlled by temperature and snowmelt timing preceding and during the growing season. Variation in the timing of green-up across space is an important aspect of resource variability with which mobile herbivores must contend. Here, we measure the explanatory power of abiotic drivers of green-up in a Low Arctic region of west Greenland, host to a migratory caribou population. We identify inconsistent relationships between green-up and abiotic drivers across space. Whereas green-up timing is most closely related to snowmelt in some areas, in others it is most closely related to spring temperature. The negative correlation between the explanatory power of snowmelt and temperature suggests that at broad scales, where green-up is more constrained by snow cover, such as moist, mountainous coastal areas, it is less constrained by temperature. Where snow is less persistent through winter, such as cold, dry inland areas, temperature becomes the predominant factor driving green-up. If the principal driver of spring plant growth is inconsistent across a region, long-term trends in resource phenology could vary spatially. For seasonal migrants like caribou, synchronizing migration timing with resource phenology may be complicated by discordant interannual change across drivers of green-up timing.
Introduction
Broad-scale variation in the seasonal timing of plant growth is important for the timing and orientation of migration in ungulates (Albon and Langvatn Citation1992). Interannual variation in the timing of plant growth is typically related to local abiotic factors such as temperature and snow cover (Cleland et al. Citation2007; Wipf and Rixen Citation2010). Within years, spring green-up tends to progress across the landscape, delayed with respect to latitude or elevation in a phenomenon often referred to as the “green wave” (Drent, Ebbinge, and Weijand Citation1978; van der Graaf Citation2006). Spatiotemporal variation in plant growth may influence the paths selected by migratory herbivores (Merkle et al. Citation2016; Aikens et al. Citation2017). Across a landscape, exploitation of plant phenological variability allows mobile consumers to prolong access to high-quality, newly emergent forage (Armstrong et al. Citation2016). Such spatial variation in resource phenology can compound the effect of timing of plant growth on herbivore reproductive success (Post et al. Citation2008). Thus, it is important to understand the underlying drivers of plant phenology spatial dynamics and the extent to which these factors explain phenological variation across space and time.
If different factors influence variability in plant phenological dynamics across a region, the timing of plant growth could shift inconsistently over space in response to broad-scale climatic changes. In general, plant growth is limited by the timing of snowmelt in regions with persistent winter snow cover, such as arctic and alpine environments (Wipf and Rixen Citation2010). Conversely, in the absence of persistent winter snow cover (e.g., in temperate latitudes), other controls, such as photoperiod and temperature, predominate (Körner and Basler Citation2010; Garonna et al. Citation2018). In temperate systems, the predominant controls of vegetation phenology may vary within a region depending on topographic and climatic influences (Brown et al. Citation2019). The extent to which intraregional variation in the timing of spring plant growth relates to different abiotic conditions in the Arctic is less certain. Here, we seek to uncover drivers of inter- and intra-annual variation in plant phenology in a Low Arctic region that is home to a migratory population of barren-ground caribou (Rangifer tarandus groenlandicus). We use satellite-derived measurements of snow cover and green-up timing, in addition to temperature records from two locations at opposing ends of this migratory corridor, to determine the extent to which snow and temperature influence the timing and spread of green-up across the Kangerlussuaq–Sisimiut region of west Greenland.
Methods
Study site
We analyzed interannual variation in spring green-up timing on the home range of the Kangerlussuaq–Sisimiut caribou herd in southwest Greenland. The population was estimated to be 98,300 in 2010 (Cuyler et al. Citation2012). The region is bounded by the Davis Strait, Nordre Isortoq Fjord, the Inland Ice, and the Sukkertoppen ice cap (; Thing Citation1984). Over the course of two to three weeks, this herd undergoes a seasonal migration between a winter range located near the village of Sisimiut along the west coast of Greenland and a summer calving range located approximately 150 km inland, east of the village of Kangerlussuaq, near Greenland’s Inland Ice. This range was previously described and mapped by Thing (Citation1984). The centroid of the core destination range lies 71 km east of the core departure range. Elevation in the destination range is on average 36 m lower than that in the departure range. Across the region, the mean elevation is 514 m a.s.l. (; Howat, Negrete, and Smith Citation2014).
Figure 1. The Kangerlussuaq–Sisimiut region of west Greenland (indicated by the orange polygon on inset) is bounded on all sides by the Davis Strait, Nordre Isortoq Fjord, the Inland Ice, and the Sukkertoppen ice cap (starting at the west, clockwise). Two villages in the region, Kangerlussuaq and Sisimiut, are designated by an orange inverted triangle and circle, respectively. (a) Data in the satellite image were generated using a median composite of all June imagery collected by Landsat 8 (2013–2018). Image product courtesy of the U.S. Geological Survey. (b) Elevation across the region is variable, with inland terrain lying closer to sea level, whereas coastal and southern areas are more mountainous
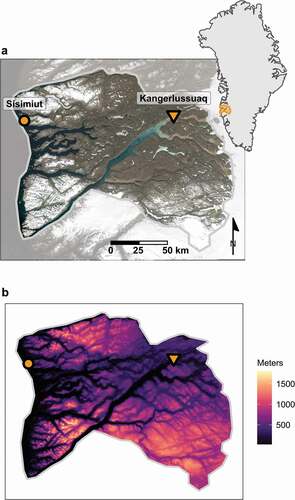
The Kangerlussuaq–Sisimiut caribou population is notable for the lack of large predators in the vicinity (Thing Citation1984); hence, migration in this population is likely to be associated with bottom-up climatic or resource drivers rather than top-down predation pressure. Moderating effects of the maritime climate lead to comparatively mild summers and winters in coastal regions compared to areas nearer Greenland’s Inland Ice Sheet, which feature cold winters and comparatively warm, dry summers. However, snow is deeper in the mountainous coastal regions and less persistent in the windswept areas further inland.
Landscape phenology
The Moderate Resolution Imaging Spectroradiometer (MODIS) collects daily radiometric measurements from two satellite platforms. For this analysis we used two level 3 products that derive from MODIS measurements, the MOD13Q1 Normalized Difference Vegetation Index (NDVI; Didan Citation2015) and the MOD10A1 Normalized Difference Snow Index (NDSI; Hall and Riggs Citation2015). We used the sixteen-day MOD13Q1, a 250-m NDVI data set, to investigate seasonal patterns in plant growth from 2001 to 2018. Interannual variation in satellite-derived landscape phenology in the region is significantly related to detrended ground-based observations of plant phenology (John Citation2016). The MOD13Q1 raster data set includes precalculated vegetation indices, as well as data quality bands. Vegetation indices are reported as biweekly maximum value composites from daily sampling by the MODIS satellites, alongside the date at which the maximum value was observed (“composite day of year”). We used the daily MOD10A1, a 500-m grid snow cover data set, to investigate patterns in snowmelt (Hall and Riggs Citation2015). This data set includes a snow index, and a Basic Quality Assessment data quality band. All remote sensing data were quality controlled, mosaicked, and downloaded using Google Earth Engine (Gorelick et al. Citation2017).
NDVI data were compiled into annual multidimensional arrays and processed according to the methods described in Bischof et al. (Citation2012). We removed observations that were classified as “snow/ice” and “cloudy” based on the MOD13Q1 quality layer (Didan Citation2015). NDVI data were stacked into a 365-layer array, according to the composite day of year for each NDVI observation (along the z-dimension) but maintaining relative spatial attributes (x- and y-dimensions). For each pixel in the data set, the bottom 0.025 quantile of NDVI measurements was used as a winter baseline. The time series was smoothed with a rolling median with a window width of three observations. The time series was then scaled so that the top 0.925 quantile of observations was set to one. Then, for each year, the NDVI time series was fit to a double-logistic curve that features a wintertime baseline, greening upward phase, summer asymptote, and senescing downward phase before returning to the asymptotic wintertime baseline. We derived the timing of peak instantaneous rate of green-up from each pixel’s NDVI time series to identify a single date representative of the midpoint of the green-up season each year (Bischof et al. Citation2012; Aikens et al. Citation2017; Geremia et al. Citation2019). By projecting this time point for each pixel across space, areas with comparatively large values represent MODIS pixels featuring delayed green-up, and areas with small values represent MODIS pixels featuring earlier green-up.
For snow cover, we retained only “good” and “best” quality NDSI observations based on the Basic Quality Assessment data quality band from the MOD10A1 data set. We used a threshold-based approach to differentiate snow-covered and snow-free pixels (Hall et al. Citation2012) and created daily binary snow images from the MOD10A1 collection. We set snow-covered (≥0.2 NDSI) pixels to one and snow-free (<0.2 NDSI) pixels to zero. A double-logistic curve with asymptotes at one and zero was fit to annual binary snow cover time series to identify dates of peak instantaneous rate of snowmelt in an approach analogous to the NDVI curve fitting described above. Because the MOD10A1 data set contains daily measurements, snowmelt timing was derived from 365 observations (with one observation per day), and green-up timing was derived from 23 observations (with one measurement every sixteen days). As opposed to the NDVI curve, the snow cover curve began each year with the wintertime snow-covered state (1) and dropped to the snow-free asymptote (0) during the spring, before returning to snow-covered (1) in the fall or winter. All analyses that draw from both snowmelt and green-up timing data used resampled green-up data in order to match the spatial resolution of snowmelt data.
Associations between abiotic factors and phenological dynamics
Monthly temperature records were acquired from the Danish Meteorological Institute for both Kangerlussuaq and Sisimiut (2001–2018; Danish Meteorological Institute (DMI) Citation2019). These villages host the nearest weather stations to the primary spring destination and departure ranges, respectively, of the focal caribou population. Regional monthly temperatures were calculated using the average monthly temperature for each month in both villages. We did not include precipitation in this analysis because a significant gap in precipitation data exists in the Sisimiut records during this period.
At the regional level, mean timing of green-up and snowmelt was used to index broad-scale seasonal patterns each year. Mean regional temperatures for each month leading up to and during the green-up period (January–June) were used as candidate predictors and the timing of green-up for each pixel as response variables in a linear model. Because of multicollinearity among weather stations and months, we used step selection based on Akaike’s information criterion (AIC) to identify the most parsimonious linear model relating regional green-up timing to monthly temperatures (Burnham and Anderson Citation2001). A model including only temperature and one with temperature and snowmelt timing were compared using the corrected AIC (AICc) to correct for number of parameters.
At the pixel level, associations between abiotic factors and vegetation green-up timing were assessed by including the mean temperature during the months that were selected using AIC step selection in the regional analysis above. Additional linear models were run using snowmelt timing as a candidate predictor, snowmelt timing and elevation as candidate predictors, and finally snowmelt timing, elevation, and temperature as candidate predictors. Models were compared using AICc adjusted for number of parameters.
Spatial drop-off in predictive capacity was assessed by comparing the AICc of linear models with mean May temperature in Sisimiut and Kangerlussuaq as predictors of green-up for each pixel. In cases where Kangerlussuaq temperature had a lower AICc (ΔAICc < 0), the inland temperature record was a better predictor of interannual variation in green-up timing at the pixel level than the coastal temperature record. When the absolute value of ΔAICc was greater than two, the difference in predictive capacity between the two weather stations was considered significant (Burnham and Anderson Citation2001). Longitudinal gradients were analyzed by centering rasters on zero and converting the UTM coordinate offset to kilometers in order to facilitate interpretation of the results. All statistical analyses and data visualizations were performed using R (R Core Team Citation2014).
Results
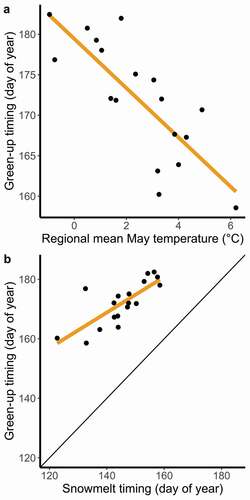
At the regional scale, green-up timing varied considerably among years but did not display significant trends over the duration of the study (2001–2018). Mean monthly temperatures preceding and during the growing season (January–June) emerged as strong predictors of green-up timing at the regional scale (linear regression, R2 = 0.84, F6,11 = 9.36, p < .001). Because of multicollinearity among monthly temperatures, we selected the two strongest predictor months, April and May (which were not significantly correlated; Pearson’s r = 0.18), for all subsequent analyses. Mean April and May temperatures were weak predictors of snowmelt timing (R2 = 0.45, F2,15 = 6.03, p = .012) but strong predictors of green-up timing (; R2 = 0.73, F2,15 = 19.86, p < .001). Together with regional snowmelt timing (), April and May temperatures explained 86.3 percent of variation in green-up timing at the regional scale (linear model, F3,14 = 29.36, p < .001), although regional snowmelt and regional May temperature were moderately correlated (Pearson’s r = −0.43, p = .075).
Figure 2. In the Kangerlussuaq–Sisimiut region (2001–2018), the timing of spring plant growth occurs earlier in years with warm springs and early snowmelt. (a) The mean regional temperature during May is the strongest single month temperature predictor of mean regional green-up timing (β = −3.05 ± 0.58, R2 = 0.63, F1,16 = 27.38, p < .05). Mean April temperature (not shown) is also significantly associated with regional green-up (April, β = −1.13 ± 0.46, p < .05, as a standalone predictor; when including both April and May as predictors, R2 = 0.73, F2,15 = 19.86, p < .001). (b) Spring green-up timing always follows snowmelt timing at the regional level, β = 0.598 ± 0.12, R2 = 0.60, F1,16 = 23.93, p < .001; black line indicates the 1:1 relationship
At the local (pixel) scale, spring green-up timing was positively associated with elevation, indicating that green-up occurred later at higher elevations (; β = 1.48 days/100 m elevation, R2 = 0.063, F1,195,066 = 1.3 × 10⁴, p < .001). This pattern was consistent for all years of the study (2001–2018; see Figure S1). A regular inland-to-coastal progression of green-up emerged (Figure S2), which opposed the direction of spring migration by the local caribou population (Thing Citation1984). Green-up timing was also associated with snowmelt timing across the data set (; slope = 0.53 days/day snowmelt, R2 = 0.38, F1,192,792 = 1.20 × 10⁵, p < .001), a relationship that was maintained each year (see Figure S3). Snowmelt was somewhat delayed with respect to elevation, but the two variables were sufficiently unrelated that both could be used together as predictors (Pearson’s r = 0.32, p < .001, variance inflation factor = 1.097). Inclusion of both terms in a linear model explained 39 percent of variation in green-up timing across the duration of the study (F1,192,791 = 6.15 × 10⁴, p < .001).
Figure 3. Across the Kangerlussuaq–Sisimiut region (2001–2018), spring green-up timing is delayed with (a) increasing elevation and (b) delayed snowmelt timing at the pixel level. Orange lines are linear regressions with spring green-up timing in response to either of the abiotic predictors: (a) β = 1.48 days/100 m elevation and (b) β = 0.53 days/day snowmelt. Black line in (b) is the 1:1 relationship
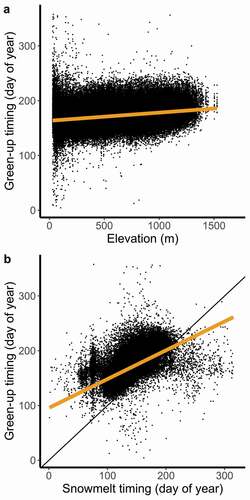
Figure 4. Proportion of interannual variance in green-up timing explained by (a) temperature and (b) snowmelt across the Kangerlussuaq–Sisimiut region (2001–2018). In general, temperature and snowmelt are inversely predictive of green-up timing (p < .001); areas exhibiting a strong relationship between temperature and green-up timing tend to exhibit a weak relationship between snowmelt timing and green-up timing and vice versa. Weather stations are denoted with an orange circle (Sisimiut) and triangle (Kangerlussuaq)
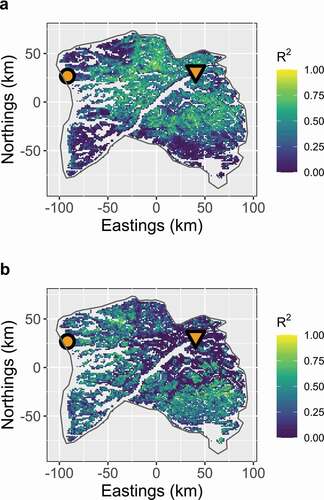
May temperatures in both villages were better predictors of inland green-up timing than of green-up timing nearer the coast (Figure S4). The predictive power (R2) of temperature on green-up timing was inversely related to that of snowmelt timing on green-up timing (p < .001). Accordingly, we detected a consistent pattern across the landscape in the relative proportion of variance in green-up timing that was better predicted by temperature vs. snowmelt timing (). May temperature in Kangerlussuaq was a consistently better predictor of green-up timing than May temperature in Sisimiut, especially for areas farther inland (Figure S5).
The regional balance of green-up (measured as the slope of a linear model of green-up vs. longitude; see Figure S2) was not significantly affected by the difference in May temperature between Kangerlussuaq and Sisimiut (p > .05). Instead, whereas temperature was more predictive of inland green-up timing than coastal green-up timing (R2 = 0.024, F1,10,944 = 273, p < .001), snowmelt timing, which was not strongly related to temperature, was a more important predictor for green-up timing near the coast than it was farther inland (R2 = 0.012, F1,10,944 = 138, p < .001).
Discussion
Across years, mean regional spring green-up timing was broadly related to regional spring temperature and snowmelt timing, but the relationship between green-up and abiotic variables was less consistent at finer scales. At the local scale, green-up was delayed with respect to increasing elevation, a pattern that held across all years of the study. Green-up was also generally delayed with respect to later snowmelt across years. However, this pattern was not consistently evident, and temperature was an equally important or more important predictor in some parts of the Kangerlussuaq–Sisimiut region. In the western and southern portions of the region, the primary winter range used by caribou, interannual variation in green-up timing was most closely related to snowmelt timing. These areas tend to be mountainous and have increased precipitation but milder winter temperatures due to the maritime influence of the Davis Strait. Conversely, toward the northern and inland part of the region, the core of the caribou summer calving range, interannual variation in green-up timing was most closely related to spring temperature. The comparatively reduced precipitation and colder winter temperatures are likely associated with proximity to the Inland Ice sheet.
Our results reveal a complex relationship between green-up and snowmelt timing at the local and regional levels. Across years, though green-up consistently followed snowmelt regionally, the slope of that relationship was less than one, indicating that green-up occurs more immediately after snowmelt in years with later snowmelt (). This relationship was manifest as a window after snowmelt but preceding peak green-up that lasted as little as twenty days in years with delayed snowmelt (2001) and as much as forty-four days in years with early snowmelt (2013).
In a Bayesian analysis of effects of temperature, snowmelt, and sea ice on plant phenology dates across four Mid and High Arctic sites in North America, the mean effect of snowmelt on plant phenology was estimated to be 0.45 days of plant phenological advance per day of snowmelt advance (Assmann et al. Citation2019). These relationships presumably reflect the added constraints of temperature, photoperiod, and their interactions on plant phenology (Assmann et al. Citation2019).
Within years and across space, the slope of the relationship between green-up and snowmelt was similarly less than one, but there were numerous cases where green-up preceded snowmelt (). This was likely due to the method by which we calculated snowmelt timing. Rather than using the first snow-free day of the year, we used a curve-fitting technique to derive the end of the snowy season. Therefore, brief snow-free conditions followed by a period of snow cover could extend the duration of the snowy season while promoting initiation of plant growth. In areas with less persistent snow cover, such as the northeast inland area occupied by caribou during the summer calving season, limitations imposed by snow cover are alleviated and broad-scale green-up appears to respond more strongly to temperature. The warm foehn winds characteristic of west Greenland can thaw entire landscapes (Thing Citation1984) and may explain a great deal of the residual variation in local green-up timing presented here. A future analysis of the effect of foehn winds could improve our understanding of early season plant growth and its importance for herbivore ecology.
Pettorelli et al. (Citation2005) used a site-based approach to investigate the drivers of variation in the timing of plant growth and the effect of such variation on reindeer body mass in Norway. Similar to the findings presented here, in that study warm springs led to earlier plant growth, and deep snow and high altitude were associated with delayed plant growth (Pettorelli et al. Citation2005). However, whereas timing of spring plant growth occurred earlier near the coast in Norway (Pettorelli et al. Citation2005), we found a later onset of spring green-up near the coast compared to green-up timing farther inland (Figure S2). We expect this is due to combined effects of the lower elevations of inland Greenland () and the persistent snow cover that is characteristic of coastal southwest Greenland. Though snow depth, snow persistence, and surface temperature are all related both directly and through feedbacks (Xu and Dirmeyer Citation2011), air temperature can only begin to act on plant phenology once sufficient insulating snow has melted away. Therefore, temperature could emerge as an important factor controlling plant growth in years with comparatively low snow cover near the coast.
The spatial variability in predominant drivers of landscape phenology documented here is relevant to the migratory ecology of the local caribou population. The presence of an inland-to-coast progression of spring green-up presumably complicates tracking by caribou of green-up from their coastal winter range toward their inland summer calving range. However, migratory arrival timing by caribou in this population at the summer range is highly correlated with local emergence phenology of some key forage species at their calving grounds, including the forbs Campanula sp. and Stellaria longipes and the shrub Betula nana (Post Citation2019). Rather than relating to departure timing itself or generalized phenological conditions on the departure range, caribou springtime migratory arrival on calving grounds may be influenced by additional proximal factors, such as insect harassment, snow cover, and variation in plant growth along the way, that govern the pace of migration through effects on body condition (Gurarie et al. Citation2019).
In situ validation measurements are chronically lacking from studies of remotely sensed greening and phenology data (Myers-Smith et al. Citation2020). In other arctic sites, MODIS vegetation indices have been shown to broadly relate to the phenology of polar willow (Karlsen et al. Citation2014). Here, we used time series NDVI from the MOD13Q1 satellite to derive green-up timing across space. This green-up metric was strongly correlated to detrended interannual variation in plant community emergence timing at a study site within the region (John Citation2016). Though no such ground validation of snowmelt exists for the area, MODIS products have been used elsewhere in the Arctic to model snowpack depletion (Homan et al. Citation2011). Evidence suggests that though the MOD10A1 albedo product exhibits more high-frequency variability than in situ albedo measurements, it generally tracks seasonal patterns in ground-validated albedo (Stroeve, Box, and Haran Citation2006).
We have identified a spatial disparity in predominant drivers of landscape green-up timing that operates on a scale relevant to migratory herbivores. Because green-up is limited by different factors across the Kangerlussuaq–Sisimiut region, ongoing climatic change could dampen or exacerbate intraregional differences in landscape phenology. Future investigations in landscape phenology and herbivore migration should consider the multiple factors influencing plant growth and recognize that the magnitude of abiotic effects on plant growth may not be consistent across space. Future work should also seek to identify where and how transitions between dominant abiotic processes emerge. Specifically, by targeting sites at the interface between snow-dominated and temperature-dominated green-up patterns, factorial snowmelt and temperature manipulations may shed light on the unique and interactive effects of these drivers on fine-scale green-up. Aerial photogrammetric measurements of these manipulations could help bridge the gap between plot-scale and satellite-scale observations.
Data availability
All data used in this analysis are publicly available through National Aeronautics and Space Administration (NASA), National Snow and Ice Data Center (NSIDC), and the Greenland Ice Mapping Project (GIMP) and were accessed using Google Earth Engine. Code for accessing, processing, and analyzing the data will be made available on a public Github repository upon acceptance of the manuscript for publication.
Supplemental Material
Download Zip (15.6 MB)Acknowledgments
The authors thank R. Conor Higgins and two anonymous reviewers for helpful comments on an earlier version of this article.
Disclosure statement
No potential conflict of interest was reported by the authors.
Funding
Financial support was provided by U.S. National Science Foundation Grant PLR1525636 to EP.
Supplementary material
Supplemental data for this article can be accessed on publisher’s website.
References
- Aikens, E. O., M. J. Kauffman, J. A. Merkle, S. P. H. Dwinnell, G. L. Fralick, and K. L. Monteith. 2017. The greenscape shapes surfing of resource waves in a large migratory herbivore. Ecology Letters 20 (6):741–50. doi:https://doi.org/10.1111/ele.12772.
- Albon, S. D., and R. Langvatn. 1992. Plant phenology and the benefits of migration in a temperate ungulate. Oikos 65 (3):502–13. doi:https://doi.org/10.2307/3545568.
- Armstrong, J. B., G. Takimoto, D. E. Schindler, M. M. Hayes, and M. J. Kauffman. 2016. Resource waves: Phenological diversity enhances foraging opportunities for mobile consumers. Ecology 97 (5):1099–112. doi:https://doi.org/10.1890/15-0554.1.
- Assmann, J. J., I. H. Myers‐Smith, A. B. Phillimore, A. D. Bjorkman, R. E. Ennos, J. S. Prevéy, G. H. R. Henry, N. M. Schmidt, and R. D. Hollister. 2019. Local snow melt and temperature—but not regional sea ice—explain variation in spring phenology in coastal Arctic tundra. Global Change Biology 25 (7):2258–74. doi:https://doi.org/10.1111/gcb.14639.
- Bischof, R., L. E. Loe, E. L. Meisingset, B. Zimmermann, B. Van Moorter, and A. Mysterud. 2012. A migratory northern ungulate in the pursuit of spring: Jumping or surfing the green wave? American Naturalist 180 (4):407–24. doi:https://doi.org/10.1086/667590.
- Brown, J. F., L. Ji, A. Gallant, and M. Kauffman. 2019. Exploring relationships of spring green-up to moisture and temperature across Wyoming, U.S.A. International Journal of Remote Sensing 40 (3):956–84. doi:https://doi.org/10.1080/01431161.2018.1519642.
- Burnham, K. P., and D. R. Anderson. 2001. Kullback-Leibler information as a basis for strong inference in ecological studies. Wildlife Research 28 (2):111–19. doi:https://doi.org/10.1071/WR99107.
- Cleland, E. E., I. Chuine, A. Menzel, H. A. Mooney, and M. D. Schwartz. 2007. Shifting plant phenology in response to global change. Trends in Ecology & Evolution 22 (7):357–65. doi:https://doi.org/10.1016/j.tree.2007.04.003.
- Cuyler, C., M. Rosing, H. Mølgaard, R. Heinrich, and K. Raundrup. 2012. Status of two west Greenland caribou populations 2010; 1) Kangerlussuaq-Sisimiut & 2) Akia-Maniitsoq. Nuuk, Greenland: Pinngortitaleriffik - Greenland Institute of Natural Resources.
- Danish Meteorological Institute (DMI). 2019. Weather Archive. Accessed July 2017 and September 2019. https://www.dmi.dk/vejrarkiv.
- Didan, K. 2015. MOD13Q1 MODIS/terra vegetation indices 16-Day L3 Global 250m SIN Grid V006. Sioux Falls, SD: NASA EOSDIS Land Processes DAAC. doi:https://doi.org/10.5067/MODIS/MOD13Q1.006.
- Drent, R. H., B. S. Ebbinge, and B. Weijand. 1978. Balancing the energy budgets of arctic-breeding geese throughout the annual cycle: A progress report. Verhandlungen der Ornithologischen Gesellschaft in Bayern 23:239–64.
- Garonna, I., R. de Jong, R. Stöckli, B. Schmid, D. Schenkel, D. Schimel, and M. E. Schaepman. 2018. Shifting relative importance of climatic constraints on land surface phenology. Environmental Research Letters 13 (2):024025. doi:https://doi.org/10.1088/1748-9326/aaa17b.
- Geremia, C., J. A. Merkle, D. R. Eacker, R. L. Wallen, P. J. White, M. Hebblewhite, and M. J. Kauffman. 2019. Migrating bison engineer the green wave. Proceedings of the National Academy of Sciences 116 (51):25707–13. doi:https://doi.org/10.1073/pnas.1913783116.
- Gorelick, N., M. Hancher, M. Dixon, S. Ilyushchenko, D. Thau, and R. Moore. 2017. Google Earth engine: Planetary-scale geospatial analysis for everyone. Remote Sensing of Environment 202:18–27. doi:https://doi.org/10.1016/j.rse.2017.06.031.
- Gurarie, E., M. Hebblewhite, K. Joly, A. P. Kelly, J. Adamczewski, S. C. Davidson, T. Davison, A. Gunn, M. J. Suitor, W. F. Fagan, et al. 2019. Tactical departures and strategic arrivals: Divergent effects of climate and weather on caribou spring migrations. Ecosphere 10 (12):e02971. doi:https://doi.org/10.1002/ecs2.2971.
- Hall, D. K., and G. A. Riggs. 2015. MODIS/terra snow cover daily L3 Global 500m SIN Grid, Version 6. Boulder, CO: NASA National Snow and Ice Data Center Distributed Active Archive Center. doi:https://doi.org/10.5067/MODIS/MOD10A1.006.
- Hall, D. K., J. L. Foster, N. E. DiGirolamo, and G. A. Riggs. 2012. Snow cover, snowmelt timing and stream power in the Wind River Range, Wyoming. Geomorphology 137 (1):87–93. doi:https://doi.org/10.1016/j.geomorph.2010.11.011.
- Homan, J. W., C. H. Luce, J. P. McNamara, and N. F. Glenn. 2011. Improvement of distributed snowmelt energy balance modeling with MODIS-based NDSI-derived fractional snow-covered area data. Hydrological Processes 25 (4):650–60. doi:https://doi.org/10.1002/hyp.7857.
- Howat, I. M., A. Negrete, and B. E. Smith. 2014. The Greenland Ice Mapping Project (GIMP) land classification and surface elevation data sets. The Cryosphere 8 (4):1509–18. doi:https://doi.org/10.5194/tc-8-1509-2014.
- John, C. 2016. Against the wave: When a migrant’s spring range phenology varies with warming. University Park: Pennsylvania State University.
- Karlsen, S. R., A. Elvebakk, K. A. Høgda, and T. Grydeland. 2014. Spatial and temporal variability in the onset of the growing season on Svalbard, Arctic Norway — Measured by MODIS-NDVI satellite data. Remote Sensing 6 (9):8088–106. doi:https://doi.org/10.3390/rs6098088.
- Körner, C., and D. Basler. 2010. Phenology under global warming. Science 327 (5972):1461–62. doi:https://doi.org/10.1126/science.1186473.
- Merkle, J. A., K. L. Monteith, E. O. Aikens, M. M. Hayes, K. R. Hersey, A. D. Middleton, B. A. Oates, H. Sawyer, B. M. Scurlock, and M. J. Kauffman. 2016. Large herbivores surf waves of green-up during spring. Proceedings of the Royal Society B: Biological Sciences 283 (1833):20160456. doi:https://doi.org/10.1098/rspb.2016.0456.
- Myers-Smith, I. H., J. T. Kerby, G. K. Phoenix, J. W. Bjerke, H. E. Epstein, J. J. Assmann, C. John, L. Andreu-Hayles, S. Angers-Blondin, P. S. A. Beck, et al. 2020. Complexity revealed in the greening of the Arctic. Nature Climate Change 10 (2):106–17. doi:https://doi.org/10.1038/s41558-019-0688-1.
- Pettorelli, N., R. B. Weladji, Ø. Holand, A. Mysterud, H. Breie, and N. C. Stenseth. 2005. The relative role of winter and spring conditions: Linking climate and landscape-scale plant phenology to alpine reindeer body mass. Biology Letters 1 (1):24–26. doi:https://doi.org/10.1098/rsbl.2004.0262.
- Post, E. 2019. Time in ecology: A theoretical framework. Princeton: Princeton University Press.
- Post, E., C. Pedersen, C. C. Wilmers, and M. C. Forchhammer. 2008. Warming, plant phenology and the spatial dimension of trophic mismatch for large herbivores. Proceedings of the Royal Society B: Biological Sciences 275 (1646):2005–13. doi:https://doi.org/10.1098/rspb.2008.0463.
- R Core Team. 2014. R: A language and environment for statistical computing. Vienna: R Foundation for Statistical Computing.
- Stroeve, J. C., J. E. Box, and T. Haran. 2006. Evaluation of the MODIS (MOD10A1) daily snow albedo product over the Greenland Ice Sheet. Remote Sensing of Environment 105 (2):155–71. doi:https://doi.org/10.1016/j.rse.2006.06.009.
- Thing, H. 1984. Feeding ecology of the West Greenland caribou. In Danish Review of Game Biology. Kalø, Denmark: Vildtbiologisk Station.
- van der Graaf, S. 2006. Surfing on a green wave - how plant growth drives spring migration in the Barnacle Goose Branta leucopsis. Ardea 94:567.
- Wipf, S., and C. Rixen. 2010. A review of snow manipulation experiments in Arctic and alpine tundra ecosystems. Polar Research 29 (1):95–109. doi:https://doi.org/10.1111/j.1751-8369.2010.00153.x.
- Xu, L., and P. Dirmeyer. 2011. Snow-atmosphere coupling strength in a global atmospheric model. Geophysical Research Letters 38:L13401. doi:https://doi.org/10.1029/2011GL048049.