
 ?Mathematical formulae have been encoded as MathML and are displayed in this HTML version using MathJax in order to improve their display. Uncheck the box to turn MathJax off. This feature requires Javascript. Click on a formula to zoom.
ABSTRACT
The net change in the carbon inventory of arctic tundra remains uncertain as global warming leads to shifts in arctic water and carbon cycles. To better understand the response of arctic tundra carbon to changes in winter precipitation amount, we investigated soil depth profiles of carbon concentration and radionuclide activities (7Be, 137Cs, 210Pb, and 241Am) in the active layer of a twenty-two-year winter snow depth manipulation experiment in moist acidic tussock tundra at Toolik Lake, Alaska. Depth correlations of cumulative carbon dry mass (g cm−2) vs. unsupported 210Pb activity (mBq g−1) were examined using a modified constant rate of supply (CRS) model. Results were best fit by two-slope CRS models indicating an apparent step temporal increase in the accumulation rate of soil organic carbon. Most of the best-fit model chronologies indicated that the increase in carbon accumulation rate apparently began and persisted after snow fence construction in 1994. The inhomogeneous nature of permafrost soils and their relatively low net carbon accumulation rates make it challenging to establish robust chronologic records. Nonetheless, the data obtained in this study support a decadal-scale increase in net soil organic carbon accumulation rate in the active layer of arctic moist acidic tussock tundra under conditions of increased winter precipitation.
KEYWORDS:
Introduction
Understanding the arctic carbon cycle today and its likely behavior in the future is essential to recognizing short- and long-term responses and feedbacks to the climate system. The impact of the changing Arctic on the climate system can be substantial because arctic ecosystems harbor as much as 50 percent of the total terrestrial soil carbon pool (Vitharana et al. Citation2017). Changes in soil organic carbon inventories in arctic regions are expected as a direct response to warmer summers (Chapin and Shaver Citation1985; Elmendorf et al. Citation2012; Gallego-Sala et al. Citation2018) and greater moisture availability (Zhang et al. Citation2013), including increased winter snow precipitation (Welker, Fahnestock, and Jones Citation2000; Blanc-Betes et al. Citation2016; Leffler et al. Citation2016; Jespersen et al. Citation2018). However, precipitation predictions are uncertain across the Arctic (some regions are predicted to have more and some are predicted to have less), and this variation is reflected in the annual fluctuations in snow cover and snow water equivalents reported for the past ten years by the annual National Oceanic and Atmospheric Administration Arctic Report Cards (see NOAA Citation2019).
Increases and decreases in snowfall and winter snowpack can lead to different ecosystem impacts (Bintanja and Selten Citation2014; Bintanja and Andry Citation2017). The effects of these changes on soil organic carbon inventories depend on soil carbon cycling processes (Schaeffer et al. Citation2013; Ricketts et al. Citation2016; Vitharana et al. Citation2017) and soil active layer depth (Pattison and Welker Citation2014; Jespersen et al. Citation2018). Improved understanding of the mechanisms driving the arctic carbon cycle continues to be at the forefront of research on the role of the “New Arctic” in the global climate system, especially processes that drive winter carbon emissions (Fahnestock et al. Citation1999; Lupascu et al. Citation2018; Natali et al. Citation2019).
Release of stored arctic carbon into the atmosphere, rivers, and ocean is becoming increasingly apparent (Czimczik and Welker Citation2010; Mishra et al. Citation2017; Nowinski et al. Citation2010; Lupascu et al. Citation2014, Citation2018; Csank et al. Citation2019). It is being driven by deepening of the active layer as permafrost thaws and by coastal and riverine erosion causing shoreline retreat and export of carbon-rich sediment and water into the Arctic Ocean (Martens et al. Citation2018). In contrast, arctic tundra is also becoming more productive as seen by increases in the Normalized Difference Vegetation Index values, due in part to greater leaf area associated with shrub density increases (Tape et al. Citation2012; Leffler et al. Citation2016; Mekonnen, Riley, and Grant Citation2018). The net effect of these accelerated carbon losses and productivity gains on the arctic carbon cycle is difficult to quantify because it requires a full picture of the annual CO2 and CH4 emissions (Blanc-Betes et al. Citation2016) and the export of dissolved organic and inorganic carbon by surface water flow (Lehn et al. Citation2017; Csank et al. Citation2019), as well as gains in soil organic carbon and biomass due to increases in net primary productivity (Welker, Fahnestock, and Jones Citation2000; Matamala et al. Citation2017). It is difficult to depict changes in carbon inventories in permafrost soils because we lack a baseline for net soil carbon accrual rates and how they may be affected by winter precipitation scenarios.
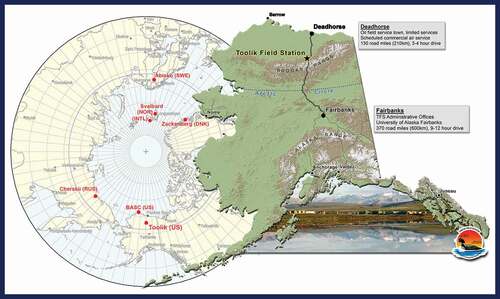
In this study, we explored a 210Pb-based chronometric approach to obtain an integrative measure of the temporal change in net soil carbon accumulation rate in the active layer organic horizon of moist acidic tussock tundra in response to the construction of a snow fence near Toolik Lake, Alaska, at 68°38′ N, 149°38′ W; elevation 760 m (). We measured and compared profiles of soil organic carbon and 210Pb (half-life = 22.3 a) along with 7Be (half-life = 53.3 d), 137Cs (half-life = 30.2 a), and 241Am (half-life = 432.2 a) in a set of active layer cores from within and outside the area influenced by a twenty-two-year snow fence experiment. This was a reconnaissance study conducted with a relatively small set of cores to assess whether this approach could give meaningful results over a decadal timescale, given the known complications of 210Pb-based soil chronology (Dörr and Münnich Citation1989, Citation1991; Kaste, Heimsath, and Bostick Citation2007; Kaste et al. Citation2011; Landis, Renshaw, and Kaste Citation2016; Olid et al. Citation2016; Gonzalez-Meler et al. Citation2018). Our objective was to ascertain the impact of deeper winter snow accumulation (caused by the snow fence) on the net rate of soil organic carbon accumulation. We assumed that all soil organic carbon in the active layer profile was produced from plant and microbial inputs and that 210Pb deposited from the atmosphere could be used as a proxy to estimate the net carbon accumulation rate in the organic-rich horizon of the active layer. Key assumptions in this approach were (1) atmospheric 210Pb deposited onto the tundra surface was fully retained within the active layer, (2) 210Pb was strongly sorbed to organic matter where it has limited mobility (Landis, Renshaw, and Kaste Citation2014), and (3) soil organic matter decomposition rate was low in the cold arctic environment. Thus, the profile of 210Pb deposited onto the organic carbon could allow a quantitative model of the net accumulation rate of soil organic carbon on the timescale of 210Pb decay. We used 7Be as an indicator of near-surface 210Pb mobility (Landis, Renshaw, and Kaste Citation2016) and made simple modifications to our CRS models to accommodate this effect and also to account for changes in net soil organic carbon accumulation rate and 210Pb depositional flux. We compared our 210Pb-based chronologies with the depth profiles of bomb-era fallout radionuclides 137Cs and 241Am.
Figure 1. Location map of the Toolik Field Station in northern Alaska. The inset shows the study area in relation to the circumpolar arctic region (graphic courtesy of Toolik Field Station)
Applications of fallout radionuclides in studies of sediment, soil, and peat accumulation (7Be, 137Cs, 210Pb, 241Am) have been explored by a number of authors (Robbins and Edgington Citation1975; Dörr and Münnich Citation1989, Citation1991; Urban et al. Citation1990; Kaste, Heimsath, and Bostick Citation2007; Kaste et al. Citation2011; Abril and Gharbi Citation2012; Landis, Renshaw, and Kaste Citation2014, Citation2016; Shotyk et al. Citation2015; Olid et al. Citation2016; Davies et al. Citation2018; Gonzalez-Meler et al. Citation2018). The prior studies most relevant to the current study are those dealing with accumulation of soil and peat. There is a growing consensus reflected in the most recent studies that post-depositional downward mobility of 210Pb into the accumulating organic horizon of soil and peat generally results in a nonexponential profile of 210Pb activity with depth (e.g., Landis, Renshaw, and Kaste Citation2016; Olid et al. Citation2016). The downward motion of 210Pb is attributed to advective transport of colloidal organic particles with adsorbed 210Pb, and this generally results in maximum 210Pb activity at a depth of several centimeters to tens of centimeters below the surface vegetation and litter layer (Landis, Renshaw, and Kaste Citation2016). The depth profile of 7Be is a good indicator of the depth of 210Pb transport because these two radionuclides behave similarly in such systems (Landis, Renshaw, and Kaste Citation2016). Various numerical and analytical models have been proposed to accommodate near-surface 210Pb mobility so that chronometric information can be obtained regarding mass accumulation rates and calendar dates as a function of mass depth. Most such models assume steady-state behavior with diffusion-like transport of 210Pb in the near-surface (typically over a centimeter to decimeter depth range), and derived accumulation rates and calendar dates may be verified with the occurrence of distinct time horizons such as the peak activities of the bomb-pulse radionuclides 137Cs and 241Am that occurred in 1963–1964 (Kaste, Heimsath, and Bostick Citation2007; Landis, Renshaw, and Kaste Citation2016; Olid et al. Citation2016). Concordant chronologic results may be obtained between 210Pb and other fallout radionuclides below the depth of maximum 210Pb activity in soil profiles (Landis, Renshaw, and Kaste Citation2016).
Prior to this study, we anticipated that the consequences of deeper snow in winter could lead to lower soil carbon accumulation, due in part to higher rates of winter CO2 emissions and accelerated summer decomposition (Schimel, Bilbrough, and Welker Citation2004), and that any changes in vegetation would be insufficient to counter these losses with soil carbon inputs via litter deposition, root growth and exudate inputs, and microbial growth. In contrast, simple models of our 210Pb data from soil cores beneath artificially deepened winter snow are consistent with a substantial increase in the net rate of soil carbon accumulation relative to cores from ambient snow depth conditions outside the influence area of the snow fence. Our data also indicated a rapid response of soil organic carbon accumulation to increased snow depth, because the increase in net soil organic carbon accumulation rate in cores for which it could be reasonably quantified coincided with the calendar date of snow fence construction.
Methods
Field site
As part of the ITEX (International Tundra Experiment; Henry and Molau Citation1997; M. D. Walker et al. Citation1999), a 2.8 m-high × 60 m-long snow fence was built at the study location in 1994, perpendicular to the prevailing winter southerly winds, to artificially increase leeward snow accumulation to simulate the anticipated increase in winter precipitation with winter climate warming. Within the snow fence experimental plot, leeward snow drift accumulation zones were defined relative to ambient annual snow depth of ~0.5 m as deep (2–3 m), intermediate (0.5–2 m), and low (<0.5 m) (; see also Supplementary Figure S1). The entire experimental plot has heterogeneous microtopography and an ~5° eastward slope. The active layer thickness of moist acidic tussock tundra around Toolik Lake averages ~30 cm during the three- to four-month growing season and reaches a maximum thaw depth of 45 to 50 cm by late August. The moist acidic tussock tundra is an ombotrophic bog, and the active layer consists of a 5- to 20-cm-thick organic layer overlying a mineral horizon derived from weathered glacial drift. Total annual precipitation is near 300 mm (~200 mm summer and ~100 mm winter), with snow cover lasting from September to May.
Figure 2. Experimental configuration showing cross section of snowdrift distribution leeward of the snow fence, with locations of core samples (deep, intermediate, low) and corresponding winter snow depths (m) in this study (modified from M. D. Walker et al. Citation1999)
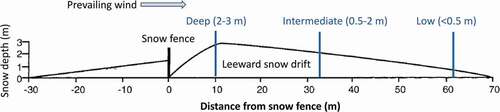
Soil surface temperatures in the snow fence experimental plot reach 10°C to 15°C during summer months and decline to about −7°C in late winter under the deepest part of the snow drift, whereas temperatures as low as −30°C occur under ambient late winter conditions (M. D. Walker et al. Citation1999; Pattison and Welker Citation2014). During the early winter, before substantial snow accumulation, small amounts of leaves and windblown organic debris are deposited leeward within 25 m of the snow fence (deep snow zone; ; M. D. Walker et al. Citation1999). There is typically a two- to three-week delay in the timing of completion of the spring snowmelt in the deeper drift area leeward of the snow fence (M. D. Walker et al. Citation1999). Soils are acidic (pH < 5), coarse-loamy, and poorly drained. Vegetation is dominated by tussock-forming cottongrass sedge (Eriophorum vaginatum) and intertussock moss (Sphagnum sp.), with wet sedge (Carex bigelowii) and occasional shrubs including dwarf birch (Betula nana) and tealeaf willow (Salix pulchra), in a landscape that is typical of moist acidic tussock tundra across the Alaskan North Slope (M. D. Walker et al. Citation1999; Leffler et al. Citation2016). Vegetation cover across the snow fence experimental plot was generally homogeneous, except in the deep snow accumulation zone where the abundance of sphagnum moss and wet sedge was much higher and the abundance of cotton-grass sedge and dwarf birch was much lower (Miller Citation2014). Standing water is frequently present in the deep snow accumulation zone because it has a slight topographic depression.
Sample collection
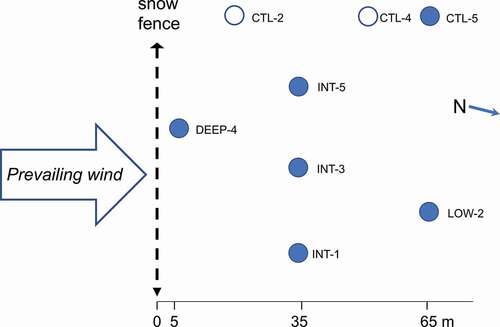
Cores were collected in the intertussock areas dominated by sphagnum moss growth at the surface. Soil cores (4.8 cm diameter × 30 cm depth) were taken between 10 a.m. and 3 p.m. in early August 2016, including five cores from within the snow fence plot (one core from deep snow depth zone ~10 m leeward of the snow fence, three cores from intermediate snow depth zone ~35 m leeward of the snow fence, and one core from low snow depth zone ~65 m leeward of the snow fence) and three cores from outside the snow fence plot (intended as controls representing ambient snow conditions; ; see Supplementary Figure S2 for photographs of typical core sampling sites). Cores were immediately wrapped in Al foil, sealed in plastic bags, and kept frozen until prepared for analysis.
Figure 3. Location map showing collection sites within snow fence experimental plot for core samples measured in this study. Open circles indicate cores reflecting ambient winter snow conditions; filled circles indicate cores for which snow depth was affected by snow fence. Snow fence is approximately 600 m south of Toolik Lake at ~50 m elevation above lake level. Prevailing wind direction is southerly
Sample preparation
Frozen cores were sectioned by using a band saw in a −20°C cold room into 1-cm depth increments that were weighed before drying and then air-dried at 60°C to a constant weight for the direct determination of soil water content and bulk dry density (g cm−3) at the University of Illinois at Chicago. Core segments were homogenized after drying by using a high-speed rotary blender.
Gamma spectrometry
Aliquots (~2 to 3 g) of the homogenized dry samples were analyzed by gamma spectrometry at the University of Delaware’s Environmental Isotope Geochemistry Laboratory. Two high-purity Ge gamma spectrometers (model GWL-170-15-LB-AWT with 15-mm well diameter, EG&G Ortec, Ametek, Inc.) were used to measure gamma emissions of 7Be (477.2 keV), 137Cs (661.7 keV), 210Pb (46.5 keV), and 241Am (59.5 keV).
Gamma spectrometer efficiencies were calibrated using measurements of certified radionuclide standards, including DL-1A (CANMET Citation2017) for 210Pb and other U- and Th-series nuclides and NIST SRM-4357 (NIST Citation1997) for 137Cs. We assumed that the efficiency of the 241Am peak at 59.5 keV was equal to that determined for the 234Th peak at 63.3 keV, and we estimated the detector efficiency at the 7Be energy by linear interpolation between the nearest large peaks of the U- and Th-series nuclides in the DL-1A reference spectra. Specific activities and one-sigma counting errors were calculated using standard statistical techniques (Mook and DeVries Citation2001) and are reported in millibecquerels per gram dry mass (mBq g−1). Reported activities were corrected for detector background and decay from the time of sampling to the start time of the gamma spectrometry measurement. Limits of quantification for radionuclides were defined as three times the standard deviation of the background under the peak used for the activity quantification, and values less than the limit of quantification are not reported.
Carbon concentrations
Total carbon contents (weight percentage, dry basis) were determined by using a zero-blank elemental analyzer (Costech Analytical, EC4010; Valencia, CA) at the University of Illinois at Chicago. Total carbon concentrations are assumed to equal total soil organic carbon, because inorganic carbon solid phases are unstable at the low pH of the moist acidic tundra active layer. No further acidification was performed during sample preparation. Precision of carbon concentrations was ±1 to 2 weight percentage, based on replicate analyses of samples and standards.
Calculation of carbon accumulation rates using 210Pb data
Profiles of unsupported 210Pb activity in soil cores were analyzed with a modification of the constant rate of supply (CRS) model (Appleby and Oldfield Citation1978; Robbins Citation1978), to obtain estimates of apparent net carbon accumulation rates (mg cm−2 yr−1) from best-fit linear regressions of cumulative carbon dry mass (mg cm−2) vs. ln(A0/AZ). Because the 1994 construction of the snow fence caused substantial increases in the annual accumulation of winter precipitation across the experimental site, we considered that 210Pb deposition rates also could have increased leeward of the snow fence after 1994.
Sediment or soil mass accumulation rates can be calculated using the CRS model, assuming a constant flux of 210Pb to the sediment, and this model allows changes in sedimentation rate to be identified graphically. In this case, the integrated activity of unsupported 210Pb in the profile is expressed as
where AZ is the cumulative unsupported 210Pb activity (Bq cm−2) below sediment depth Z
and A0 is the cumulative excess 210Pb (Bq cm−2) for the entire profile
where λ is the decay constant of 210Pb (0.03108 yr−1), CZ is the unsupported 210Pb activity (mBq g−1) in the core section at depth z, and ρz is the dry bulk density (g cm−3) of the core section at depth z. Unsupported 210Pb activity was obtained by subtracting the mean value of supported 210Pb as determined from deeper core sections exhibiting approximately constant total 210Pb vs. depth. Supported 210Pb activities in seven of the cores were calculated from four to ten deeper sections and ranged from 25 ± 4 to 37 ± 8 mBq g−1. An anomalously high value of 54 ± 7 mBq g−1 was determined for core INT-3 in which only two deeper sections were available for this calculation.
The approximate age t (years) of material at a given depth is given by
and the net mass accumulation rate (r) (mg cm−2 yr−1) is given by
where λ is the decay constant of 210Pb (0.03108 yr−1) and M is the slope of the line of cumulative dry mass (g cm−2) vs. ln(A0/Az). For the purpose of this study, we transformed cumulative dry mass to cumulative carbon mass by taking the product of the dry bulk density (g cm−3) and the weight percentage carbon for each 1-cm core segment and then integrating downward from top to bottom of the core profile. Simple modifications of the CRS model to account for step changes in carbon accumulation and 210Pb flux are presented and discussed below with reference to the data obtained in this study.
Calculation of unsupported 210Pb, 137Cs, and 7Be inventories
The inventories of unsupported 210Pb, 137Cs, and 7Be in each core were calculated as follows:
where I is the total inventory of each radionuclide (mBq cm−2), ρi is the bulk dry density of core segment i, Ai is the specific activity of each radionuclide in core segment i (mBq g−1), and Δzi is the thickness of core segment i (cm), and the sum is over all core segments.
Calculation of 210Pb depositional flux
The depositional flux of 210Pb for each core location is calculated as follows:
where Q is the depositional flux of 210Pb (mBq cm−2 yr−1), λ is the decay constant of 210Pb (0.03108 yr−1), and I is the unsupported 210Pb inventory (mBq cm−2) as calculated by Equation (6).
Results and discussion
The analytical results of this study are compiled in Supplementary Information Table S1.
Depth profiles for specific activities (mBq g−1) of unsupported 210Pb, 7Be, 137Cs, and 241Am are shown in . Soil organic C concentrations in cores from the study site ranged from a maximum of 40 to 47 weight percentage in the organic horizon (uppermost 4–15 cm of core). Vegetation (mainly sphagnum moss) and a minor amount of plant litter comprise the top 2 to 4 cm of most cores (Supplementary Figure S3), with the remaining organic layer consisting of variably compacted, partially humified plant material with minimal mineral content. Profiles of dry bulk density and weight percentage carbon vs. depth show that the organic layer has dry bulk density in the range of 0.05 to 0.2 g cm−3 and >30 weight percentage carbon (Supplementary Figures S4 and S5). Organic carbon decreases sharply below the organic layer in a 2- to 4-cm-thick transitional layer to about 2 to 5 weight percentage in the underlying fine-grained mineral horizon that has dry bulk density in the range from 0.8 to 1.4 g cm−3.
Figure 4. Activities (mBq g−1) of unsupported 210Pb, 7Be, 137Cs, and 241Am vs. depth (cm) in active layer soil core samples. Note different x-axis range of core profile DEEP-4
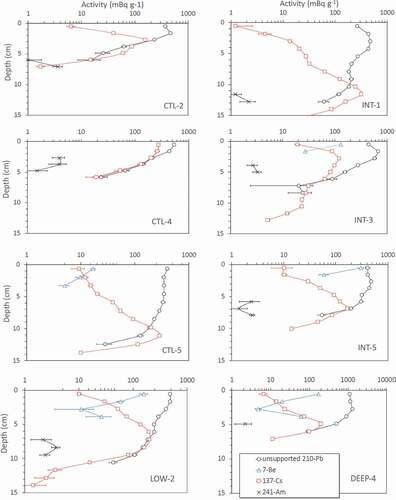
The activity of 7Be was measured only in five of the cores (those counted within a few months of collection). and in these cores it was found to have declining activity with depth in the upper 2 to 4 cm (). The disappearance of 7Be with depth generally corresponded to the observed maxima of unsupported 210Pb that ranged from 399 to 537 mBq g−1 in the control (CTL) cores, 488 mBq g−1 in the reduced snow depth (LOW) core, 476 to 681 mBq g−1 in the intermediate snow depth (INT) cores, and 1,305 mBq g−1 in the deep snow depth (DEEP) core. Unsupported 210Pb exceeded supported 210Pb in all cores by a factor of ten or more at the depth of maximum 210Pb activity. The activities of 137Cs were measured in all cores and each core had a well-defined maximum activity. Maximum activities occurred over a range of core segment depths from 0 to 1 cm up to 9 to 10 cm. Activities of 241Am were detectable in all but one core profile.
Carbon accumulation rates determined from 210Pb profiles
To obtain a net rate of soil organic carbon accumulation for each core profile, we evaluated the linear correlations of cumulative organic carbon (g cm−2) with ln(A0/AZ). We refer to this type of data analysis henceforth as a CRS plot. The slope of a best-fit linear regression between these two parameters in a typical CRS plot yields the net organic carbon accumulation rate. Changes in slope on a CRS plot may correspond to changes in net carbon accumulation rate. Carbon accumulation rates (mg cm−2 yr−1) derived from linear regression slopes are listed in with errors, along with the total inventories of unsupported 210Pb, 137Cs, and 7Be and the steady-state equivalent depositional fluxes of 210Pb.
Table 1. Carbon accumulation rates, radionuclide inventories, and 210Pb fluxes.a
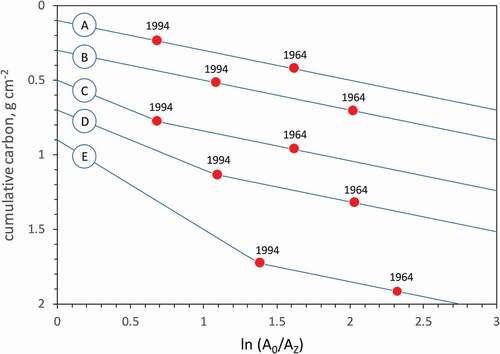
In order to assist our interpretation of the observed changes in slope observed in CRS regression lines for these cores, we did a simple numerical experiment (described in Supplementary Information Addendum and Table S2) to demonstrate the effects of step changes in arbitrary values of the net carbon accumulation rate and the 210Pb depositional flux on the chronologic records obtained from CRS plots. We evaluated hypothetical changes in these parameters corresponding with the time of construction of the snow fence in 1994; these are portrayed in a demonstrative plot (). Model A is a typical CRS model with a constant 210Pb depositional flux and a constant carbon accumulation rate. Also shown in model A are the calendar dates 1994 and 1964, corresponding to the time of snow fence construction and the peak time of bomb-pulse radionuclide fallout, respectively. Model B shows the effect of doubling the 210Pb flux after 1994 while maintaining a constant carbon accumulation rate; the slope of the line remains constant as in model A, but the calendar dates 1994 and 1964 occur at higher values of ln(A0/AZ). In model C, the 210Pb flux is held constant while the carbon accumulation rate is doubled after 1994. In this case there is a doubling of slope after 1994 while the calendar dates remain fixed at the same values of ln(A0/AZ) as found in model A. In model D, both the 210Pb flux and carbon accumulation rate are doubled after 1994, and the effects of these changes are a doubling of slope after 1994 as well as an increase in the values of ln(A0/AZ) corresponding to the calendar dates 1994 and 1964. Finally, in model E, both the 210Pb flux and carbon accumulation rate tripled after 1994, resulting in a further increase in slope and further increases in the values of ln(A0/AZ) corresponding to the calendar dates 1994 and 1964, in comparison with model C.
Figure 5. Hypothetical modifications of CRS models for simulated core profiles showing cumulative carbon (g cm−2) vs. ln(A0/AZ). Carbon accumulation rates (CAR) and 210Pb depositional fluxes were plotted with different arbitrary Y-intercept values to allow different models to be easily distinguished graphically, using equal values of CAR prior to 1994 in all models. Model A is a standard CRS model with 210Pb flux and CAR held constant. In model B, 210Pb flux is doubled after 1994 while CAR remains constant. In model C 210Pb flux remains constant and CAR is doubled after 1994. In model D both 210Pb flux and CAR are doubled after 1994. In model E both 210Pb flux and CAR are tripled after 1994
For our measured core profiles, we estimated carbon accumulation rates from the slopes of linear regressions and considered the 210Pb depositional flux as a fitting parameter that would allow the observed changes in slope to begin at a calendar date of 1995. This resulted in a fairly unique solution in terms of both carbon accumulation rate and the apparent change in 210Pb flux. In order to account for the expected near-surface downward mobility of 210Pb (Landis, Renshaw, and Kaste Citation2016), we excluded from our linear regressions any core segment in which 7Be was detected. In cores where 7Be was not measured, we excluded the top two core segments (top 2 cm) from the CRS plot regression analyses on the assumption that these were most likely affected by downward 210Pb mobility. The chronologies implied by the resulting modified CRS models are considered accurate only below the depth limit of significant downward 210Pb mobility (Landis, Renshaw, and Kaste Citation2016).
Individual modified CRS plots prepared for each of the measured core profiles are shown in . Three “control” cores (CTL prefix in sample ID) were collected. These sites were designated in the original experimental design to represent ambient snow conditions; that is, outside the leeward snowdrift influence of the snow fence. Two of these cores (CTL-2 and CTL-4) showed good linear correlations over the entire depth range in which unsupported 210Pb was present (), consistent with a constant 210Pb depositional flux and constant net organic carbon accumulation rates of 1.5 ± 0.1 to 1.7 ± 0.1 mg cm−2 yr−1 over the past ~100 years (). In these two cores, 241Am was detected in the core segment that would be expected to contain bomb-pulse radionuclides based on its estimated calendar date, supporting the validity of the chronologic record estimated from the bulk values of each core segment. However, the 137Cs peaks in these cores were found in segments well above the depth of 241Am, indicating likely mobility of 137Cs in the low-pH pore waters of the active layer. In core CTL-4, 241Am was also detected in segments having calendar dates after the bomb-pulse peak. The third control core CTL-5 was, contrary to expectation, apparently influenced by the snow fence because its modified CRS plot showed a substantial increase in slope after 1994 (). This core profile indicated that the carbon accumulation rate increased substantially after the construction of the snow fence (). The location of CTL-5 was ~65 m NNW of the western edge of the snow fence. Wind directions during winter at Toolik are generally southerly (katabatic winds), with occasional southeasterly or westerly trends (S. Sturm and Stuefer Citation2013). Occasional southeasterly winds during winter may thus have caused consistent snowdrift pile-up at CTL-5 following the snow fence construction. The unsupported 210Pb inventory in CTL-5 is higher than that in both CTL-1 and CTL-2 (). This further supports our interpretation of CTL-5 as being influenced by enhanced snow accumulation that was caused by the snow fence, because additional snow accumulation would be likely to cause an increase in the 210Pb depositional flux.
Figure 6. Modified CRS plots for measured core profiles showing cumulative organic carbon (g cm−2) vs. ln(A0/AZ). Note differences in ranges of x- and y-axis values. Dashed lines are best-fit linear regressions. Numerals adjacent to data points correspond to calendar years calculated from ln(A0/AZ). Net carbon accumulation rates (mg cm−2 yr−1) were obtained from slopes of regression lines. Data points having 7Be (detected or assumed) are excluded from regressions
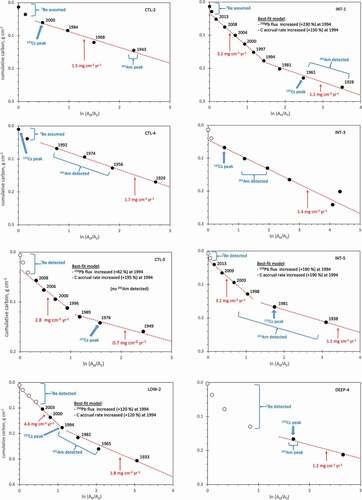
Most of the cores affected by enhanced snow accumulation leeward of the snow fence (i.e., CTL-5, LOW-2, INT-1, and INT-5) had modified CRS plots best described by two-slope models having a distinct change in slope at depth, with concomitant increases in net carbon accumulation rate and 210Pb depositional flux (). Two of the cores (INT-3 and DEEP-4) were difficult to fit with modified CRS models because they had insufficient numbers of core segments below the depth of measured 7Be activity with which to define values for two different slopes. For the cores having successful two-slope modified CRS models, the carbon accumulation rates were given by the slopes of the linear regressions, and the 210Pb fluxes were treated as a fit parameter that was adjusted to obtain a calendar date of 1995 for the change in slope. All of the two-slope models required increases in 210Pb flux (ranging from +82 to +310 percent) to fit a calendar date of 1995 for the change in slope. This implies that the increase in winter snow accumulation leeward of the snow fence was accompanied by a roughly proportional increase in 210Pb deposition or possibly that there had been an overall increase in 210Pb flux deposited by summer precipitation after 1994. A gradual increase in summer 210Pb flux in the tundra region may be likely as the thaw depth increases to allow more release of 222Rn from the active layer.
The portions of the successful two-slope modified CRS models corresponding to the period before the change in slope indicated net carbon accumulation rates ranging from 0.7 ± 0.1 to 1.8 ± 0.3 mg cm−2 yr−1, which bracket those obtained from the CRS models for the two control cores CTL-2 (1.5 ± 0.1 mg cm−2 yr−1) and CTL-4 (1.7 ± 0.1 mg cm−2 yr−1). The slopes of the two-slope modified CRS models beginning in 1995 (i.e., after snow fence construction) yielded uniformly larger carbon accumulation rates ranging from 2.8 ± 0.2 to 4.6 ± 0.3 mg cm−2 yr−1 (), roughly two to three times as much as those of the control cores.
Inventories of unsupported 210Pb, 137Cs, and 7Be
Total inventories and annual fluxes of unsupported 210Pb, 137Cs, and 7Be in the cores were calculated as described in the Methods section and are listed in . The total inventories of unsupported 210Pb range from 79 ± 2 to 481 ± 5 mBq cm−2. The values for control cores CTL-2 and CTL-4 (105 ± 3 and 79 ± 2 mBq cm−2, respectively) are in good agreement with unsupported 210Pb inventories obtained previously for sediments from Toolik Lake (75 mBq cm−2; Cornwell Citation1985) and for intertussock and ridgetop tundra soils (95 and 104 mBq cm−2, respectively) from the Imnavait Creek watershed, ~16 km east of Toolik Lake (Cooper et al. Citation1991). Mean annual 210Pb depositional fluxes obtained from our Toolik area cores ranged from 2.5 to 15.0 mBq cm−2 yr−1. Inventories and fluxes of 210Pb are lowest in control cores CTL-2 and CTL-4 (3.3 ± 0.1 and 2.5 ± 0.1 mBq cm−2 yr−1, respectively) and moderately higher in most cores affected by enhanced snow accumulation (3.8 ± 0.1 to 4.5 ± 0.1 mBq cm−2 yr−1), with an anomalously high value measured in core DEEP-4 (15.0 ± 0.2 mBq cm−2 yr−1), which is further discussed below. The general trend of these values is consistent with that expected from increased snow depth, which appears to be accompanied by a higher depositional flux of atmospheric 210Pb. However, because snow fence construction occurred in 1994, only one 210Pb half-life (approximately twenty-two years) had elapsed between snow fence construction in 1994 and our core sampling in 2016, so the observed total inventories and fluxes mainly reflect prevailing conditions prior to 1994. Using the modified CRS models that we generated for this study, we verified that the best-fit post-1994 increases in 210Pb depositional flux reproduced the observed increases in unsupported 210Pb inventories relative to those of the control cores. Calculated pre-1994 210Pb depositional fluxes obtained from our best-fit modified CRS model parameters ranged from 2.1 to 2.9 mBq cm−2 a−1, with a mean value of 2.6 ± 0.4, which is in reasonable agreement with the 210Pb depositional fluxes obtained from our measurements of unsupported 210Pb inventories for the control cores (2.5 ± 0.1 and 3.3 ± 0.1 mBq cm−2 a−1).
The 210Pb depositional fluxes that we derived from our measurements () are in good agreement with a range of values from other high-latitude studies. A study of fifty-five sediment cores from five small arctic lakes near our Toolik field site yielded fluxes ranging from 2.9 to 7.7 mBq cm−2 yr−1 (Fitzgerald et al. Citation2005). A global compilation of 210Pb depositional fluxes showed that the mean value at nine sites in 60° to 70° N latitude was 3.7 ± 3.5 mBq cm−2 yr−1 (Baskaran Citation2011). The 210Pb flux measured in Greenland ice cores Summit and Dye 3 ranged from 0.4 to 2.5 mBq cm−2 yr−1 (Dibb Citation1992).
The inventories of 137Cs in our cores ranged from 45 ± 1 to 104 ± 1 mBq cm−2. Values obtained for the control cores CTL-2 and CTL-4 (83 ± 1 and 57 ± 1 mBq cm−2, respectively) were within the range of those affected by the snow fence (45 ± 1 to 104 ± 1 mBq cm−2). These values agree well with 137Cs inventories measured in tundra samples collected in 1990 from the Imnavait Creek watershed (Cooper et al. Citation1995) that had a range of 42 to 97 mBq cm−2 (reported range of 77 to 177 mBq cm−2, corrected for twenty-six years of decay from 1990 to 2016). Cooper et al. (Citation1995) concluded that there was no evidence for widespread downslope 137Cs transport in the Imnavait Creek watershed, although they noted that the elevated 137Cs inventories in some of the Toolik Lake sediment cores near lake inlets indicated some apparent mobility. In several of our cores (INT-1, INT-5, CTL-5) 137Cs peaks were concordant with 210Pb chronologies, but most of the other cores showed apparent evidence for 137Cs mobility generally toward the surface. This may be attributable to the low pH of pore waters (<5) along with possible advective transport of dissolved Cs through pore water flow or surface runoff during the spring snowmelt season and possible uptake by plant roots. Further study of 137Cs activities in tundra pore waters and streams around Toolik Lake may provide useful constraints on the possible mechanism(s) and extent of 137Cs mobility in this system.
The inventories of 7Be in the cores affected by the snow fence ranged from 0.8 ± 0.1 to 16.2 ± 0.2 mBq cm−2, in remarkably good agreement with the range of 0.6 to 15.5 mBq cm−2 measured in tundra samples of the Imnavait Creek watershed (Cooper et al. Citation1991). The range of 7Be inventories in snowpack cores collected from that watershed in 1989 and 1990 was 1.0 to 8.1 mBq cm−2, similar to that measured in tundra samples. These inventories represent a subannual time period because of the relatively short (53 d) half-life of 7Be.
The anomalously high 7Be inventory of 16.2 ± 0.2 mBq cm−2 in core DEEP-4 is correlated with its anomalously high unsupported 210Pb inventory of 481 ± 5 mBq cm−2 (). This may indicate that short-term lateral advective water flow carrying particles having adsorbed 7Be and 210Pb into the local topographic lows (i.e., incipient thermokarst) that developed in the area of deepest snow accumulation. An additional factor that could help explain these anomalous values in core DEEP-4 is the observation of windblown leaves and surficial organic debris deposited leeward within 25 m of the snow fence in the deep snow zone (; M. D. Walker et al. Citation1999).
Summary and conclusions
The principal objective of this study was to evaluate the effect of deeper winter snow accumulation on the net accumulation rate of soil organic carbon in the active layer of moist acidic tussock tundra, following the construction of a snow fence in 1994 as part of the ITEX (Jones et al. Citation1998; Welker, Fahnestock, and Jones Citation2000; Welker et al. Citation2005; Jespersen et al. Citation2018). We explored the application of 210Pb as a chronometer to constrain decadal-scale carbon accumulation rates in the active layer. Based on the values we obtained from our modified CRS models for net soil organic carbon accumulation rates in the control cores and the pre-1994 portions of the other cores, we estimated the average background (i.e., ambient snow conditions) net soil organic carbon accumulation rate in the active layer of the study area at ~14 g C m−2 yr−1. Increases in winter snow depth over a period of twenty-two years (since construction of the snow fence in 1994) resulted in apparent increases of this rate at this site by ~90 to 310 percent to rates of ~26 to 44 g C m−2 yr−1. This represents a substantial increase in the soil carbon sink strength, as predicted by a number of climate warming models (e.g., Charman et al. Citation2013; Jiang et al. Citation2016; Chaudhary, Miller, and Smith Citation2017). Similar values of carbon accumulation rates were found in a chronologic study of soil profile TFS2 sampled ~50 m west of our study area (at a location where the dominant vegetation consisted of Sphagnum capillifolium, Aulacomnium turgidum, and Salix reticulata), which showed a substantial increase in carbon accumulation rate from ~14 g C m−2 yr−1 to ~43 g C m−2 yr−1 corresponding to an apparent ecosystem change from minerotrophic to oligotrophic conditions after the Little Ice Age at ~1850 CE (Taylor et al. Citation2019).
These results suggest that though deeper snow leads to elevated winter CO2 emissions, the positive effects of deeper snow on shrub growth, aboveground biomass and net CO2 fixation, and presumably greater root biomass collectively overcome the gaseous losses of C, leading to the positive net effect of increasing active layer soil carbon accumulation rates. This positive and negative feedback contest between ecosystem C losses (gaseous emissions) and gains (combinations of C fixation, biomass accumulation, and soil C formation) has been at the center of some of the earliest studies of tundra responses to changes in conditions with ITEX (Welker et al. Citation1997). The findings in this study suggest that over decades of deeper snow in winter, soil carbon accumulations of tussock tundra will be appreciably greater due in large part to vegetation changes associated with shrub growth and elevated soil carbon inputs (M. Sturm et al. Citation2005; Tape et al. Citation2012; Lynch et al. Citation2018) and lower organic matter decomposition rates as soil water content increases with snow (Blanc-Betes et al. Citation2016), even though CO2 emissions in winter are higher.
However, abiotic and biotic interactions may change the magnitude, extent, redistribution, and even longer-term net effect of this increased soil carbon sink. For instance, thawing of previously frozen soils may initially stimulate rates of microbial degradation of organic carbon, and as accessible carbon pools are depleted over time and soil conditions change, microbial communities may shift toward more effective decomposition and metabolic strategies (Ricketts et al. Citation2016; Melillo et al. Citation2017). Competing rates of soil methanogenesis versus respiration, which respectively emit CH4 and CO2 to the atmosphere, depend in large part on whether the soils are wet or dry (Blanc-Betes et al. Citation2016). These changes in soil carbon accumulation will not occur in isolation from other climate change–induced effects. Permafrost thaw may change the ecohydrology of the system (Blanc-Betes et al. Citation2016; Throckmorton et al. Citation2016; Jespersen et al. Citation2018), and an even greater dominance of the landscape by shrubs with more leaf area will continue to increase carbon fixation (Leffler et al. Citation2016; Lynch et al. Citation2018), leading to greater carbon allocation to roots. Denser shrub canopies may cause shading and soil cooling, countering greater soil carbon emissions (Mekonnen, Riley, and Grant Citation2018) and amplifying the biocomplexity of the tussock tundra’s response to climate change (D. A. Walker, Epstein, and Welker Citation2008; Flower et al. Citation2019).
The multidecadal net effect of the complex ecohydrologic interactions in the arctic tundra are difficult to predict (Welker et al. Citation1997). The gradual expansion of shrubs along with the effects of warmer winters on the duration and magnitude of winter snowpack may add to the longer-term complexity of carbon source–sink relations in this arctic ecosystem (Fahnestock et al. Citation1999; Natali, Watts, and Rogers et al. Citation2019). Nonetheless, it is likely that the rapid climate change now being observed in the Arctic will continue, and the consequences of changing winter snow depth accompanying climate change will likely be one of the most important factors in the future evolution of the arctic ecosystem (Welker, Fahnestock, and Jones Citation2000; Natali et al. Citation2019). The approach demonstrated here may provide a new tool for better understanding of the response of the arctic tundra’s soil organic carbon inventory to the changing climate.
Supplemental Material
Download Zip (21.8 MB)Acknowledgments
We thank the staff of the Toolik Field Station and CH2MHill Polar Services for logistical support, and we are grateful to the anonymous reviewers for their insightful and constructive comments on an earlier version of this article.
Disclosure statement
No potential conflict of interest was reported by the authors.
Supplemental Material
Supplemental data for the article can be accessed on the publisher’s website
Additional information
Funding
References
- Abril, J.-M., and F. Gharbi. 2012. Radiometric dating of recent sediments: Beyond the boundary conditions. Journal of Paleolimnology 48 (2):449–60. doi:https://doi.org/10.1007/s10933-012-9622-5.
- Appleby, P. G., and F. Oldfield. 1978. The concentration of lead-210 dates assuming a constant rate of supply of unsupported 210Pb to the sediment. Catena 5 (1):1–8. doi:https://doi.org/10.1016/S0341-8162(78)80002-2.
- Baskaran, M. 2011. Po-210 and Pb-210 as atmospheric tracers and global atmospheric Pb-210 fallout: A review. Journal of Environmental Radioactivity 102 (5):500–13. doi:https://doi.org/10.1016/j.jenvrad.2010.10.007.
- Bintanja, R., and F. M. Selten. 2014. Future increases in Arctic precipitation linked to local evaporation and sea-ice retreat. Nature 509 (7501):479–82. doi:https://doi.org/10.1038/nature13259.
- Bintanja, R., and O. Andry. 2017. Towards a rain-dominated Arctic. Nature Climate Change 7 (4):263–67. doi:https://doi.org/10.1038/nclimate3240.
- Blanc-Betes, E., J. M. Welker, N. C. Sturchio, J. P. Chanton, and M. A. Gonzalez-Meler. 2016. Winter precipitation and snow accumulation drive the methane sink or source strength of Arctic tussock tundra. Global Change Biology 22 (8):2818–33. doi:https://doi.org/10.1111/gcb.13242.
- CANMET. 2017. DL-1A Certificate of analysis, certified reference material: Uranium-thorium ore. Available at: https://www.nrcan.gc.ca/our-natural-resources/minerals-and-mining/mining-resources/certified-reference-materials/price-certificates-list/dl-1a-certificate-analysis/8049
- Chapin, F. S., and G. R. Shaver. 1985. Individualistic growth response of tundra plant species to environmental manipulations in the field. Ecology 66 (2):564–76. doi:https://doi.org/10.2307/1940405.
- Charman, D. J., D. W. Beilman, M. Blaauw, R. K. Booth, S. Brewer, F. M. Chambers, J. A. Christen, A. Gallego-Sala, S. P. Harrison, and P. D. M. Hughes. 2013. Climate-related changes in peatland carbon accumulation during the last millennium. Biogeosciences 10 (2):929–44. doi:https://doi.org/10.5194/bg-10-929-2013.
- Chaudhary, M., P. A. Miller, and B. Smith. 2017. Modelling past, present and future peatland carbon accumulation across the pan-Arctic region. Biogeosciences 14 (18):4023–44. doi:https://doi.org/10.5194/bg-14-4023-2017.
- Cooper, L. W., C. R. Olsen, D. K. Solomon, I. L. Larsen, R. B. Cook, and J. M. Grebmeier. 1991. Stable isotopes of oxygen and natural and fallout radionuclides used for tracing runoff during snowmelt in an Arctic watershed. Water Resources Research 27 (9):2171–79. doi:https://doi.org/10.1029/91WR01243.
- Cooper, L. W., J. M. Grebmeier, I. L. Larsen, C. Solis, and C. R. Olsen. 1995. Evidence for redistribution of 137Cs in Alaskan tundra, lakes, and marine sediments. Science of the Total Environment 160/161:295–306. doi:https://doi.org/10.1016/0048-9697(95)04364-7.
- Cornwell, J. C. 1985. Sediment accumulation rates in an Alaskan arctic lake using a modified 210Pb technique. Canadian Journal of Fisheries and Aquatic Science 42 (4):809–14. doi:https://doi.org/10.1139/f85-103.
- Csank, A. Z., C. I. Czimczik, X. Xu, and J. M. Welker. 2019. Seasonal patterns of riverine carbon sources and export in NW Greenland. Journal of Geophysical Research: Biogeosciences 124. doi:https://doi.org/10.1029/2018JG004894.
- Czimczik, C. I., and J. M. Welker. 2010. Radiocarbon content of CO2 respired from high Arctic tundra in Northwest Greenland. Arctic, Antarctic, and Alpine Research 42 (3):342–50. doi:https://doi.org/10.1657/1938-4246-42.3.342.
- Davies, L. J., P. Appleby, B. J. L. Jensen, G. Magnan, G. Mullan-Boudreau, T. Noernberg, B. Shannon, W. Shotyk, S. van Bellen, and C. Zaccone. 2018. High-resolution age modelling of peat bogs from northern Alberta, Canada, using pre- and post-bomb 14C, 210Pb, and historical cryptophera. Quaternary Geochronology 47:138–62. doi:https://doi.org/10.1016/j.quageo.2018.04.008.
- Dibb, J. E. 1992. The accumulation of 210Pb at Summit, Greenland since 1855. Tellus 44B (1):72–79. doi:https://doi.org/10.3402/tellusb.v44i1.15427.
- Dörr, H., and K. O. Münnich. 1989. Downward movement of soil organic matter and its influence on trace-element transport (210Pb, 137Cs) in the soil. Radiocarbon 31 (3):655–83. doi:https://doi.org/10.1017/S003382220001225X.
- Dörr, H., and K. O. Münnich. 1991. Lead and cesium transport in European forest soils. Water, Air, and Soil Pollution 57-58 (1):809–18. doi:https://doi.org/10.1007/BF00282944.
- Elmendorf, S. C., G. H. R. Henry, R. D. Hollister, R. G. Björk, N. Boulanger-Lapointe, E. J. Cooper, J. H. C. Cornelissen, T. A. Day, E. Dorrepaal, and T. G. Elumeeva. 2012. Plot-scale evidence of tundra vegetation change and links to recent summer warming. Nature Climate Change 2 (6):453–57. doi:https://doi.org/10.1038/nclimate1465.
- Fahnestock, J. T., M. H. Jones, P. D. Brooks, and J. M. Welker. 1999. Significant CO2 emissions from tundra soils during winter: Implications for annual carbon budgets of arctic communities. Global Biogeochemical Cycles 13 (3):775–79. doi:https://doi.org/10.1029/1999GB900006.
- Fitzgerald, W. F., D. R. Engstrom, C. H. Lamborg, C.-M. Tseng, P. H. Balcom, and C. R. Hammerschmidt. 2005. Modern and historic atmospheric mercury fluxes in Northern Alaska: Global sources and Arctic depletion. Environmental Science and Technology 39 (2):557–68. doi:https://doi.org/10.1021/es049128x.
- Flower, C. E., J. E. Dalton, C. J. Whelan, J. S. Brown, and M. A. Gonzalez-Meler. 2019. Patch use in the arctic ground squirrel: Effects of micro-topography and shrub encroachment in the Arctic Circle. Oecologia 190 (1):243–54. doi:https://doi.org/10.1007/s00442-019-04400-5.
- Gallego-Sala, A. V., D. J. Charman, S. Brewer, S. E. Page, I. C. Prentice, P. Friedlingstein, S. Moreton, M. J. Amesbury, D. W. Beilman, and S. Björck. 2018. Latitudinal limits to the predicted increase of the peatland carbon sink with warming. Nature Climate Change 8 (10):907–13. doi:https://doi.org/10.1038/s41558-018-0271-1.
- Gonzalez-Meler, M. A., A. Poghosyan, Y. Sanchez-de Leon, E. D. de Olivera, R. J. Norby, and N. C. Sturchio. 2018. Does elevated atmospheric CO2 affect soil carbon burial and soil weathering in a forest ecosystem? PeerJ 6:e5356. doi:https://doi.org/10.7717/peerj.5356.
- Henry, G. H. R., and U. Molau. 1997. Tundra plants and climate change: The International Tundra Experiment (ITEX). Global Change Biology 3 (S1):1–9. doi:https://doi.org/10.1111/j.1365-2486.1997.gcb132.x.
- Jespersen, R. G., A. J. Leffler, S. F. Oberbauer, and J. M. Welker. 2018. Arctic plant ecophysiology and water source utilization in response to altered snow: Isotopic (δ18O and δ2H) evidence for meltwater subsidies to deciduous shrubs. Oecologia 187 (4):1009. doi:https://doi.org/10.1007/s00442-018-4196-1.
- Jiang, Y., Q. Zhuang, S. Sitch, J. A. O’Donnell, D. Kicklighter, A. Sokolov, and J. Melillo. 2016. Importance of soil thermal regime in terrestrial ecosystem carbon dynamics in the circumpolar north. Global and Planetary Change 142:28–40. doi:https://doi.org/10.1016/j.gloplacha.2016.04.011.
- Jones, M. H., J. T. Fahnestock, D. A. Walker, M. D. Walker, and J. M. Welker. 1998. Carbon dioxide fluxes in moist and dry arctic tundra during the snow-free season: Responses to increases in summer temperature and winter snow accumulation. Arctic and Alpine Research 30 (4):373–80. doi:https://doi.org/10.1080/00040851.1998.12002912.
- Kaste, J. M., A. M. Heimsath, and B. C. Bostick. 2007. Short-term soil mixing quantified with fallout radionuclides. Geology 35 (3):243–46. doi:https://doi.org/10.1130/G23355A.1.
- Kaste, J. M., B. C. Bostick, A. M. Heimsath, E. Steinnes, and A. J. Friedland. 2011. Using atmospheric fallout to date organic horizon layers and quantify metal dynamics during decomposition. Geochimica et Cosmochimica Acta 75 (6):1642–61. doi:https://doi.org/10.1016/j.gca.2011.01.011.
- Landis, J. D., C. E. Renshaw, and J. M. Kaste. 2014. Quantitative retention of atmospherically deposited elements by native vegetation is traced by the fallout radionuclides 7Be and 210Pb. Environmental Science and Technology 48 (20):12022–30. doi:https://doi.org/10.1021/es503351u.
- Landis, J. D., C. E. Renshaw, and J. M. Kaste. 2016. Beryllium-7 and lead-210 chronometry of modern soil processes: The Linked Radionuclide aCcumulation model, LRC. Geochimica et Cosmochimica Acta 180:109–25. doi:https://doi.org/10.1016/j.gca.2016.02.013.
- Leffler, A. J., E. S. Klein, S. F. Oberbauer, and J. M. Welker. 2016. Coupled long-term summer warming and deeper snow alters species composition and stimulates gross primary productivity in tussock tundra. Oecologia 181 (1):287–97. doi:https://doi.org/10.1007/s00442-015-3543-8.
- Lehn, G. O., A. D. Jacobson, T. A. Douglas, J. W. McLelland, A. J. Barker, and M. S. Khosh. 2017. Constraining seasonal active layer dynamics and chemical weathering reactions occurring in North Slope Alaskan watersheds with major ion and isotope measurements. Geochimica et Cosmochimica Acta 217:399–420. doi:https://doi.org/10.1016/j.gca.2017.07.042.
- Lupascu, M., C. I. Czimczik, M. C. Welker, L. A. Ziolkowski, E. J. Cooper, and J. M. Welker. 2018. Winter ecosystem respiration and sources of CO2 from the high Arctic tundra of Svalbard: Response to a deeper snow experiment. Journal of Geophysical Research: Biogeosciences 123:2627–42. doi:https://doi.org/10.1029/2018JG004396.
- Lupascu, M., J. M. Welker, U. Seibt, K. Maseyk, X. Xu, and C. I. Czimczik. 2014. High Arctic wetting reduces permafrost carbon feedbacks to climate warming. Nature Climate Change 4 (1):51–55. doi:https://doi.org/10.1038/nclimate2058.
- Lynch, L. M., M. B. Machmuller, M. F. Cotrufo, E. A. Paul, and M. D. Wallenstein. 2018. Tracking the fate of fresh carbon in the Arctic tundra: Will shrub expansion alter responses of soil organic matter to warming? Soil Biology and Biochemistry 120:134–44. doi:https://doi.org/10.1016/j.soilbio.2018.02.002.
- Martens, J., B. Wild, C. Pearce, T. Tesi, A. Andersson, L. Broder, M. O'Regan, M. Jakobsson, M. Skold, L. Gemery, et al. 2018. Remobilization of old permafrost carbon to Chukchi Sea sediments during the end of the last deglaciation. Global Biogeochemical Cycles 33. doi:https://doi.org/10.1029/2018GB005969.
- Matamala, R., F. J. Calderón, J. D. Jastrow, Z. Fan, S. M. Hofmann, G. J. Michaelson, U. Mishra, and C. L. Ping. 2017. Influence of site and soil properties on the DRIFT spectra of northern cold-region soils. Geoderma 305:80–91. doi:https://doi.org/10.1016/j.geoderma.2017.05.014.
- Mekonnen, Z. A., W. J. Riley, and R. F. Grant. 2018. 21st century tundra shrubification could enhance net carbon uptake of North America Arctic tundra under an RCP8.5 climate trajectory. Environmental Research Letters 13 (5):054029. doi:https://doi.org/10.1088/1748-9326/aabf28.
- Melillo, J. M., S. D. Frey, K. M. Deangelis, W. J. Werner, M. J. Bernard, F. P. Bowles, G. Pold, M. A. Knorr, and A. S. Grandy. 2017. Long-term pattern and magnitude of soil carbon feedback to the climate system in a warming world. Science 358 (6359):101–05. doi:https://doi.org/10.1126/science.aan2874.
- Miller, O. 2014. Changes in tundra plant and soil organic geochemical composition in response to long-term increased winter precipitation in N. Alaska. Unpublished MS Thesis, Purdue University, 126. https://docs.lib.purdue.edu/open_access_theses/655.
- Mishra, U., B. Drewniak, J. D. Jastrow, and R. M. Matamala. 2017. Spatial representation of organic carbon and active-layer thickness of high latitude soils in CMIP5 earth system models. Geoderma 300:55–63. doi:https://doi.org/10.1016/j.geoderma.2016.04.017.
- Mook, W. G., and J. J. DeVries. 2001. Environmental isotopes in the hydrological cycle: Principles and applications. In Introduction, theory, methods, review. Ch. 13 – Errors, means, and fits, Vol. I, series ed. W. M. Mook, 243–56. Paris/Vienna: IAEA/UNESCO. www.iaea.org
- Natali, S. M., J. Watts, B. M. Rogers, S. Potter, S. M. Ludwig, A-K. Selbmann, P. F. Sullivan, B. W. Abbott, K. A. Arndt, L. Birch, et al. 2019. Large loss of CO2 in winter observed across pan-Arctic permafrost region. Nature Climate Change. doi:https://doi.org/10.1038/s41558-019-0592-8.
- NIST. 1997. Certificate for standard reference material 4357, ocean sediment radioactivity standard. Available at: www-s.nist.gov/srmors/certificates/4357.pdf.
- NOAA. 2019. Arctic report card: Update for 2019. Available at: https://arctic.noaa.gov/Report-Card.
- Nowinski, N. S., L. Taneva, S. E. Trumbore, and J. M. Welker. 2010. Decomposition of old organic matter as a result of deeper active layers in a snow depth manipulation experiment. Oecologia 163 (3):785–92. doi:https://doi.org/10.1007/s00442-009-1556-x.
- Olid, C., D. Diego, J. Garcia-Orellana, A. M. Cortizas, and J. Klaminder. 2016. Modeling the downward transport of 210Pb in Peatlands: Initial Penetration‐Constant Rate of Supply (IP-CRS) model. Science of the Total Environment 541:1222–31. doi:https://doi.org/10.1016/j.scitotenv.2015.09.131.
- Pattison, R. R., and J. M. Welker. 2014. Differential ecophysiological response of deciduous shrubs and a graminoid to long-term experimental snow reductions and additions in moist acidic tundra, Northern Alaska. Oecologia 174 (2):339–50. doi:https://doi.org/10.1007/s00442-013-2777-6.
- Ricketts, M. P., R. S. Poretsky, J. M. Welker, and M. Gonzalez-Meler. 2016. Soil bacterial community and functional shifts in response to altered snowpack in moist acidic tundra of Northern Alaska. Soil 2 (3):459–74. doi:https://doi.org/10.5194/soil-2-459-2016.
- Robbins, J. A. 1978. Geochemical and geophysical applications of radioactive lead. In The biogeochemistry of lead in the environment, Volume 1A, ed. J. O. Nriagu, 285–393. Amsterdam: Elsevier/North Holland Biomedical Press.
- Robbins, J. A., and D. N. Edgington. 1975. Determination of recent sedimentation rates in Lake Michigan using Pb-210 and Cs-137. Geochimica et Cosmochimica Acta 39 (3):285–304. doi:https://doi.org/10.1016/0016-7037(75)90198-2.
- Schaeffer, S. M., E. Sharp, J. P. Schimel, and J. M. Welker. 2013. Soil-plant N processes in a High Arctic ecosystem, NW Greenland are altered by long-term experimental warming and higher rainfall. Global Change Biology 19 (11):3529–39. doi:https://doi.org/10.1111/gcb.12318.
- Schimel, J. P., C. Bilbrough, and J. M. Welker. 2004. Increased snow depth affects microbial activity and nitrogen mineralization in two Arctic tundra communities. Soil Biology and Biochemistry 36 (2):217–27. doi:https://doi.org/10.1016/j.soilbio.2003.09.008.
- Shotyk, W., H. Kempter, M. Krachler, and C. Zaccone. 2015. Stable (206Pb, 207Pb, 208Pb) and radioactive (210Pb) lead isotopes in one year of growth of Sphagnum moss from four ombrotrophic bogs in southern Germany: Geochemical significance and environmental implications. Geochimica et Cosmochimica Acta 163:101–25. doi:https://doi.org/10.1016/j.gca.2015.04.026.
- Sturm, M., J. Schimel, G. Michaelson, J. M. Welker, S. F. Oberbauer, G. Liston, J. T. Fahnestock, and V. E. Romanovsky. 2005. Winter biological processes could help convert arctic tundra to shrubland. Bioscience 55 (1):17–26. doi:https://doi.org/10.1641/0006-3568(2005)055[0017:WBPCHC]2.0.CO;2.
- Sturm, S., and S. Stuefer. 2013. Wind-blown flux rates derived from drifts at arctic snow fences. Journal of Glaciology 59 (213):21–34. doi:https://doi.org/10.3189/2013JoG12J110.
- Tape, K. D., M. Hallinger, J. M. Welker, and R. W. Ruess. 2012. Landscape heterogeneity of shrub expansion in Arctic Alaska. Ecosystems 15 (5):711–24. doi:https://doi.org/10.1007/s10021-012-9540-4.
- Taylor, L. S., G. T. Swindles, P. J. Morris, M. Galka, and S. M. Green. 2019. Evidence for ecosystem state shifts in Alaskan continuous permafrost peatlands in response to recent warming. Quaternary Science Reviews 207:134–44. doi:https://doi.org/10.1016/j.quascirev.2019.02.001.
- Throckmorton, H. M., B. D. Newman, J. M. Heikoop, G. B. Perkins, X. Feng, D. E. Graham, D. O’Malley, V. V. Vesselinov, J. Young, S. D. Wullschleger, et al. 2016. Active layer hydrology in an arctic tundra ecosystem: Quantifying water sources and cycling using water stable isotopes. Hydrological Processes 30 (26):4972–86. doi:https://doi.org/10.1002/hyp.10883.
- Urban, N. R., S. J. Eisenreich, D. F. Grigal, and K. T. Schurr. 1990. Mobility and diagenesis of Pb and 210Pb in peat. Geochimica et Cosmochimica Acta 54 (12):3329–46. doi:https://doi.org/10.1016/0016-7037(90)90288-V.
- Vitharana, U. W., U. Mishra, J. D. Jastrow, R. Matamala, and Z. Fan. 2017. Observational needs for estimating Alaskan soil carbon stocks under current and future climate. Journal of Geophysical Research: Biogeosciences 122:415–29.
- Walker, D. A., H. E. Epstein, and J. M. Welker. 2008. Introduction to the special section: Biocomplexity in Arctic terrestrial environments. Journal of Geophysical Research 113 (G3):G03S00. doi:https://doi.org/10.1029/2008JG000740.
- Walker, M. D., D. A. Walker, J. M. Welker, A. M. Arft, T. Bardsley, P. D. Brooks, J. T. Fahnestock, M. H. Jones, M. Losleben, A. N. Parsons, et al. 1999. Long-term experimental manipulation of winter snow regime and summer temperature in arctic and alpine tundra. Hydrological Processes. 13 (14–15):2315–30. doi:https://doi.org/10.1002/(SICI)1099-1085(199910)13:14/15<2315::AID-HYP888>3.0.CO;2-A.
- Welker, J. M., J. T. Fahnestock, and M. H. Jones. 2000. Annual CO2 flux in dry and moist Arctic tundra: Field responses to increase in summer temperatures and winter snow depth. Climate Change 44 (1/2):139–50. doi:https://doi.org/10.1023/A:1005555012742.
- Welker, J. M., J. T. Fahnestock, P. F. Sullivan, and R. A. Chimner. 2005. Leaf mineral nutrition of arctic plants in response to long-term warming and deeper snow in N. Alaska. Oikos 109 (1):167–77. doi:https://doi.org/10.1111/j.0030-1299.2005.13264.x.
- Welker, J. M., U. Molau, A. N. Parsons, C. Robinson, and P. A. Wookey. 1997. Response of Dryas octopetala to ITEX manipulations: A synthesis with circumpolar comparisons. Global Change Biology 3 (S1):61–73. doi:https://doi.org/10.1111/j.1365-2486.1997.gcb143.x.
- Zhang, X., J. He, J. Zhang, I. Polyakov, R. Gerdes, J. Inoue, and P. Wu. 2013. Enhanced poleward moisture transport and amplified northern high-latitude wetting trend. Nature Climate Change 3 (1):47–51. doi:https://doi.org/10.1038/nclimate1631.