
ABSTRACT
We assessed the response of Salix richardsonii, a deciduous shrub, to climate change by determining the combination of climatic factors that regulated its growth over the past half-century. We tested whether increasing arctic temperatures promote shrub growth and increased cover. We analyzed fifty-four stems (out of seventy sampled) from S. richardsonii shrubs near the Walker Bay research station in Nunavut, Canada (68°21′ N, 108°05′ W) and surveyed shrub cover in 1996 and 2010. We measured annual growth rings, removed the age-related pattern, and used a response function analysis to explore the climate–growth relationship. The standardized chronology was positively associated with mean July temperature, corroborating other evidence that summer temperature is an important driver of shrub radial growth. Basal area increment revealed a long-term increase in radial growth, although it has stabilized this century. Surveys showed no significant increase in shrub cover at Walker Bay from 1996 to 2010. Our results support a growing body of evidence that increased shrub growth does not necessarily translate into a prolonged increase in shrub cover. Instead, we conclude that the heterogeneity of the arctic shrub response to climate change may be associated with variation in the proximate factors limiting recruitment such as water table saturation and herbivory.
Introduction
Global climate change is altering ecosystem dynamics and function, especially in the Arctic region (ACIA Citation2005; Macias-Fauria et al. Citation2012; Intergovernmental Panel on Climate Change Citation2013; Van der Kolk et al. Citation2016). Compared to other ecosystems, tundra is experiencing a substantial air temperature increase and more extreme precipitation events (e.g., Hinzman et al. Citation2005). Concurrent with this climate change, most of the Arctic is “greening,” as evidenced by increases in the Normalized Difference Vegetation Index (NDVI; Raynolds et al. Citation2008; Verbyla Citation2008; Ju and Masek Citation2016; Bonney, Danby, and Treitz Citation2018). Field surveys indicate that shrub cover increase is a major driver of the greening across the Arctic (Tape, Sturm, and Racine Citation2006; Forbes, Fauria, and Zetterbergs Citation2010; Blok, Schaepman-Strub et al. Citation2011; Myers-Smith et al. Citation2011; Ropars and Boudreau Citation2012). However, in other regions of the Arctic, disturbances such as extreme climatic events, defoliating insects, and fire can lead to a decrease of the primary productivity, a phenomenon better known as the “browning” of the Arctic (Jepsen et al. Citation2013; Bjerke et al. Citation2014; Phoenix and Bjerke Citation2016). Determining where and why the Arctic is greening or browning is foundational to our understanding of global change.
Pan-Arctic estimates of shrub expansion are based on overall correlations with temperature, precipitation, and NDVI (Walker Citation1987; Sturm et al. Citation2005; Blok, Schaepman-Strub et al. Citation2011; Loranty, Goetz, and Beck 2011; Bonney, Danby, and Treitz Citation2018). Shrub expansion is, however, heterogeneous at the circumpolar scale (Raynolds et al. Citation2008; Myers-Smith et al. Citation2011; Tape et al. Citation2012; Bonney, Danby, and Treitz Citation2018), so that these large-scale correlations can be poor predictors of site-specific dynamics when they are not causal relationships (e.g., Bradford et al. Citation2014). Consequently, estimates of pan-Arctic shrub expansion require thorough field data to identify why shrub expansion is heterogeneous. For example, an increase in radial growth might not lead to an increase in shrub cover if recruitment is inhibited by local factors (Sturm et al. Citation2005). An imperfect relationship at small scales is possible even if data from ground surveys across large spatial scales suggest that increases in shrub cover are correlated with higher radial growth (Sturm et al. Citation2005; Forbes, Fauria, and Zetterbergs Citation2010; Hallinger, Manthey, and Wilmking Citation2010; Boelman et al. Citation2011; Büntgen et al. Citation2015). It is therefore important to further document temporal patterns in shrub cover as well as spatial variation in the combination of climate factors influencing growth and recruitment (Myers-Smith et al. Citation2011; Myers-Smith, Elmendorf et al. Citation2015).
Site-specific relationships between climate and shrub radial growth can be assessed by using dendrochronological techniques that allow the study of growth ring formation in woody species. Previous dendrochronological studies on shrub species in the Arctic revealed that summer temperature and/or precipitation are important drivers of shrub growth (Myers-Smith, Elmendorf et al. Citation2015; Ropars et al. Citation2015; Young et al. Citation2016; Weijers et al. Citation2018; Ackerman et al. Citation2018). Warmer summer temperature can lead to higher photosynthetic rate, lengthen the growing season, and indirectly increase nutrient availability through a positive impact on nutrient mineralization (Chapin Citation1983; Chapin, Matson, and Vitousek Citation2011). On the other hand, warmer summer temperatures can lead to hydric stresses triggered by greater evapotranspiration rates (Fritts Citation1976; Chapin Citation1983). Empirical data suggest that the relationship between a shrub’s radial growth and climate variables was stronger at sites with higher satellite-derived estimates of soil moisture (Myers-Smith, Elmendorf et al. Citation2015), although Ropars et al. (Citation2017) argued that such observations might result from differences in the sampling protocol (stems vs. root collars). Hydric stress can halt cell expansion and division and reduce the rates of photosynthesis, thereby limiting radial growth (Fritts Citation1976; Słupianek, Wojtuń, and Myśkow Citation2019). Given the aridity of many Arctic regions, a warmer climate regime could exacerbate this hydric stress and decouple the relationship between temperature and radial growth (Zalatan and Gajewski Citation2006; Verbyla Citation2008; McKenney et al. Citation2011; Bjorkman et al. Citation2018). We address this theme by evaluating the causal factors influencing Salix richardsonii growth and its correlation with shrub cover in Canada’s central Arctic.
Salix shrub species are widely distributed throughout the Arctic (Bret-Harte, Shaver, and Chapin Citation2002; Walker et al. Citation2006; Elmendorf et al. Citation2012; Büntgen et al. Citation2015), which make them suitable indicators to assess the effects of global warming on terrestrial ecosystems. The dendrochronological potential of Salix species has already been demonstrated by studies on S. richardsonii (Walker Citation1987), S. lanata (Forbes, Fauria, and Zetterbergs Citation2010), S. pulchra (Blok, Sass-Klaassen et al. Citation2011; Weijers et al. Citation2018), S. glauca (Young et al. Citation2016; Gamm et al. Citation2018), S. herbacea (Büntgen et al. Citation2015), S. polaris (Buchwal et al. Citation2019), and S. arctica (Woodcock and Bradley Citation1994; Schmidt, Baittinger, and Forchhammer Citation2006; Schmidt et al. Citation2010; Buchwal et al. Citation2019). Their growth chronologies exhibit a strong climate signal (temperature or precipitation), but only Forbes, Fauria, and Zetterbergs (Citation2010) reported a long-term positive trend in S. lanata growth. Moreover, because Salix shrubs are dioecious, males and females may display differential climate sensitivity because females are thought to allocate more resources to reproduction (Sakai, Sasa, and Sakai Citation2006) and may have fewer resources left over for radial growth (Nissinen et al. Citation2016; Gouker et al. Citation2020; but see Schmidt et al. Citation2010).
In this study, we sampled S. richardsonii stems in order to explore trends in the annual radial growth of this poorly studied species (most recent study: Walker Citation1987) near Walker Bay (Nunavut, Canada), which is an understudied region (Myers-Smith, Elmendorf et al. Citation2015). We also conducted two field surveys to evaluate shrub cover changes over the last two decades. Our main objectives were to answer the following research questions: (1) What are the drivers of S. richardsonii radial growth? (2) Does radial growth differ between males and females? (3) Can we detect a long-term trend in S. richardsonii radial growth? and (4) Has shrub cover changed at our study site? Based on the current literature (Liang and Eckstein Citation2009; Forbes, Fauria, and Zetterbergs Citation2010; Hallinger, Manthey, and Wilmking Citation2010; Hantemirov et al. Citation2011; Boudreau and Villeneuve-Simard Citation2012; Myers-Smith, Elmendorf et al. Citation2015; Ropars et al. Citation2015, Citation2017; Young et al. Citation2016), we predict that radial growth of S. richardsonii will be positively associated with summer temperature. We expect that radial growth of male shrubs will be higher than for female shrubs because of differences in the resources allocated to reproduction. We also expect to observe a long-term increase in S. richardsonii radial growth in response to warmer summer temperatures since the 1950s. Finally, we predict that shrub cover will have increased over the last two decades in response to warmer temperatures.
Methods
Study species, study site, and climate data
Salix richardsonii is a widely distributed North American shrub species. From Alaska, it extends eastward across northern Canada to Baffin Island. It grows in a variety of habitats such as floodplains, river terraces, and wet meadows, as well as on drumlin fields and gravel ridges (Argus Citation2004), and displays notable phenotypic variation associated with local climate conditions (Walker Citation1987; Argus Citation2004).
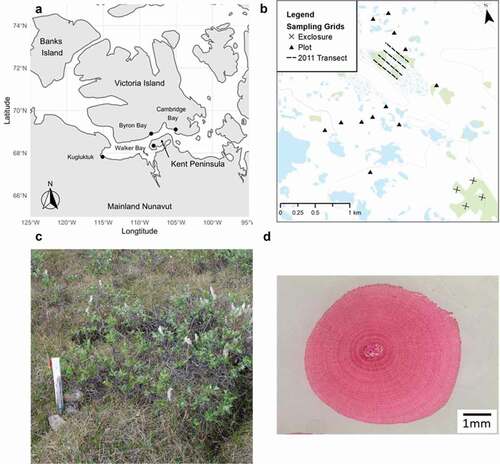
We conducted field surveys and collected stems of S. richardsonii near Walker Bay on the Kent Peninsula in Nunavut, Canada (68°21′ N, 108°05′ W; and ). This species is unevenly distributed across the landscape in patches that can be up to 0.2 km2. The relatively flat landscape at Walker Bay is characterized by a mosaic of xeric upland hummocks covered with Dryas integrifolia, S. arctica, S. richardsonii, and other shrub species that grade into mesic sedge-dominated (Carex spp.) meadows. At Walker Bay, S. richardsonii is the dominant erect shrub species, growing approximately 0.5 to 1.25 m high with significant horizontal spread ().
Figure 1. (a) The location of Walker Bay and potential sources of climate data in the central Canadian Arctic, (b) the location of our sampling plots at Walker Bay, (c) an image of a Salix richadsonii shrub at Walker Bay, and (d) an example of a stained cross section. There was one shrub sampled in 2010 from a snap-trap transect hidden by the legend in (b). Photo credit: Angélique Dupuch and Clara Morrissette-Boileau
We acquired climatic data (mean monthly temperature and total monthly precipitation) from an Environment Canada weather station located at Cambridge Bay, approximately 150 km northeast of the field site (http://climate.weather.gc.ca/historical_data/search_historic_data_ e.html). This climatic station was chosen because temperature and precipitation data were only available from 1998 to 2004 at our study site. Cambridge Bay, like Walker Bay, is in bioclimate subzone D (Walker et al. Citation2005) with mean annual temperature of −14.4°C (8.4°C in July) and mean annual precipitation of 141.6 mm for the period from 1949 to 2014. Grouping these data into pre-1980 and post-1980 intervals demonstrates a clear mean annual temperature shift in the region, from −15.1°C ± 1.0°C for the 1949–1979 period to −13.8°C ± 1.3°C afterward. Mean total precipitation has not changed (1949–1979: 138 ± 27 mm; 1980–2014: 145 ± 28 mm).
Sample collection and preparation
A total of seventy stems, each from an individual S. richardsonii shrub, were sampled in June of 2010 (n = 17), 2011 (n = 41), and 2015 (n = 12; Supporting Information Table 1). In June 2010, we randomly sampled one shrub in each of twelve 0.35 ha lemming sampling grids that were also used to survey shrub cover (). We collected four additional shrubs in separate quadrats of a 7.3 ha former predator field exclosure (description in Dupuch et al. Citation2014), plus one additional shrub on an abandoned snap-trap transect used by Krebs et al. (Citation2002) in their assessment of synchronous rodent dynamics. In June 2011, we randomly sampled forty-one shrubs from four 500-m-long transects spaced 100 m apart in a large patch of shrubs parallel to a low rocky ridge. We selected the shrub nearest to each of ten randomly generated distances along each 500-m transect (). We completed our sampling in June 2015 by collecting one additional shrub growing adjacent to each of the twelve lemming sampling grids sampled in 2010 (the closest shrub to a randomly assigned corner of the grid). The 2010 and 2015 shrubs yielded a more representative geographical sample across our 20 km2 study area as well as potential for a longer dendrochronological series. Whereas our sampling in 2010 and 2015 was designed to capture variation in shrub growth at long-term research plots spread across the landscape, our 2011 sampling was designed to study an extensive patch of S. richardsonii located outside the long-term plots. Upon collating the data, we merged the data sets because there was not enough statistical power to analyze differences among them.
We sampled only undamaged shrubs with at least three stems because herbivory or disturbance from muskoxen (Ovibos moschatus; Blok, Schaepman-Strub et al. Citation2011) can depress shrub growth. We harvested the base of the largest stem of each shrub, excluding any shrubs for which the base was frozen in ice. We placed the labeled stems and representative catkins for sex determination in labeled and sealed plastic bags.
In the laboratory, we determined the sex of each sampled individual, when possible, by examining catkins under a dissecting microscope. We were only able to identify the sex of twenty-two shrubs, all sampled in 2011, because many plants did not have catkins that were developed enough to identify sex. Our analysis of differences between male and female shrubs is restricted to these individuals. Samples from the base of each stem were boiled for at least 4 hours before 20-μm sections were sliced using a sledge microtome (WSL-Core-Microtome, Zürich, Switzerland). We stained one section per shrub using safranin (1 percent solution, Safranin O; Fisher Science Education, Hanover Park, IL) and mounted them on glass slides using a 66 percent toluene solution (SHUR/mountTM liquid cover glass; Triangle Biomedical Sciences, Cincinnati, OH).
Tree-ring measurement, cross-dating, and chronology development
We digitized individual slides with a binocular-mounted camera at 0.67× magnification, unless a higher magnification was necessary to visualize the rings (; Olympus SZ61 with a SC100 camera, Richmond Hill, ON, Canada). We uploaded images to LIGNOVISION (v1.36; Rinntech, Heidelberg, Germany), a dendrochronological software, and we measured two radii for each cross section (Hallinger, Manthey, and Wilmking Citation2010). We identified discontinuous rings by comparing the number of rings counted on each radius and then searched sections manually when we encountered discrepancies (Stokes and Smiley Citation1968). We assigned a width of 1 μm (i.e., the lower limit of precision) to growth rings that were partially missing or too narrow to be measured (N = 2), in order to obtain accurate chronologies in relation to age (Stokes and Smiley Citation1968). We accounted for eccentric growth by averaging the yearly ring width from each radius. Individual chronologies were visually and statistically verified with COFECHA by inspecting the dating quality of the series and calculating the correlations between chronologies (Center for Northern Studies, Québec, QC, Canada; COFECHA, Tree Ring Lab, Palisades, NY). We used the cross-dating information from COFECHA to add missing rings into growth series with significant negative correlations to the chronology and excluded sixteen shrubs that did not cross-date with the remaining fifty-four. Considering the heterogeneity of the sampling method, this number is acceptable (e.g., Zalatan and Gajewski Citation2006). The selected shrubs had an expressed population signal of 0.87 (Wigley, Briffa, and Jones Citation1984; Buras Citation2017) and a mean series intercorrelation of 0.43 ± 0.23, and the first-order autocorrelation of the chronology was 0.43 ± 0.21. The individual cross-dated ring width curves were standardized using a cubic spline with a knot every nine years to eliminate age related growth trends. We averaged these standardized chronologies to produce a standardized ring width chronology.
One serious limitation in many assessments of shrub growth over time is that standardization will remove temporal trends from the data (Ropars et al. Citation2015). A significant correlation between average shrub age and year in our data set (r = 0.77, p < .001, df = 91) suggests that a relatively large amount of variation associated with time was removed by age standardization. We therefore used the standardized chronology only to identify the climatic drivers of S. richardsonii radial growth (response function; see Statistical analysis section). To infer the long-term growth trend, we estimated radial growth by calculating the basal area increment (or ring area) of the fifty-four individuals used to build the standardized ring width chronology, assuming circular cross sections after averaging the two radii for each shrub. This procedure eliminates the geometrical decrease of ring widths with increasing stem diameter (LeBlanc Citation1996), thus emphasizing the ecological or climatic signal. The regional curve standardization technique used by others (e.g., Forbes, Fauria, and Zetterbergs Citation2010) to standardize age-related growth was not appropriate for our data because our shrubs had a variable age–growth trend (Supporting Information Figure 7). Finally, we used the raw ring width data to search for a difference in growth between males and females.
Shrub cover surveys
We collected data on the cover of tall (>25 cm) and short shrubs (<25 cm) in twelve permanent 60 m × 60 m lemming sampling grids located at least 100 m apart and separated by ridges, ponds, or mud flats (see Morris, Davidson, and Krebs [Citation2000] for a complete plot description). Tall shrubs were mostly S. richardsonii, whereas short shrubs were mostly S. arctica. To determine tall and short shrub cover, we recorded their presence at 3,000 systematically distributed points along 300 10-m transects located within the twelve sampling grids (Morris, Davidson, and Krebs Citation2000). These surveys were conducted in 1996 and 2010.
Statistical analysis
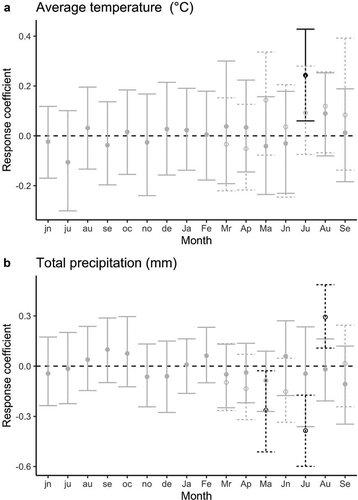
Response functions (equivalent to partial regression coefficients from a multiple regression on the principal components of temperature and precipitation data) during the period 1949–2013 (i.e., when we had data for both shrub growth and monthly climatic data) were performed with the bootRes package (dcc function; Zang and Biondi Citation2013) of the R software (v3.0.2; R Development Core Team, Vienna, Austria) to assess the influence of mean monthly temperatures and total monthly precipitation on standardized ring width chronology. We examined the climate–growth relationship between June of the previous growing season to September of the current growing season. The default functions in the bootRes package use 1,000 iterations, a setting that is hard-coded into the functions. We recoded these functions to allow us to run 10,000 iterations, because some of our response function confidence intervals were close to zero. We also examined the climate–growth relationship on a restricted time frame corresponding to the period where shrub cover was assessed (1996–2010). Due to the restricted number of years during this time frame (N = 15), we assessed only the influence of mean monthly temperature and total monthly precipitation from March to September (seven months) of the current growing year.
We tested whether there was a significant difference in growth between male and female shrubs using a linear mixed effects model with individual shrub as a random effect and a correction of autocorrelated values within raw data using a first-order autoregressive covariance structure. Models were run in the R Package nlme with the function lme maximizing the restricted maximum likelihood (Pinheiro et al. Citation2010).
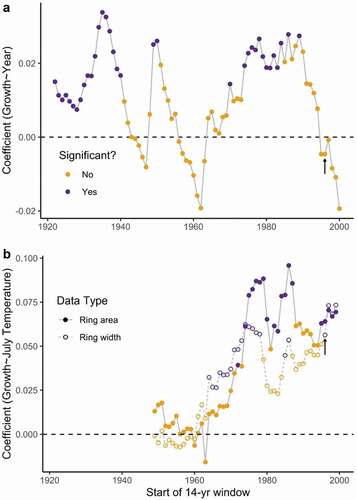
We used Fisher’s exact test to determine whether there was a significant change in the cover of tall and short shrubs between 1996 and 2010. We evaluated the possible impact of comparing shrub growth and shrub cover over different periods of time using a moving correlation analysis. We measured shrub cover change over a fourteen-year period (1996–2010), and so we calculated the trend in radial growth and the relationship between growth and climate variables for every fourteen-year window in the data set to plot changes over time. This analysis helped us identify whether the fourteen-year period for which we had shrub cover data (1996–2010) was typical of the entire chronology.
Results
Mean annual temperature at Cambridge Bay between 1949 and 2014 increased significantly (mean annual temperature = 0.04(year) − 93.1, r = 0.57, p < .001; ). There was no significant trend in total annual precipitation (r = 0.17, p = .174). Overall, the regional climate records suggest a general increase in temperatures with no associated changes in precipitation. There was no significant increase in mean annual temperature during the 1996–2010 period (r = 0, p = .65; ).
Figure 2. The trend in mean (a) annual temperature and (b) July temperature at the Cambridge Bay Airport since 1949 (data from Environment Canada’s weather station at Cambridge Bay, approximately 150 km northeast of the field site); Blue lines are predicted from linear models using the full data set, and orange data points represent the data from 1996 to 2010 (no significant regressions: [a] p = .65; [b] p = .39) when we have shrub cover estimates
![Figure 2. The trend in mean (a) annual temperature and (b) July temperature at the Cambridge Bay Airport since 1949 (data from Environment Canada’s weather station at Cambridge Bay, approximately 150 km northeast of the field site); Blue lines are predicted from linear models using the full data set, and orange data points represent the data from 1996 to 2010 (no significant regressions: [a] p = .65; [b] p = .39) when we have shrub cover estimates](/cms/asset/719ac800-c166-4d44-9f14-62e95183425c/uaar_a_1824558_f0002_oc.jpg)
The shrubs used to build the standardized chronology () had a mean age of thirty-one years (minimum = eight, maximum = eighty-eight). The response coefficient for July temperature was significantly correlated with shrub growth between 1949 and 2013 (; r = 0.34; 95 percent confidence interval [CI], 0.11–0.54). July temperature increased significantly between 1949 and 2014 (mean July temperature = 0.03(year) − 57.6, r = 0.40, p < .001; ). For the restricted chronology (1996–2010), the response function coefficient for July temperature was not significantly correlated with shrub growth (r = 0.09; 95 percent CI, −0.07 to 0.28) even though the univariate relationship was still significant (). Across the entire chronology, the relationship between July temperature and shrub growth strengthened in the 1970s (before 1970s, r≈0 and after 1970s, r≈0.5; ).
Mean monthly precipitation was not a significant driver of S. richardsonii radial growth for the full chronology (; Question 1). However, precipitation became important in the restricted chronology. Total monthly precipitation response function coefficients for May (r = −0.26; 95 percent CI, −0.51 to −0.03), July (r = −0.38; 95 percent CI, −0.60 to −0.17), and August (r = −0.29; 95 percent CI, −0.11 to −0.17) were significant for the restricted chronology, although only July precipitation showed a strong univariate correlation (Supporting Information Figure 9).
Female (n = 15) and male (n = 7) shrubs did not differ significantly in their annual growth (mean male ring width = 82.1 ± 64.8 µm; mean female ring width = 79.5 ± 54.7 µm; df = 20, t = 0.03, p = .975; Question 2).
Basal area increment (or ring area) increased over time, suggesting an increase of S. richardsonii radial growth (F1,91 = 269, p < .001; ; Question 3). Such a result accords with the fact that radial growth is positively influenced by July mean temperature which increased from 1949 to 2013. As expected, we observed a significant relationship between basal area increment and mean July temperature (F1,64 = 25.56, p < .001; ). For the restricted chronology (1996–2010), there was no significant trend in shrub growth (r = 0, p = .74; ) but there was still a significant univariate relationship between growth and July temperature (F1,13 = 4.98, p = .04; ) even though the response function coefficient was no longer significant ().
Point count data on the cover of both tall—mostly S. richardsonii—and short shrubs at Walker Bay indicate no change in mean cover from 1996 to 2010 (Fisher’s exact test p > .1; Supporting Information). Twenty percent of transects had tall shrubs in 1996 compared to 15 percent in 2010. Short shrubs were more common, being found on 72 percent and 61 percent of transects in 1996 and 2010, respectively. Fewer transects in 2010 had short shrubs than in 1996 (p < .01; Supporting Information), but there was no significant change in the proportion of transects with tall shrubs (p = .14; Supporting Information). These results suggest that shrub cover did not change at Walker Bay between 1996 and 2010 (Question 4).
We found serveal fourteen-year periods in the 1930s, 1950s, and 1980s with a positive growth trend over time (). These windows correspond to times where shrub growth was less variable between years (). There was no significant increase in growth during the fourteen-year period from 1996 to 2010, as already shown (: orange points; : arrow). In summary, the correlation between growth and July temperature was positive in recent decades even though the trend in shrub growth () and response function coefficients () no longer predicts a significant relationship.
Figure 3. Standardized ring width chronology built from fifty-four Salix richardsonii shrubs from Walker Bay, Nunavut, Canada. The number of individual shrubs (sample depth) that contribute to each point in the chronology is indicated by the filled polygon (minimum = one shrub from 1922 to 1924)
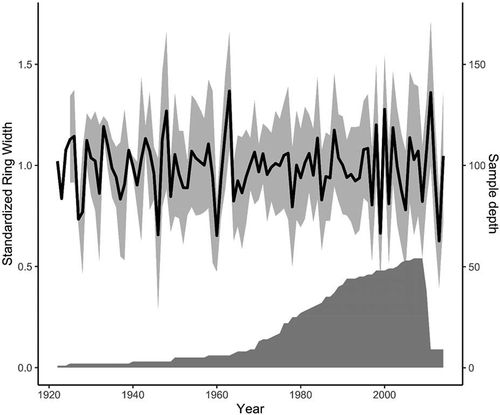
Figure 4. The response function coefficients for the annual growth (estimated as the standardized ring width) of Salix richardsonii and (a) mean monthly temperature and (b) total monthly precipitation from 1949 until 2013. Lowercase letters on the horizontal axis denote the months in the year before growth; uppercase letters refer to months in the year of growth. Black points represent statistically significant response function coefficients. Dashed lines and open symbols represent an analysis using the data from 1996 to 2010, which is the same period for which we have shrub cover data. We could only conduct the 1996 to 2010 analysis from March to September of the growth year because there were only fourteen available degrees of freedom for seven months each with two climate variables
Discussion
Our results indicate that S. richardsonii and the other common shrub species (S. arctica) did not expand from 1996 to 2010 at our study site near Walker Bay. Therefore, Walker Bay does not appear to be contributing to the recent shrub greening or browning trends observed elsewhere in the Arctic (Tape, Sturm, and Racine Citation2006; Forbes, Fauria, and Zetterbergs Citation2010; Myers-Smith et al. Citation2011; Ropars and Boudreau Citation2012; Phoenix and Bjerke Citation2016; Bonney, Danby, and Treitz Citation2018; Andruko, Danby, and Grogan Citation2020). Paradoxically, our long-term dendrochronological analysis revealed that radial growth has significantly increased with July temperatures since the 1950s (). We resolve this conflict by arguing that July temperature may still be one of the drivers of radial growth ( and ) but that summer precipitation and other variables flattened the positive growth trend in the early 2000s ( and ). Overall, our data from Walker Bay support a more complex relationship between shrub cover dynamics and climatic trends that is likely to be modified by site- and species-specific recruitment limitation (Myers-Smith, Elmendorf et al. Citation2015; Young et al. Citation2016).
Figure 5. (a) The trend in average ring area over time and its (b) relationship with July temperature. Ring area significantly increased over time and was significantly correlated with July temperature. Blue lines are predicted from linear models using the full data set, and orange points and lines use the data from 1996 to 2010 when we have shrub cover estimates (there was no significant relationship between ring area and year in the restricted data set; p = .74). The range in (a) and error bars in (b) show ±1 standard deviation in ring area truncated at zero. The sample depth for the ring area chronology (a) is the same as the ring width chronology ()
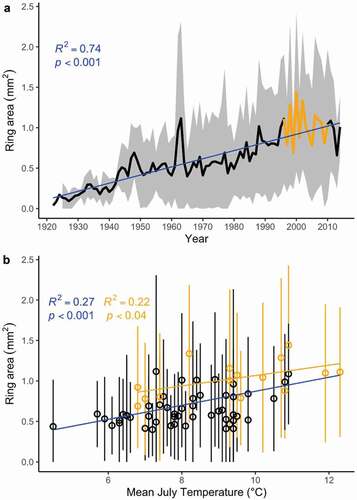
Figure 6. (a) The changes in growth trends and the (b) relationship with July temperature over time. (a) Each point represents the linear model coefficient relating growth and year for the fourteen-year window starting from the year on the x-axis. This linear model was significant if the point is purple. (b) The linear model coefficient for July temperature with ring width or ring area, for the same fourteen-year windows. The results that use data from the same years as our shrub cover analysis correspond to black arrows in each plot
Radial growth: Climatic drivers, long-term pattern, and sex
Our work corroborates many studies that concluded that summer temperature is one of the major drivers of arctic shrub’s radial growth (Liang and Eckstein Citation2009; Forbes, Fauria, and Zetterbergs Citation2010; Hallinger, Manthey, and Wilmking Citation2010; Hantemirov et al. Citation2011; Boudreau and Villeneuve-Simard Citation2012; Myers-Smith, Elmendorf et al. Citation2015; Ropars et al. Citation2015, Citation2017; Young et al. Citation2016). In high-latitude regions, the positive impact of warmer temperatures on radial growth can be driven by direct (physiological activity) and indirect (increase soil microbial activity and decomposition rates) effects (see Myers-Smith et al. Citation2011). Unfortunately, we cannot discriminate the relative contributions of these effects on the positive relationship between warmer summer temperatures and S. richardsonii growth. Experiments testing the relative effect of higher soil nutrient availability and temperature on growth would provide estimates of these direct and indirect effects and improve our ability to predict the response of S. richardsonii to higher temperatures at other sites.
The relationship between S. richardsonii radial growth and precipitation was not significant at Walker Bay when we used the entire dendrochronological data set. However, an analysis from 1996 to 2010 produced three significant response function coefficients that suggest both negative (May and July) and positive (August) effects of precipitation. By contrast, S. alaxensis radial growth on nearby Victoria Island was positively associated with spring precipitation, because spring snow accumulation builds up soil moisture reserves (Zalatan and Gajewski Citation2006). Such positive impacts of late snow precipitation are likely associated with dry landscapes where soil moisture could be limiting, although snow cover can also insulate shrubs and prevent late-frost damages (Sturm et al. Citation2005). At Walker Bay, moisture was probably not historically limiting, because the landscape is set on a broad snowmelt floodplain that is uncharacteristically wet and dotted with tundra ponds. Given this site-specific information and the short time series in the restricted analysis, we can only conclude that precipitation might play a role in shrub growth at Walker Bay now that summer temperatures are consistently higher (Myers-Smith, Elmendorf et al. Citation2015). Furthermore, our results suggest that shrubs at Arctic sites with saturated water tables might not respond to precipitation as clearly as shrubs at dryer sites (Zalatan and Gajewski Citation2006; Myers-Smith, Elmendorf et al. Citation2015; Young et al. Citation2016).
The basal area increment data show that S. richardsonii radial growth at Walker Bay increased from the 1960s to the early 2000s but appears to have leveled off since then. A long-term increase in basal area increment was expected as July temperature, the only climatic driver of long-term radial growth identified in this study, increased significantly from 1949 to 2013. If we consider only the period when we have shrub cover data (1996 to 2010), there was no significant increase in basal area increment (F1,13 = 0.11, p > .7). There was also no significant change in annual temperature (F1,13 = 0.21, p > .6; ), July temperature (F1,13 = 0.79, p > .4; ), or annual precipitation (F1,13 = 0.76, p > .4) during this period. In fact, summer temperature was highly variable from 1996 to 2010 at our study site, which corresponded closely with variable interannual growth ( and ). Instead of temperature, precipitation may have become a more important driver of radial growth in recent decades, although we can only confirm this result with a longer time series. The restricted dendrochronological analysis might itself be suspect. One reason to be skeptical is that the climate and growth data showed high variability over the entire time series (). Some fourteen-year windows showed significant trends in growth or the relationship with July temperature, whereas others did not. Future dendrochronology work will be necessary to determine whether the increasing trend in shrub growth has plateaued or has been temporarily slowed by variable summer temperatures in the 2000s.
The similar radial growth between male and female shrubs suggests that female shrubs can maintain radial growth even while investing more in reproduction as seed development and maturation. A similar pattern was observed for S. sachalinensis in northern Japan (Ueno and Seiwa Citation2003) and S. arctica in Greenland (Schmidt et al. Citation2010). One hypothesis to explain this result is that males make their reproductive investment earlier in the year and so leaf out later than female shrubs. This hypothesis is consistent with data from S. arctica, which suggest that females can maintain higher stomatal conductance in the spring when they grow in environments with adequate resources (Dawson and Bliss Citation1989). Overall, it appears that there are enough interacting trade-offs between the resource allocation in male and female shrubs to nullify any long-term differences in radial growth at Walker Bay.
No evidence of increased shrub cover at Walker Bay
Our field surveys conducted fourteen years apart reveal that the shrub cover is relatively stable in the Walker Bay area. Our results are in accordance with Ju and Masek (Citation2016), who showed that this region did not experience significant greening or browning from 1984 to 2012. Unfortunately, we do not have older estimates of shrub cover in this region and are therefore unable to determine whether shrub cover increased at Walker Bay during mid-twentieth century when S. richardsonii radial growth was clearly increasing. Data on local biotic or abiotic constraints, such as herbivory, nutrient limitation, or the depth of the water table, could explain why the shrub cover at Walker Bay has not tracked the average temperature increases over the last two decades (Martin et al. Citation2017). Interestingly, this period was also characterized by a relatively stable radial growth, suggesting that the overall shrub performance (growth and recruitment) did not increase significantly from 1996 to 2010. Although our data do not allow us to pinpoint the exact mechanism behind the apparent inertia in shrub cover, they fit a growing body of evidence that shrub recruitment and cover might be restricted by constraints, such as topography, herbivory, or nutrient supply, that vary at smaller spatial scales than temperature or precipitation (Post and Pedersen Citation2008; Ropars and Boudreau Citation2012; Young et al. Citation2016).
Conclusions
Our research reinforces an emerging perspective that considering factors beyond regional temperature and precipitation will add important mechanisms to our understanding of shrub growth and cover (Martin et al. Citation2017; Weijers et al. Citation2018). Likely features at Walker Bay include the saturated water table and damage from muskoxen trampling and browsing. Though pan-Arctic trends are useful for assessing change at global scales (Myers-Smith et al. 2015), our study suggests that understanding local change will require the consideration of biotic and abiotic variables measured at comparable scales. These site-specific factors are important for unraveling how climate change in the Arctic will alter individual species and their interactions (Rosenblatt and Schmitz Citation2016).
Finally, our study demonstrates a possible limitation of response function analysis pertinent to local managers and global modelers. Dendrochronology is a powerful tool for examining growth trends in the past when other proxies of shrub performance, such as shrub cover, are not available. However, patterns of growth and cover of S. richardsonii at Walker Bay demonstrate that historical relationships between shrub radial growth and climatic variables do not necessarily translate to contemporary change at the landscape level. Therefore, one must be careful about extrapolating the predictive power of historic relationships between climate and growth into climate models. Our ability to predict the future state of arctic ecosystems will likely benefit from being cautious before equating changes in seasonal climates with changes in the growth of plant species.
Supplemental Material
Download Zip (679.8 KB)Acknowledgments
We thank the Nunavut Ministry of the Environment and the Kitikmeot Inuit Association for enabling our research at Walker Bay. We also thank M. Moses and V. Sundararaj for help in the field, D. Chapman and N. Luckai for assistance processing and measuring samples in the lab, and J. Wason for helpful discussions about dendrochronology. We are especially thankful for continuing logistic support provided so effectively by Canada’s Polar Continental Shelf Program, Natural Resources Canada.
Disclosure statement
No potential conflict of interest was reported by the authors.
Supplementary material
Supplemental data for this article can be accessed on the publisher’s website.
Additional information
Funding
References
- ACIA. 2005. Impacts of a warming Arctic. In Arctic climate impact assessment, New York, USA: Cambridge University Press. 1042.
- Ackerman, D. E., D. Griffin, S. E. Hobbie, K. Popham, E. Jones, and J. C. Finlay. 2018. Uniform shrub growth response to June temperature across the North Slope of Alaska. Environmental Research Letters 13 (2018):044013. doi:https://doi.org/10.1088/1748-9326/aab326.
- Andruko, R., R. Danby, and P. Grogan. 2020. Recent growth and expansion of birch shrubs across a low Arctic landscape in continental Canada: Are these responses more a consequence of the severely declining caribou herd than of climate warming? Ecosystems. doi:https://doi.org/10.1007/s10021-019-00474-7.
- Argus, G. W. 2004. A guide to the identification of Salix (willows) in Alaska, the Yukon Territory and adjacent regions, 85. Fairbanks: University of Alaska.
- Beck, P. S. A., N. Horning, S. J. Goetz, M. M. Loranty, and K. D. Tape. 2011. Shrub cover on the North Slope of Alaska: A circa 2000 baseline map. Arctic, Antarctic, and Alpine 680 Research 43:355–63. doi:https://doi.org/10.1657/1938-4246-43.3.355.
- Bjorkman, A. D., I. H. Myers-Smith, S. C. Elmendorf, S. Normand, N. Rüger, P. S. A. Beck, and E. Weiher. 2018. Plant functional trait change across a warming tundra biome. Nature 562 (7725):57–62. doi:https://doi.org/10.1038/s41586-018-0563-7.
- Blok, D., G. Schaepman-Strub, H. Bartholomeus, M. Heijmans, T. C. Maximov, and F. Berendse. 2011. The response of arctic vegetation to the summer climate: Relation between shrub cover, NDVI, surface albedo and temperature. Environmental Research Letters 6 (3):1–9. doi:https://doi.org/10.1088/1748-9326/6/3/035502.
- Blok, D., U. Sass-Klaassen, G. Schaepman-Strub, M. M. Heijmans, P. Sauren, and F. Berendse. 2011. What are the main climate drivers for shrub growth in Northeastern Siberian tundra? Biogeosciences 8:1169–79.
- Boelman, N. T., L. Gough, J. McLaren, and H. Greaves. 2011. Does NDVI reflect variation in the structural attributes associated with increasing shrub dominance in arctic tundra? Environmental Research Letters 6 (3):1–12. doi:https://doi.org/10.1088/1748-9326/6/3/035501.
- Bonney, M. T., R. K. Danby, and P. M. Treitz. 2018. Landscape variability of vegetation change across the forest to tundra transition of central Canada. Remote Sensing of Environment 217:18–29. doi:https://doi.org/10.1016/j.rse.2018.08.002.
- Boudreau, S., and M.-P. Villeneuve-Simard. 2012. Dendrochronological evidence of shrub growth suppression by trees in a subarctic lichen woodland. Botany 90 (2):151–56. doi:https://doi.org/10.1139/b11-089.
- Bradford, M. A., R. J. Warren II, P. Baldrian, T. W. Crowther, D. S. Maynard, E. E. Oldfield, W. R. Wieder, S. A. Wood, and J. R. King. 2014. Climate fails to predict wood decomposition at regional scales. Nature Climate Change. 4(7):625–30. doi:https://doi.org/10.1038/nclimate2251.
- Bret-Harte, M. S., G. R. Shaver, and F. S. Chapin III. 2002. Primary and secondary stem growth in arctic shrubs: Implications for community response to environmental change. Journal of Ecology 90 (2):251–67. doi:https://doi.org/10.1046/j.1365-2745.2001.00657.x.
- Buchwal, A., S. Weijers, D. Blok, and B. Elberling. 2019. Temperature sensitivity of willow dwarf shrub growth from two distinct High Arctic sites. International Journal of Biometeorology 63 (2):167–81. doi:https://doi.org/10.1007/s00484-018-1648-6.
- Büntgen, U., L. Hellmann, W. Tegel, S. Normand, I. Myers-Smith, A. V. Kirdyanov, D. Nievergelt, F. H. Schweingruber, and J. Lee. 2015. Temperature-induced recruitment pulses of Arctic dwarf shrub communities. Journal of Ecology 103 (2):489–501. doi:https://doi.org/10.1111/1365-2745.12361.
- Buras, A. 2017. A comment on the expressed population signal. Dendrochronologia 44:130–32. doi:https://doi.org/10.1016/j.dendro.2017.03.005.
- Chapin, F. S. 1983. Direct and indirect effects on temperature on arctic plants. Polar Biology 2 (1):47–52. doi:https://doi.org/10.1007/BF00258285.
- Chapin, F. S., P. A. Matson, and P. M. Vitousek. 2011. Principles of terrestrial ecosystem ecology. New York: Springer New York.
- Dawson, T. E., and L. C. Bliss. 1989. Patterns of water use and the tissue water relations in the dioecious shrub, Salix arctica: The physiological basis for habitat partitioning between the sexes. Oecologia 79 (3):332–43. doi:https://doi.org/10.1007/BF00384312.
- Dupuch, A., D. W. Morris, S. B. Ale, D. J. Wilson, and D. E. Moore. 2014. Landscapes of fear or competition? Predation did not alter habitat choice by Arctic rodents. Oecologia 174 (2):403–12. doi:https://doi.org/10.1007/s00442-013-2792-7.
- Environment Canada. 2020. Historical Data. Accessed October15, 2015, http://climate.weather.gc.ca/historical_data/search_historic_ Q5 data_ e.html.
- Elmendorf, S. C., G. R. H. Henry, R. D. Hollister, R. G. Bjork, A. D. Bjorkman, T. V. Callaghan, L. S. Collier, E. J. Cooper, J. H. C. Cornelissen, T. Z. Day, et al. 2012. Global assessment of experimental climate warming on tundra vegetation: Heterogeneity over space and time. Ecology Letters 15:164–75. doi:https://doi.org/10.1111/j.1461-0248.2011.01716.x.
- Forbes, B. C., M. M. Fauria, and P. Zetterbergs. 2010. Russian arctic warming and ‘greening’ are closely tracked by tundra shrub willows. Global Change Biology 16:1542–54.
- Fritts, H. C. 1976. Tree rings and climate, 567. London: Academic Press.
- Gamm, C. M., P. F. Sullivan, A. Buchwal, R. J. Dial, A. B. Young, D. A. Watts, and E. Post. 2018. Declining growth of deciduous shrubs in the warming climate of continental western Greenland. Journal of Ecology 106 (2):640–54. doi:https://doi.org/10.1111/1365-2745.12882.
- Gouker, F. E., C. H. Carlson, J. Zou, L. Evans, C. R. Crowell, C. D. Smart, S. P. DiFazio, and L. B. Smart. 2020. Sexual dimorphism and sex ratio bias in the dioecious willow Salix purpurea L. preprint. Plant Biology. https://doi.org/https://doi.org/10.1101/2020.04.05.026427
- Hallinger, M., M. Manthey, and M. Wilmking. 2010. Establishing a missing link: Warm summers and winter snow cover promote shrub expansion into apline tundra in Scandinavia. New Phytologist 186 (4):890–99. doi:https://doi.org/10.1111/j.1469-8137.2010.03223.x.
- Hantemirov, R., S. Shiyatov, and L. Gorlanova. 2011. Dendroclimatic study of Siberian juniper. Dendrochronologia 29 (2):119–122.
- Hinzman, L., et al. 2005. Evidence and implications of recent climate change in northern Alaska and other Arctic regions. Climate Change 72:251–98.
- Intergovernmental Panel on Climate Change. 2013. The physical science basis. Contribution of working group I to the fifth assessment report of the Intergovernmental Panel on Climate Change. In Climate Change 2013 ed. T. F. Stocker, D. Qin, G.-K. Plattner, M. Tignor, S. K. Allen, J. Boschung, A. Nauels, Y. Xia, V. Bex, and P. M. Midgley, 1535. Cambridge, United Kingdom and New York, NY, USA: Cambridge University Press.
- Jepsen, J. U., M. Biuw, R. A. Ims, L. Kapari, T. Schott, O. P. L. Vindstad, and S. B. Hagen. 2013. Ecosystem impacts of a range expanding forest defoliator at the forest-tundra ecotone. Ecosystems 16 (4):561–75. doi:https://doi.org/10.1007/s10021-012-9629-9.
- Ju, J., and J. G. Masek. 2016. The vegetation greenness trend in Canada and US Alaska from 1984–2012 Landsat data. Remote Sensing of Environment 176:1–16. doi:https://doi.org/10.1016/j.rse.2016.01.001.
- Klady, R. A., G. H. Henry, and V. Lemay. 2011. Changes in high arctic tundra plant reproduction in response to long-term experimental waming. Global Change Biology 17:1611–24.
- Krebs, C. J., A. J. Kenney, S. Gilbert, K. Danell, A. Angerbjörn, S. Erline, R. G. Bromley, C. Shank, and S. Carriere. 2002. Synchrony in lemming and vole populations in the Canadian Arctic. Canadian Journal of Zoology 80 (8):1323–33. doi:https://doi.org/10.1139/z02-120.
- LeBlanc, D. 1996. Using tree rings to study forest decline: An epidemiological approach on estimated annual wood volume increment. In Tree rings, environment and humanity, ed. J. S. Dean, D. M. Meko, and T. W. Swetnam, 437–49. Radiocarbon, Arizona, USA.
- Liang, E., and D. Eckstein. 2009. Dendrochronological potential of the alpine shrub Rhododendron nivale on the south-eastern Tibetan Plateau. Annals of Botany 104 (4):665–70. doi:https://doi.org/10.1093/aob/mcp158.
- Liu, Y., Z. Xu, R. Duffy, W. Chen, S. An, S. Liu, and F. Liu. 2011. Analyzing relationships among water uptake patterns, rootlet biomass distribution and soil water content profile in a subalpine shrubland using water isotopes. European Journal of Soil Biology 47 (6):380–86. doi:https://doi.org/10.1016/j.ejsobi.2011.07.012.
- Macias-Fauria, M., B. C. Forbes, P. Zetterberg, and T. Kumpula. 2012. Eurasian Arctic greening reveals teleconnections and the potential for structurally novel ecosystems. Nature Climate Change 2 (8):613–18. doi:https://doi.org/10.1038/nclimate1558.
- Martin, A. C., E. S. Jeffers, G. Petrokofsky, I. Myers-Smith, and M. Macias-Fauria. 2017. Shrub growth and expansion in the Arctic tundra: An assessment of controlling factors using an evidence-based approach. Environmental Research Letters 12 (8):085007. doi:https://doi.org/10.1088/1748-9326/aa7989.
- McKenney, D. W., M. F. Hutchinson, P. Papadopol, K. Lawrence, J. Pedlar, K. Campbell, E. Milewska, R. F. Hopkinson, D. Price, and T. Owen. 2011. Customized spatial climate models for North America. Bulletin of the American Meteorological Society 92 (12):1611–22. doi:https://doi.org/10.1175/2011BAMS3132.1.
- Morris, D. W., D. L. Davidson, and C. J. Krebs. 2000. Measuring the ghost of competition: Insights from density-dependent habitat selection on the co-existence and dynamics of lemmings. Evolution Ecology Research 2:69–80.
- Myers-Smith, I. H., B. C. Forbes, M. Wilmking, M. Hallinger, T. Lantz, D. Blok, K. Tape, M. Macias-Fauria, U. Sass-Klaassen, E. Levesque, et al. 2011. Shrub expansion in tundra ecosystems: Dynamics, impacts and research priorities. Environmental Research Letters 6 (4):15p. doi:https://doi.org/10.1088/1748-9326/6/4/045509.
- Myers-Smith, I. H., S. C. Elmendorf, P. S. Beck, M. Wilmking, M. Hallinger, D. Blok, K. D. Tape, S. A. Rayback, M. Macias-Fauria, and B. C. Forbes. 2015. Climate sensitivity of shrub growth across the tundra biome. Nature Climate Change 5 (9):887. doi:https://doi.org/10.1038/nclimate2697.
- Nissinen, K., L. Nybakken, V. Virjamo, and R. Julkunen-Tiitto. 2016. Slow-growing Salix repens (Salicaceae) benefits from changing climate. Environmental and Experimental Botany 128:59–68. doi:https://doi.org/10.1016/j.envexpbot.2016.04.006.
- Phoenix, G. K., and J. W. Bjerke. 2016. Arctic browning: Extreme events and trends reversing arctic greening. Global Change Biology 22 (9):2960–62. doi:https://doi.org/10.1111/gcb.13261.
- Pinheiro, J., D. Bates, S. DebRoy D. Sarkar, and R Development Core Team. 2010. Nlme: Linear and nonlinear mixed effects models. R package version 3.1–97. R Foundation for Statistical Computing. Vienna, Austria. http://www.R-project.org/.
- Post, E., and C. Pedersen. 2008. Opposing plant community responses to warming with and without herbivores. Proceedings of the National Academy of Sciences 105 (34):12353–58. doi:https://doi.org/10.1073/pnas.0802421105.
- Raynolds, M. K., J. C. Comiso, D. A. Walker, and D. Verbyla. 2008. Relationship between satellite-derived land surface temperature, arctic vegetation types, and NDVI. Remote Sensing of Environment 112 (4):1884–94. doi:https://doi.org/10.1016/j.rse.2007.09.008.
- Ropars, P., E. Lévesque, S. Boudreau, and R. Bardgett. 2015. How do climate and topography influence the greening of the forest-tundra ecotone in northern Québec? A dendrochronological analysis of Betula glandulosa. Journal of Ecology 103 (3):679–90. doi:https://doi.org/10.1111/1365-2745.12394.
- Ropars, P., S. Anger-Blondin, M. Gagnon, I. H. Myers-Smith, E. Lévesque, and S. Boudreau. 2017. Different parts, different stories: Climate sensitivity of growth is stronger in root collars vs. stems in tundra shrubs. Global Change Biology 23 (8):3281–91. doi:https://doi.org/10.1111/gcb.13631.
- Ropars, P., and S. Boudreau. 2012. Shrub expansion at the forest–tundra ecotone: Spatial heterogeneity linked to local topography. Environmental Research Letters 7 (1):015501. doi:https://doi.org/10.1088/1748-9326/7/1/015501.
- Rosenblatt, A. E., and O. J. Schmitz. 2016. Climate change, nutrition, and bottom-up and top-down food web processes. Trends in Ecology & Evolution 31 (12):965–75. doi:https://doi.org/10.1016/j.tree.2016.09.009.
- Sakai, A., A. Sasa, and S. Sakai. 2006. Do sexual dimorphisms in reproductive allocation and new shoot biomass increase with an increase of altitude? A case of the shrub willow Salix reinii(Salicaceae). American Journal of Botany 93 (7):988–92. doi:https://doi.org/10.3732/ajb.93.7.988.
- Schmidt, N. M., C. Baittinger, J. Kollmann, and M. C. Forchhammer. 2010. Consistent dendrochronological response of the dioecious Salix arctica to variation in local snow precipitation across gender and vegetation types. Arctic, Antarctic, and Alpine Research 42 (4):471–75. doi:https://doi.org/10.1657/1938-4246-42.4.471.
- Schmidt, N. M., C. Baittinger, and M. C. Forchhammer. 2006. Reconstructing century-long snow regimes using estimates of High Arctic Salix arctica radial growth. Arctic, Antarctic, and Alpine Research 38 (2):257–62. doi:https://doi.org/10.1657/1523-0430(2006)38[257:RCSRUE]2.0.CO;2.
- Słupianek, A., B. Wojtuń, and E. Myśkow. 2019. Origin, activity and environmental acclimation of stem secondary tissues of the polar willow (Salix polaris) in High Arctic Spitsbergen. Polar Biology 42 (4):759–70. doi:https://doi.org/10.1007/s00300-019-02469-5.
- Stokes, M. A., and T. L. Smiley. 1968. An introduction to tree-ring dating. Chicago and London: The University of Chicago Press.
- Sturm, M., J. Schimel, G. Michaelson, J. M. Welker, S. F. Oberbauer, G. E. Liston, J. Fahnestock, and V. E. Romanovsky. 2005. Winter biological processes could help convert arctic tundra to shrubland. BioScience 55 (1):17–26. doi:https://doi.org/10.1641/0006-3568(2005)055[0017:WBPCHC]2.0.CO;2.
- Tape, K., M. Hallinger, J. Welker, and R. Ruess. 2012. Landscape heterogeneity of shrub expansion in Arctic Alaska. Ecosystems 15 (5):711–24. doi:https://doi.org/10.1007/s10021-012-9540-4.
- Tape, K., M. Sturm, and C. Racine. 2006. The evidence for shrub expansion in Northern Alaska and the Pan-Arctic. Global Change Biology 12 (4):686–702. doi:https://doi.org/10.1111/j.1365-2486.2006.01128.x.
- Ueno, N., and K. Seiwa. 2003. Gender-specific shoot structure and functions in relation to habitat conditions in a dioecious tree, Salix sachalinensis. Journal of Forest Research 8 (1):9–16. doi:https://doi.org/10.1007/s103100300001.
- Vaganov, E. A., M. K. Hughes, A. V. Kirdyanov, F. H. Schweingruber, and P. P. Silkin.. 1999. Influence of snowfall and melt timing on tree growth in subarctic Eurasia.. Nature 400 (6740):149–51. doi:https://doi.org/10.1038/22087.
- Verbyla, D. 2008. The greening and browning of Alaska based on 1982–2003 satellite data. Global Ecology and Biogeography 17 (4):547–55. doi:https://doi.org/10.1111/j.1466-8238.2008.00396.x.
- Walker, D. A. 1987. Height and growth rings of Salix lanata ssp. richardsonii along the coastal temperature gradient of northern Alaska. Canadian Journal of Botany 65 (5):988–93. doi:https://doi.org/10.1139/b87-136.
- Walker, D. A., M. K. Raynolds, F. J. A. Daniëls, E. Einarsson, A. Elvebakk, W. A. Gould, A. E. Katenin, S. S. Kholod, C. J. Markon, E. S. Melnikov, et al. 2005. The Circumpolar Arctic vegetation map. Journal of Vegetation Science. 16(3):267–82. doi:https://doi.org/10.1111/j.1654-1103.2005.tb02365.x.
- Walker, M. D., C. H. Wahren, R. D. Hollister, G. H. R. Henry, L. E. Ahlquist, J. M. Alatalo, M. S. Bret-Harte, M. P. Calef, T. V. Callaghan, A. B. Carroll, et al. 2006. Plant community responses to experimental warming across the tundra biome. Proceedings of the National Academy of Sciences USA 103 (5):1342–46. doi:https://doi.org/10.1073/pnas.0503198103.
- Weijers, S., R. Pape, J. Löffler, and I. H. Myers-Smith. 2018. Contrasting shrub species respond to early summer temperatures leading to correspondence of shrub growth patterns. Environmental Research Letters 13 (2018):034005. doi:https://doi.org/10.1088/1748-9326/aaa5b8.
- Wigley, T. M. L., K. R. Briffa, and P. D. Jones. 1984. On the average value of correlated time series, with applications in dendroclimatology and hydrometeorology. Journal of Climate and Applied Meteorology 23 (2):201–13. doi:https://doi.org/10.1175/1520-0450(1984)023<0201:OTAVOC>2.0.CO;2.
- Woodcock, H., and R. Bradley. 1994. Salix arctica (Pall.): Its potential for dendroclimatological studies in the High Arctic. Dendrochronologia 12:11–22.
- Young, A. B., D. A. Watts, A. H. Taylor, and E. Post. 2016. Species and site differences influence climate-shrub growth responses in West Greenland. Dendrochronologia 37:69–78. doi:https://doi.org/10.1016/j.dendro.2015.12.007.
- Zalatan, R., and K. Gajewski. 2006. Dendrochronological potential of Salix alaxensis from the Kuujjua River area, western Canadian Arctic. Tree-Ring Research 62 (2):75–82. doi:https://doi.org/10.3959/1536-1098-62.2.75.
- Zang, C., and F. Biondi. 2013. Dendroclimatic calibration in R: The bootRes package for response and correlation function analysis. Dendrochronologia 31 (1):68–74. doi:https://doi.org/10.1016/j.dendro.2012.08.001.