
 ?Mathematical formulae have been encoded as MathML and are displayed in this HTML version using MathJax in order to improve their display. Uncheck the box to turn MathJax off. This feature requires Javascript. Click on a formula to zoom.
ABSTRACT
Analyzing historical maps and Landsat imagery indicates that coastal glaciers in the western Prince William Sound (PWS) have retreated since the end of the Little Ice Age, exhibiting accelerated retreat after the mid-2000s. A multitemporal inventory of 43 glaciers was developed using historical field observations, topographic maps, and Landsat imagery. Area and length measurements are derived from digitized outlines, and center lines are derived from a semi-automatic, geographic information systems (GIS)-based algorithm. Land-based glaciers retreated at a peak rate of 48 m a−1 from the mid-2000s to 2018, more than doubling the average rate of retreat (22 m a−1) for the preceding fifty-year period. From ~1950 to 2018, the total area of land-based glaciers decreased by 228 km2, with 36 percent of the glacier loss occurring after the mid-2000s. Simple upscaling of area and volume changes to unmeasured glaciers across the entire PWS resulted in an estimated aggregate glacier mass loss of 379 Gt, equivalent to a 1.047 mm rise in sea level from the 1950s to 2018. Tidewater glaciers respond asynchronously with differing periods of peak area and length loss and lower average rate of retreat compared to land-based glaciers. Glacier retreat correlates with increased summer and winter temperatures and decreased winter precipitation.
Introduction
Glaciers play an essential role in the study of climate change, and advancing and retreating glaciers provide reliable indicators for climate change at decadal to centennial scales (Adalgeirsdóttir, Echelmeyer, and Harrison Citation1998; Wiles, Barclay, and Calkin Citation1999; Calkin, Wiles, and Barclay Citation2001; Santos et al. Citation2010; Qiang, Lei, and Chuan-Yan Citation2014). The recent decline in glacier mass worldwide has important implications for human habitats, including water resource disputes, desertification in areas where glaciers have vanished, and shipping hazards in areas with increased ice loss due to calving from tidewater glaciers (Intergovernmental Panel on Climate Change Citation2007; Y. Li and Li Citation2014; Qiang, Lei, and Chuan-Yan Citation2014). Of particular concern is the relationship between global warming, glacier loss, and sea level rise. Gulf of Alaska glaciers represent an estimated one-third of the global contribution to sea level rise from melting glaciers and ice caps (Arendt et al. Citation2002; Meier and Dyurgerov Citation2002). Glaciers in the western Chugach Mountains are among the largest contributors to the rising sea level in the Gulf of Alaska (Berthier et al. Citation2010).
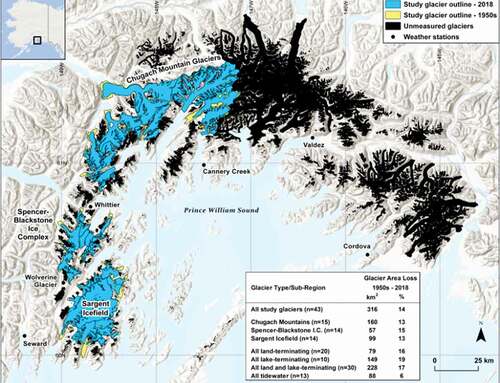
Comprehensive glacier chronologies and repeat inventories over time for different regions are critical for assessing glacier changes due to the climate or other forces (Nuth et al. Citation2013; Y. Li and Li Citation2014; Kienholz et al. Citation2015). In this study, topographic maps and Landsat imagery were used to document the advance and retreat of land and lake-terminating (land-based) glaciers and coastal tidewater glaciers in the western Prince William Sound (PWS) in the northern Gulf of Alaska (). The forty-three evaluated glaciers terminate on land or in fjords along the PWS and are divided into three subregions: the Sargent Icefield, Spencer–Blackstone Ice Complex, and the western Chugach Mountains.
Muir (Citation1902) recorded the earliest observations of glaciers in the area in 1899. Glacier chronologies, extending back to the mid-1700s, exist for some glaciers in the study area (Field Citation1975; Sturm et al. Citation1991; Wiles, Barclay, and Calkin Citation1999; Barclay, Wiles, and Calkin Citation2003). However, the chronologies only record fluctuations up to the late twentieth century. The aim of this study is to understand how coastal glaciers in the study area fluctuated since the Little Ice Age (LIA) in response to climate change. To fulfill this aim, glacier chronologies, including extent and area, were developed for forty-three coastal glaciers larger than 10 km2 (). The chronologies were based on analysis of topographic maps from ~1950 and Landsat imagery from 1973 and 1975 (1973–1975), 1986, 1994, 2004 and 2006 (2004–2006), and 2018. Further, temporal and spatial changes, including glacier length, area, and mass changes, were analyzed for land-based and tidewater glaciers. Morphometric variables, representing topographic and geometric glacier properties, were also evaluated as potential controls for glacier change. Finally, climate time series and trends were developed and compared with patterns of advance and retreat to understand glacier changes in response to climate change from the 1950s to 2018.
Table 1. General characteristics of study area glaciers
Setting
Glaciers have occupied fjords in the western PWS since the Pleistocene (Wiles, Barclay, and Calkin Citation1999). The LIA period of glacial advance began across southern Alaska around 1200 AD and continued through the early twentieth century (Porter Citation1986; Wiles, Barclay, and Calkin Citation1999). With the exception of some tidewater glaciers, the vast majority of glaciers in Alaska are now retreating (Molnia Citation2008). Berthier et al. (Citation2018) applied a glacier mass balance approach to detect changes in Alaska’s Juneau and Stikine icefields and estimated rapid mass loss from 2000 to 2016. Arendt, Walsh, and Harrison (Citation2009) used repeat airborne altimetry to study forty-six glaciers in Alaska and northwestern Canada and concluded that 75 percent of the glaciers were losing mass at an increasing rate since the mid-1990s, compared to an earlier period beginning in the 1950s to 1970s. The study attributed most glacier mass losses to increased summer (May–September) temperature, with likely contributions from winter (October–April) warming, resulting in increased thermal energy and precipitation as rain instead of snow.
Post (Citation1975) described the tidewater glacier cycle as the pattern of slow advance followed by rapid collapse as glaciers pull back from shoals and into deeper water. Meier and Post (Citation1987) studied Columbia Glacier, in the northern PWS, and concluded that “advance and retreat of tidewater glaciers are not related to climate fluctuations in a direct way” (9058) but considered tidewater cycles to be related more to basin and fjord geometry and glacier mass balance. McNabb and Hock (Citation2014) developed a sixty-four-year chronology of glacier length for fifty Alaskan tidewater glaciers to understand the response of tidewater glaciers to climate change. The study relied on digitized glacier outlines derived from topographic maps and Landsat images from 1948 to 2012. The authors concluded that 60 percent of the glaciers are retreating and observed “step change” retreats “where glaciers quickly retreat from a stable position, usually located at a topographic constriction, and stabilize again at another topographic constriction” (McNabb and Hock Citation2014;165). Tidewater glaciers are influenced by oceanic forces, such as the buoyancy-driven circulation of warm water near the calving front (Motyka et al. Citation2011), and respond differently to climate change and often with asynchronous advance or retreat compared to nearby land-terminating glaciers (Post et al. Citation2011). Brinkerhoff, Truffer, and Aschwanden (Citation2017) suggest that ice and sediment dynamics could explain the advance of some tidewater glaciers while most glaciers are retreating.
In the western PWS, the U.S. Geological Survey (USGS) maintains a glacier mass balance monitoring program at Wolverine Glacier, one of the glaciers included in this study. Wolverine Glacier is one of three North American glaciers selected by the USGS for long-term monitoring of glacier response to climate change. Results of long-term mass balance monitoring indicate that Wolverine Glacier is losing mass as a result of warmer summer temperatures (O’Neel et al. Citation2019). Repeat inventory studies conducted in regions throughout the world show similar trends of recent glacier retreat (Xiao et al. Citation2007; Błaszczyk, Jania, and Kolondra Citation2013; Bajracharya, Maharjan, and Shrestha Citation2014; Osipov and Osipova Citation2014; Paul and Mölg Citation2014; Qiang, Lei, and Chuan-Yan Citation2014; Wei et al. Citation2014; Winsvold, Andreassen, and Kienholz Citation2014).
The counterclockwise circulation of the Gulf of Alaska is responsible for the maritime climate in the study area and brings significant moisture into the coastal mountains along the PWS (Beamer et al. Citation2016). As a result, the region experiences heavy precipitation in the form of rain during the cool summers and snow in the winter. The combination of heavy moisture, cool temperatures, and mountainous topography supports the persistence of coastal glaciers. Mean temperatures for coastal communities in the study area range from −5°C in January to 14°C in July, with average annual snowfall as high as 8,280 mm at Whittier (Alaska Climate Research Center Citation2019).
Data and methods
Historical topographic maps of the study area provided the spatial data needed to extend glacier length change and area chronologies back to the 1950s. The twenty-one maps obtained for this study are available for download in a georeferenced format from the USGS (Citation2019) allowing for use in geographical information systems (GIS) without further processing. The map publication dates span 1951 to 1960 and are produced at the 1:63,360 scale from aerial photographs acquired from 1948 to 1957 (~1950; Supplementary Table 1). Horizontal accuracy estimates for 1:63,360 scale USGS topographic maps are ~50 m, with some studies indicating much larger errors in Alaska (Adalgeirsdóttir, Echelmeyer, and Harrison Citation1998; Arendt et al. Citation2002, Citation2006; McNabb and Hock Citation2014).
Landsat images were accessed from an online service portal (Environmental Systems Research Institute Citation2019). The images are georeferenced and orthorectified by the USGS, allowing for direct integration into a GIS. The images, at 15- to 60-m resolution, provided the spatial data for the repeat measurement of glacier outlines spanning 1973 to 2018 (Supplementary Table 1). Previous studies provided LIA maximums for eight of the land-based glaciers analyzed in this study (Wiles, Barclay, and Calkin Citation1999; Barclay, Wiles, and Calkin Citation2003). The process of developing glacier center lines, necessary for the calculation of glacier length changes, required high-resolution digital elevation data provided by the Advanced Spaceborne Thermal Emission and Reflection Radiometer (ASTER) optical sensor. ASTER Global Digital Elevation Model data (ASTER GDEM.v2) is a product of Japan’s Ministry of Economy, Trade, and Industry and the National Aeronautics and Space Administration (30-m resolution, obtained from NASA/METI/AIST/Japan Spacesystems, and U.S./Japan ASTER Science Team Citation2011).
Annual climate time series were developed for the Cannery Creek, Cordova MK Smith Airport, Seward Airport, and Wolverine Glacier weather stations in the PWS region (). The climate data are grouped into May–September and October–April averaging periods to represent the summer ablation and winter accumulation seasons in Alaska (Arendt, Walsh, and Harrison Citation2009; Kienholz et al. Citation2015). Raw climate data were acquired from the National Oceanic and Atmospheric Administration (NOAA Citation2019a). Missing data are common in Alaska climate data sets, requiring gap filling in some cases (Supplementary Table 2). Techniques used to fill gaps in monthly records include filling in missing monthly data with daily data averages for the month, when available, and replacing missing months or months with incomplete data (less than twenty-five days of data) with the series average of that month (McAfee, Guentchev, and Eischeid Citation2013).
Table 2. Characteristics of study area weather stations
Mapping glacier outlines
Randolph Glacier Inventory (RGI Consortium Citation2017) outline shapefiles, based on imagery from 2006 (Sargent Icefield and Spencer–Blackstone Ice Complex) and 2009 (Chugach Mountain glaciers), provided the initial glacier boundaries. Manual adjustments of the digitized RGI glacier boundaries were based on the interpretation of topographic maps from the 1950s and Landsat images acquired in 1973–1975, 1986, 1994, 2004–2006, and 2018. GIS geoprocessing tools were used to calculate the area for each glacier outline and to measure changes over time (Supplementary Table 3). Glacier outlines are available from the Global Land Ice Measurements from Space (GLIMS) database (Raup et al. Citation2007; www.glims.org). Issues including the frequency of image collection and persistent cloud cover in the western PWS limited the availability of usable imagery. Several glaciers were excluded from the study due to the presence of debris cover, making it difficult to accuarately digitize glacier boundaries. Each study glacier is identified by a project identification number, including GLIMS and RGI identification numbers as well as glacier name, if available. All topographic maps and Landsat images were either acquired in or projected to UTM Zone 6N with WGS84 datum.
Table 3. Average annual retreat rates for the eight land-based study glaciers with estimated Little Ice Age maximum extents (LIAM date) based on tree-ring dating of moraines
Volume–area scaling
Volume–area power law scaling was used to estimate changes in glacier volume. Bahr, Meier, and Peckham (Citation1997) described the following simple relationship between area and volume:
where glacier volume V is estimated from glacier area S, c is a scaling constant in units of length raised to the power (3 − 2γ), and γ is a dimensionless scaling coefficient. Estimates of scaling parameters have been derived empirically from regional data (e.g., Macheret, Cherkasov, and Bobrova Citation1988; Chen and Ohmura Citation1990) and theoretical relationships (e.g., Bahr, Meier, and Peckham Citation1997; Van de Wal and Wild Citation2001). Among frequently cited volume–area scaling studies, c estimates vary widely by method and region, ranging from c = 0.12 m3−2γ based on a global glacier model (Van de Wal and Wild Citation2001), to c = 0.2055 m3−2γ from a statistical analysis applied to a large glacier area data set (Radić and Hock Citation2011). Here, lacking a known c estimate for the study area, the scaling constant c = 0.163 m3−2γ was derived from the average of the upper and lower ends of range of published c estimates, using γ = 1.375. The scaling equation was applied to the entire population of study glaciers, rather than individual glaciers, to minimize error in volume estimation (Bahr, Pfeffer, and Kaser Citation2015). Changes in glacier mass, measured in gigatons, were calculated by multiplying ice volumes (km3) by the density of ice and dividing by the time interval.
Glacier mass changes and the equivalent rise in sea level (SLE) were calculated for the forty-three measured study glaciers and upscaled to all unmeasured glaciers throughout the PWS, following an approach described by Arendt et al. (Citation2006). The unmeasured glaciers included all 2,828 PWS glaciers available in the GLIMS database (), excluding the forty-three measured study glaciers. With the exception of Columbia Glacier, all of the unmeasured glaciers in the PWS were land-based glaciers. Shapefiles of unmeasured glacier outlines, from the mid- to late 2000s, were obtained from the GLIMS database and volume–area scaling was used to calculate an aggregate volume for the entire PWS. In order to estimate aggregate area and volume changes over time, measured glacier area change rates, obtained from analyzing the forty-three study glaciers, were applied to unmeasured glaciers backward to the 1950s and forward to 2018. Columbia Glacier was included in the aggregate volume estimate using a combination of reported volume and area estimates from 1957 to 2007 and extrapolation of measured glacier area and volume changes across 2007 to 2018. Columbia Glacier is the region’s largest contributor to sea level rise and has lost more than 130 km3 of volume since 1957 (Rasmussen et al. Citation2011; McNabb and Hock Citation2014). Measured area estimates for Columbia Glacier were obtained from the GLIMS database (2007 outline) and manual mapping of Landsat imagery (2018 outline).
Figure 1. Study area and glacier area loss between the 1950s and 2018
Glacier length
Glacier center lines were calculated using a semi-automatic, GIS-based algorithm (Le Bris and Paul Citation2013), resulting in a center line from the highest point of the glacier to the terminus. Glacier length changes were measured from the intersection of the center line with each glacier terminus, as defined by digitized glacier outlines. Repeat measurements for 1950s topographic maps and the Landsat images acquired in 1973–1975, 1986, 1994, 2004–2006, and 2018, resulted in a glacier length change chronology for each glacier (Supplementary Table 3). For a subset of eight glaciers, length change measurements extended back to the digitized LIA maximum terminus positions identified in previous studies ().
Morphometric and bathymetric analysis
Following an approach established by Y. Li and Li (Citation2014), six derived morphometric variables representing topographic and geometric glacier properties were used to evaluate potential controls on glacier change. includes the list of derived variables. Relative glacier area change (ΔA) was calculated to quantify glacier change from the 1950s to 2018. Glacier area is commonly used to represent change, because GIS allows for easy calculation of glacier area change across time periods (Y. Li and Li Citation2014). Relationships between ΔA and the six morphometric variables were quantified using multiple regression analysis and interpretation of correlation coefficients (R2) and p values.
Table 4. List of six derived topographic and geometric variables
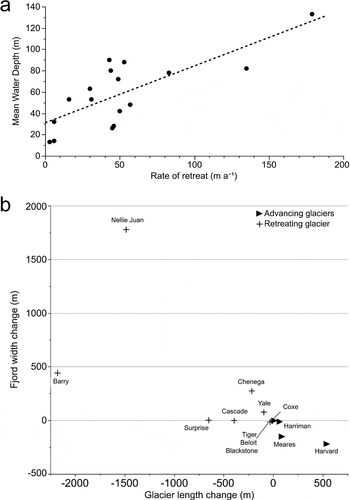
Meier and Post (Citation1987) observed a relationship between rapid retreat rates and water depth in tidewater glaciers in Alaska. Fjord bathymetric data were obtained from NOAA (NOAA Citation2019b; https://maps.ngdc.noaa.gov/viewers/bathymetry/) to test this relationship in the study area. Fjord bathymetric data were derived from hydrographic surveys conducted from 1990 to 1997. Based on availability of depth soundings, mean water depths were calculated for fjord areas between the retreating terminus positions of eight tidewater glaciers, including multiple time periods for Beloit, Coxe, Nellie Juan, Tiger, and Yale glaciers (). Regression analysis was applied to assess the relationship between retreat rates and mean water depth and the potential influence of water depth on tidewater glacier fluctuation. Fjord width is another important controlling factor for tidewater glacier retreat and advance (Mercer Citation1961). To test this relationship, fjord widths were measured at the 2004–2006 and 2018 terminus of each tidewater glacier and compared to corresponding length changes. The 2004–2006 to 2018 interval represents the peak period of average tidewater glacier retreat in the study, including the rapid collapse of Barry, Nellie Juan, and Surprise glaciers.
Table 5. Comparison of retreat rates and mean water depth for eight tidewater glaciers in the study area
Uncertainty
The sources of uncertainty relating to the use of remote sensing in glacier studies are well documented and include satellite image quality and resolution issues, georeferencing issues, manual editing errors (e.g., digitizing outlines), and the analyst’s degree of skill in interpreting features such as ice flow divides, snowlines, glacier boundaries, and debris cover (DeBeer and Sharp Citation2007; Racoviteanu et al. Citation2009; Paul et al. Citation2013, Citation2017; McNabb and Hock Citation2014; Osipov and Osipova Citation2014; Paul and Mölg Citation2014; Pfeffer et al. Citation2014; Qiang, Lei, and Chuan-Yan Citation2014; Kienholz et al. Citation2015). The following study design criteria were applied to minimize potential errors: (1) exclude glaciers with heavy debris cover at margins; (2) avoid satellite images with significant cloud cover or shadows along glacier margins; (3) select late summer (July–September) satellite images to minimize seasonal snow; and (4) obtain georeferenced and orthorectified maps and satellite images, allowing for direct integration into GIS, and check for geolocation errors.
Strategies recommended by Paul et al. (Citation2017) were followed to assess the accuracy and precision of glacier outlines and lengths derived from satellite imagery, including the accuracy measures outline overlay, literature values, and multiple digitizing. Outline overlay involves a qualitative analysis of multiple glacier outlines over the source image and helps identify potential sources of error. This method, applied to six study glaciers, revealed differences in outlines in the range of 30–90 m (one to three pixels). The errors were in discrete areas of glacier margins where boundaries between snow and ice, or debris and ice, were difficult to assess.
Literature values provide an additional source of accuracy estimates for digitizing glacier outlines. Uncertainty estimates for manual glacier outline editing range from ~2 percent to 5 percent of the area measured (Paul et al. Citation2013; Bajracharya, Maharjan, and Shrestha Citation2014; Paul and Mölg Citation2014; Pfeffer et al. Citation2014). McNabb and Hock (Citation2014) estimated a horizontal accuracy of 60 m for Landsat images, incorporating digitizing and georeferencing errors. Analyst precision testing performed by Fischer et al. (Citation2014) resulted in a predicted precision of ±3.1 percent of the area for glaciers larger than 5.0 km2. Previous studies show a decrease in estimates of uncertainty for glacier area measurement as glacier area increases (Fischer et al. Citation2014; MacHguth and Huss Citation2014; Pfeffer et al. Citation2014). Analyst precision testing in this study followed the methodology recommended by Paul et al. (Citation2017), including the selection of six glaciers of different sizes (10–77 km2) and three iterations of manual outline digitizing for each glacier. The calculated standard deviation ranged from 0.16 to 0.42 km2, and the percentage precision ranged from 0.7 to 2.0 percent. For comparison purposes it is important to note that this study avoided glaciers with debris cover along margins, whereas other studies may include all debris-covered glaciers.
Bahr (Citation1997) and Bahr, Meier, and Peckham (Citation1997) recognized log–log scaling relationships for glacier volume, area, and length. Establishing area–length scaling relationships allows for the comparison of differences between regions and methods of glacier center line development and provides a simple method for estimating glacier length from area measurements (Le Bris and Paul Citation2013; MacHguth and Huss Citation2014; Kienholz et al. Citation2015). Area–length scaling for the thirty land-based glaciers in this study resulted in the log–log relationship of L = 1.7836A0.5416 (R2 = 0.898), similar to the relationship established by Le Bris and Paul (Citation2013), who developed the center line length calculation method applied in this study (Supplementary Figure 1).
The large uncertainty resulting from the volume–area power law scaling approach was estimated by calculating glacier volume using the upper (c = 0.2055 m3−2γ; Radić and Hock Citation2011) and lower (c = 0.12 m3−2γ; Van de Wal and Wild Citation2001) ends of the range of published c estimates. The uncertainty associated with the forward and backward extrapolation of area estimates for unmeasured glaciers was calculated as the percentage difference between measured and extrapolated average area change rates for the study glaciers from 1950–1957 to 2004–2006 and 2004–3006 to 2018. Average area change rates were derived from measured study glaciers larger than 10 km2. This approach underestimates volume–area scaling results because relative area losses were greater for smaller measured glaciers, and over 98 percent of unmeasured glaciers were smaller than 10 km2. The uncertainty was estimated as 3.8 percent for backward (2004–2006 to 1950–1957) and 2.9 percent for forward (2004–2006 to 2018) extrapolation.
Climate analysis
Climate time series were developed for four weather stations in the PWS region to assess the relationship between glacier changes and climate. Time series included temperature and precipitation for each station for annual, ablation season, and accumulation season averages. Detailed climate time series methodology is provided in the Supplementary Material. Previous studies suggest a relationship between abnormally warm summer sea surface temperatures and the onset of rapid glacier retreat (Schild and Hamilton Citation2013; McNabb and Hock Citation2014). To further investigate potential factors on tidewater glacier fluctuations, sea surface temperature (SST) data were obtained from NOAA (NOAA Citation2019c; https://tidesandcurrents.noaa.gov/stations.html) for the Cordova, Seward, and Valdez stations. Mean summer (June–August) SSTs were calculated for Valdez station from 1994 to 2018. Gaps in the water temperature record for Cordova and Seward limited the extent of the mean summer SST analysis to 2015.
Temperature in Alaska is influenced by climate signals including the Pacific Decadal Oscillation (PDO) and shifts in atmospheric circulation in the Arctic. The PDO refers to a cyclical pattern of SST and sea level pressure changes occurring in the North Pacific over periods of ten years or more. North Pacific SST anomalies define the PDO and shift between positive and negative phases. The positive PDO phase is associated with warmer and wetter conditions along the coast of Alaska (Arendt, Walsh, and Harrison Citation2009). The Arctic Oscillation (AO) refers to the changing strength of the polar vortex (Thompson and Wallace Citation1998), measured as an index based on sea level pressure anomalies. In the positive AO phase, strong circulation at the North Pole contains the spread of colder air to the midlatitudes, leading to cooler temperatures and increased winter precipitation in Alaska. PDO and AO data from 1950 to 2018 were acquired from NOAA (NOAA Citation2019d; https://www.ncdc.noaa.gov/teleconnections/) and used in regressions to quantify relationships with temperature and precipitation. Time series were developed to provide a visual comparison of glacier changes and significant shifts in PDO and AO index phases.
Results
Length change metrics document the horizontal retreat of land-based study glaciers from ~1950 to 2018 and a period of accelerated retreat from 2004–2006 to 2018. Land-based glaciers retreated by an average of 1.8 km (14 percent of total length) since the 1950s (), with minimal spatial variation (~1 percent) across the three subregions. The average rate of retreat for all land-based glaciers more than doubled to 48 m a−1 after 2004–2006 (, ). Based on mapped LIA extents (Wiles, Barclay, and Calkin Citation1999), glacier retreat rates averaged 14 m a−1 from the LIA maximum to the 1950s (). Average retreat rates for this subset of glaciers peaked after 2004–2006, consistent with average retreat rates for all other glaciers in this study. The combined area of all land-based glaciers decreased by 228 km2 (17 percent loss) from ~1950 to 2018 (), with 36 percent of the land-based glacier area loss occurring from 2004–2006 to 2018. The percentage of area loss was similar across the three subregions. The total glacierized area change rates and average rate of area loss for land-based glaciers peaked from 2004–2006 to 2018 (). During this period, 80 percent of land-based glaciers experienced the highest annual area loss rate (). The regression between glacier relative area change (1950s–2018) and the six derived morphometric variables, representing topographic and geometric glacier properties, indicates a weak relationship (R2 = 0.17). Among the six variables, only glacier area showed a significant correlation (p = .03) with glacier relative area change ().
Table 6. Average length and area change metrics for land-based and tidewater glaciers
Table 7. Regression between glacier area change from 1950s to 2018 and six derived morphometric variables
Mass of the forty-three measured study glaciers declined by 63 ± 10 Gt from the 1950s to 2018, equivalent to a sea level rise of 0.174 mm. Simple upscaling of area and volume changes to unmeasured glaciers across the PWS resulted in an estimated aggregate glacier mass loss for the PWS of 379 ± 38 Gt, equivalent to a 1.047 mm rise in sea level from the 1950s to 2018 (). The catastrophic retreat of Columbia Glacier accounted for over half (201 ± 11 Gt) of the mass loss for the PWS. Since the 1950s, over 37 percent of the aggregate PWS glacier mass loss occurred after 2004 with an equivalent sea level rise.
Table 8. Glacier mass (gigatons) and SLE changes from 1950–1957 to 2018
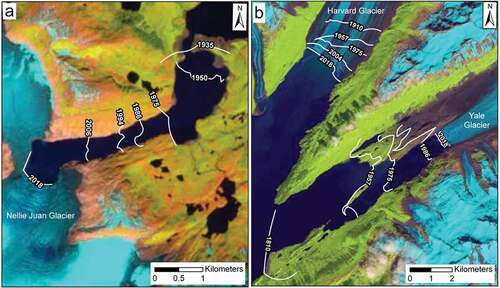
Tidewater glaciers behaved asynchronously compared to land-based glaciers, as indicated by differing periods of peak area and length loss and a much lower average rate of retreat. The combined area of study tidewater glaciers declined by 88 km2 or 6.1 percent since the 1950s (; ), with peak losses occurring between 1973–1975 and 1986 (). Tidewater glaciers lost an average of 4.3 percent of total length, compared to a 14.1 percent loss for land-based glaciers since the 1950s (). The average retreat rate for tidewater glaciers fluctuated across the study period, with highest rates occurring in 2004–2006 to 2018 and 1973–1975 to 1986 (). The period 1986 to 1994 represents the only study interval with positive average length change rates (2 m a−1) for all tidewater glaciers, with four glaciers reaching peak advance rates (). Nellie Juan Glacier provides an example of the tidewater glacier cycle with rapid retreat of over 5 km since the glacier withdrew from the terminal moraine shoal after 1935 (Barclay, Wiles, and Calkin Citation2003; ). Nellie Juan Glacier’s period of rapid retreat peaked at a rate of 124 m a−1 from 2004–2006 to 2018. During the same period, Barry Glacier retreated over 2 km, into a widening fjord, from a relatively stable position at the head of the inlet shared with Cascade and Coxe glaciers. The glaciers of College Fjord highlight the asynchronous behavior of tidewater glaciers. Since the 1950s, Harvard Glacier advanced slowly, whereas the neighboring Yale Glacier retreated over 5 km ().
Figure 2. Percentage glacier length and area change since the 1950s. Vertical bars represent calculated uncertainty (one standard deviation)
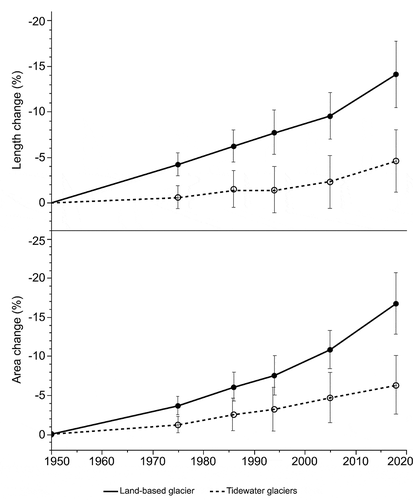
Figure 3. (a) Average annual glacier retreat rates; (b) average annual glacier area change rates; and (c) total glacierized area annual change rates. Change rates presented by glacier type (land-based n = 30; tidewater n = 13)
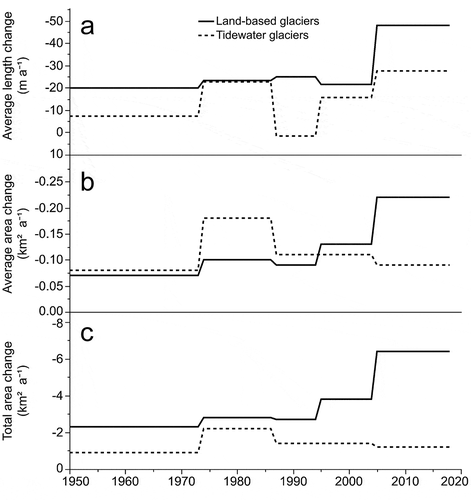
Figure 4. Period area change rates (bars) and glacier area in 2018 (dashed line) for land-based glaciers
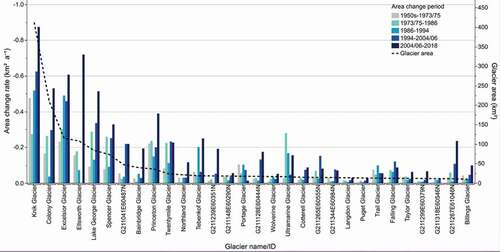
Figure 5. Length change rates for individual tidewater glaciers by time period
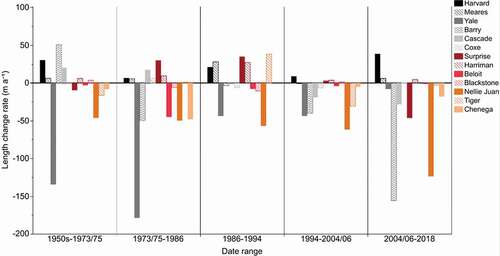
Figure 6. (a) Chronology of retreat for Nellie Juan Glacier between 1935 and 2018. Terminus position for 1935 from photographs in Field (1975; as cited in Wiles, Barclay, and Calkin Citation1999) and (b) chronology of retreat for Harvard and Yale glaciers between 1810 and 2018. Yale Glacier 1810 terminus position from Field and others (1958; as cited in Mercer Citation1961) and Harvard Glacier 1910 terminus position from Tarr and Martin (1914; as cited in Sturm et al. Citation1991)
Climatology
Climate trend analysis included weather station precipitation and temperature data for the four study area weather stations (Supplementary Table 4). Trend analysis results indicate increasing average annual air temperatures in the study area, including an increase from 3.1°C to 4.7°C at Cordova from 1951 to 2017 (). Significant winter warming occurred at PWS maritime stations (+0.9°C) from 1988 to 2017 (). This increase is noteworthy because the average PWS maritime winter temperature is near freezing (−0.5°C). Increasing winter temperatures may expose larger areas of maritime glaciers to temperatures above freezing (Arendt, Walsh, and Harrison Citation2009). Average summer temperature increased from 5.4°C to 6.1°C from 1968 to 2017 at the higher elevation Wolverine Glacier weather station (). Annual winter precipitation decreased by an average of 319 mm (20 percent decline) at PWS maritime stations from 1976 to 2017 (). Analysis of summer water temperature data obtained from Valdez station indicate a 2.8°C rise from 2008 to 2016 (). Data from Cordova and Seward showed similar trends of increasing summer water temperatures beginning in the late 2000s.
Figure 7. Time series of (a) mean annual temperature at Cordova Airport station; (b) average winter temperature (PWS maritime stations); (c) mean summer temperature at Wolverine Glacier Station; and (d) average winter precipitation (PWS maritime stations). Dashed lines show statistically significant trends
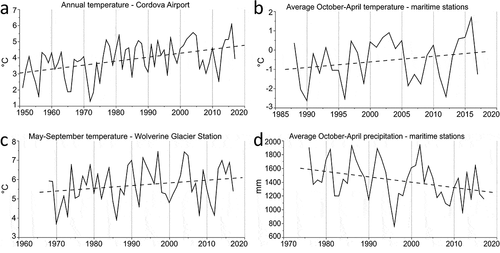
Figure 8. Comparison between (a) annual summer (May–September) and winter (October–April) temperature and precipitation; (b) mean annual summer sea surface temperatures; (c) Pacific decadal oscillation (PDO); (d) Arctic Oscillation (AO); and (e) length change rates for land-based and tidewater glaciers
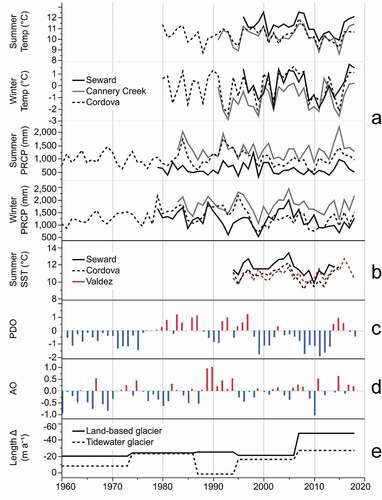
Figure 9. (a) Relationship between mean fjord water depth and retreat rates for tidewater glaciers and (b) comparison between tidewater glacier length and fjord width changes from 2004–2006 to 2018. Note, measurements based on early August 2004–2006 and late July 2018 imagery
Climate indices provide evidence of significant climate phase shifts in Alaska, with a period of positive PDO from 1977 to 1997 and a large shift to positive AO in 1989 (Arendt, Walsh, and Harrison Citation2009). Regression analysis was conducted to identify relationships between PDO, AO, air temperature, and precipitation from 1950 to 2018. No significant correlations were identified between PDO and AO. Regression between PDO and annual temperature at Cordova indicates a strong correlation from 1952 to 1989 (R2 = 0.46; p < .0001); however, the correlation weakens from 1990 to 2017 (R2 = 0.23; p = .012), suggesting a shift in forces responsible for recent warming in Alaska. Weak correlations were observed between winter PDO and precipitation at Seward (R2 = 0.12; p = .026) from 1976 to 2017 and Wolverine Glacier (R2 = 0.15; p = .034) from 1986 to 2015.
Discussion
The majority of coastal glaciers in the study area are retreating, with rapid mass loss occurring from the mid-2000s to 2018. These findings are consistent with reported glacier mass loss in Alaska (Arendt et al. Citation2006; Molnia Citation2008; Arendt, Walsh, and Harrison Citation2009; Berthier et al. Citation2010; Yang et al. Citation2020) and western North America (Menounos et al. Citation2019). O’Neel et al. (Citation2019) measured an area loss of 1.5 km2 for Wolverine Glacier from 1971 to 2018, which is similar to the findings in this study (1.4 km2 over 1975–2018), and attributed mass loss to warmer summer temperatures. Both studies estimated the highest rates of area loss occurring from 2006 to 2018 at Wolverine Glacier.
Yang et al. (Citation2020) compiled new inventories for glaciers in the Kenai Peninsula, including the Sargent Icefield and Spencer–Blackstone Ice Complex, and found a significant loss in total glacier area (~12 percent) from 1986 to 2016. Here, measured glaciers in the Sargent Icefield and Spencer–Blackstone Ice subregions lost ~8 percent of their total area from 1986 to 2018. The lower percentage of area loss compared to Yang et al. (Citation2020) is attributed to the exclusion of glaciers smaller than 10 km2. Other studies in Alaska (Meier and Dyurgerov Citation2002), the Northern Alps (Paul et al. Citation2004), and the Chinese Tien Shan (K. Li et al. Citation2011; Y. Li and Li Citation2014) suggest that glacier area as a key indicator of glacier loss, with smaller glaciers tending to have greater relative reductions.
Arendt et al. (Citation2006) used airborne altimetry measurements and multiple extrapolation methods, including special considerations for tidewater glaciers, to estimate a regional contribution of 0.02 mm yr−1 SLE and a net balance rate of −7.4 ± 1.1 km3 yr−1 water equivalent for glaciers covering 9,300 km2 of the western Chugach Mountains and Talkeetna Mountains from 1950–1957 to 2001–2004. Here, simple upscaling to a similar total aggregate glacier area of 9,600 km2, including glaciers in the western Chugach Mountains, Sargent Icefield, and Spencer–Blackstone Ice Complex, results in an estimated rate of 0.013 mm yr−1 SLE and a net balance rate of −4.6 ± 0.5 km3 yr−1 water equivalent from 1950–1957 to 2004–2010.
The asynchronous glacier cycles observed among tidewater suggest the influence of factors other than climate, such as fjord geometry, water depth, mass balance, and sediment dynamics (Meier and Post Citation1987; Brinkerhoff, Truffer, and Aschwanden Citation2017). Warming waters in the PWS may have contributed to the increased average rate of tidewater glacier retreat observed since the mid-2000s (, ), and the rapid collapse of Nellie Juan and Barry glaciers. Regionally, SST anomalies throughout the Gulf of Alaska increased by up to 3°C to 4°C since 2013 (Campbell Citation2018). Other studies from Alaska and Greenland stress the importance of ocean water temperatures as a controlling factor for submarine glacial melting and calving rates (Motyka et al. Citation2003, Citation2011; Post et al. Citation2011).
Earlier studies linked rapid retreat of glaciers in the Gulf of Alaska to water depth and emphasized the importance of nonclimatic controls on tidewater glacier fluctuations (Post Citation1975; Meier and Post Citation1987). Here, regression analysis between tidewater glacier retreat rate and mean water depth () results in a significant positive relationship (R2 = 0.58; p < .001). Water depth may explain the rapid retreat of Yale Glacier, occurring from 1973 to 1986. During this period, Yale Glacier retreated over the deepest waters in Yale Arm at a rate of 179 m a−1 (). Further investigation into fjord geometry suggests that fjord width may be another controlling factor for tidewater glacier advance and retreat. From the mid-2000s to 2018, all four advancing tidewater glaciers moved into a narrowing fjord, whereas Nellie Juan and Barry glaciers experienced the most rapid retreat in fjords that were rapidly widening (). The relationships presented here suggest that factors other than climate are influencing tidewater glacier fluctuations. McNabb and Hock (Citation2014) determined that tidewater glacier advance and retreat patterns in Alaska are highly variable and noted a lack of evidence for a coherent regional-scale retreat. Here, the lower average rates of tidewater glacier retreat and area loss compared to land-based glaciers are attributed to nonclimatic controls and the variability in tidewater glacier cycle position for the thirteen studied tidewater glaciers.
Increasing temperatures and decreasing winter precipitation explain overall glacier recession in the study area. The accelerated retreat after 2004–2006 is likely attributable to an unfavorable combination of temperature and precipitation changes that occurred before and after 2004–2006. shows the relationship between the average length change rates, temperature precipitation trends for summer and winter seasons, summer SSTs, and climate indices. Summer temperatures and SSTs increased from ~2012 to 2017. To further drive accelerated melting after 2004–2006, winter temperature increased sharply at all stations from ~2012 to 2016, and summer precipitation increased at all stations from ~2009 and ~2013. Preceding this period of increased summer precipitation, warming, and accelerated glacier retreat, a steep decline in winter season precipitation began around 2002 and continued to ~2010 (Cannery Creek and Seward).
The brief shifts to negative PDO and positive AO after 1988 coincide with a period of positive average length change rates for all tidewater glaciers (–). However, this relationship does not extend to the recent period of increased temperature and accelerated glacier retreat. After 2004, PDO was strongly negative with the exception of a short period of positive PDO from 2014 to 2016 (). Arendt, Walsh, and Harrison (Citation2009) suggested that forces other than climate indices may be responsible for warming after 1999, when AO began to trend neutral and PDO shifted to the negative phase.
Conclusions
Analysis of topographic maps from the 1950s and Landsat imagery from 1973–1975, 1986, 1994, 2004–2006, and 2018 supported the development of repeat glacier inventories for forty-three glaciers in the western Prince William Sound, Alaska. Coastal glaciers in study area have been retreating since the end of the LIA, with a period of accelerated retreat and mass loss from the mid-2000s to 2018. Simple upscaling to the entire PWS results in an estimated aggregate glacier mass loss of 379 Gt, equivalent to a 1.047 mm rise in sea level from the 1950s to 2018. Glacier retreat correlates with climate trends including increased summer and winter temperatures and decreased winter precipitation over the last several decades. Sequencing of declining winter precipitation before 2004–2006, followed by increasing summer precipitation and summer and winter temperatures, may have forced accelerated melting after the mid-2000s. The lack of significant statistical relationships between topographic and geometric glacier properties and relative glacier area change further supports the suggestion that climate is the key driver for land-based glacier loss in the study area.
Tidewater glaciers behaved asynchronously compared to land-based glaciers, as indicated by differing periods of peak area and length loss and a much lower average rate of retreat (). However, though some tidewater glaciers are advancing, the combined area of all tidewater glaciers in the study declined by approximately 6 percent since the 1950s. This overall decline in tidewater glacier area is likely driven by factors other than climate, such as fjord geometry, bathymetry, and warming summer SSTs. However, climate may have triggered cycles of retreat and indirectly contributed to the overall loss in tidewater glacier mass because warming waters in the PWS likely increased calving rates and the rapid collapse of Barry, Nellie Juan, and Yale glaciers. The tidewater glacier cycle and high variability in advance and retreat patterns for the thirteen study tidewater glaciers explains the lower average rates of tidewater glacier retreat and area loss compared to land-based glaciers.
Expanding the study to the eastern PWS and along the Gulf of Alaska may provide insights regarding the extent of recent accelerated retreat documented in this study. Incorporating remote sensing–based or physical measurements of glacier thinning and volume changes would provide a more accurate estimate of glacier response to climate change in the study area. Further glacier-specific studies are warranted to better understand the complex interaction of climate, fjord geometry, and tidewater glacier mass balance.
Supplemental Material
Download Zip (1.5 MB)Acknowledgments
I thank Gregory Wiles for his suggestions and support during the research design process. I also thank Andrew Phillips for his constructive comments and helping to improve earlier drafts of this article. This work is not a product of the United States Government or the U.S. Environmental Protection Agency. The author has not carried out this work in any governmental capacity. The views expressed are his own and do not necessarily represent those of the United States or the U.S. Environmental Protection Agency.
Disclosure statement
No potential conflict of interest was reported by the author.
Supplementary material
Supplemental data for this article can be accessed on the publisher’s website.
References
- Adalgeirsdóttir, G., K. A. Echelmeyer, and W. D. Harrison. 1998. Elevation and volume changes on the Harding Icefield, Alaska. Journal of Glaciology 44 (148):570–82. doi:https://doi.org/10.1017/S0022143000002082.
- Alaska Climate Research Center. 2019. Accessed January 27, 2019, from http://climate.gi.alaska.edu/AKweather/Index.html.
- Arendt, A., J. Walsh, and W. Harrison. 2009. Changes of glaciers and climate in northwestern North America during the late twentieth century. Journal of Climate 22 (15):4117–34. doi:https://doi.org/10.1175/2009JCLI2784.1.
- Arendt, A., K. Echelmeyer, W. Harrison, C. Lingle, S. Zirnheld, V. Valentine, B. Ritchie, and M. Druckenmiller. 2006. Updated estimates of glacier volume changes in the western Chugach Mountains, Alaska, and a comparison of regional extrapolation methods. Journal of Geophysical Research: Earth Surface 111 (F3):1–12. doi:https://doi.org/10.1029/20.05JF000436.
- Arendt, A., K. A. Echelmeyer, W. D. Harrison, C. S. Lingle, and V. B. Valentine. 2002. Rapid wastage of Alaska glaciers and their contribution to rising sea level. Science 297 (5580):382–86. doi:https://doi.org/10.1126/science.1072497.
- Bahr, D. B. 1997. Width and length scaling of glaciers. Journal of Glaciology 43 (145):557–62. doi:https://doi.org/10.1017/S0022143000035164.
- Bahr, D. B., F. Meier, and S. D. Peckham. 1997. The physical basis of glacier volume-area scaling. Journal of Geophysical Research 102 (20):355–62. doi:https://doi.org/10.1029/97JB01696.
- Bahr, D. B., W. T. Pfeffer, and G. Kaser. 2015. A review of volume-area scaling of glaciers. Reviews of Geophysics 53 (1):95–140. doi:https://doi.org/10.1002/2014RG000470.
- Bajracharya, S. R., S. B. Maharjan, and F. Shrestha. 2014. The status and decadal change of glaciers in Bhutan from the 1980s to 2010 based on satellite data. Annals of Glaciology 55 (66):159–66. doi:https://doi.org/10.3189/2014AoG66A125.
- Barclay, D., G. Wiles, and P. Calkin. 2003. An 850 year record of climate and fluctuations of the iceberg-calving Nellie Juan Glacier, south central Alaska, U.S.A. Annals of Glaciology 36:51–56. doi:https://doi.org/10.3189/172756403781816419.
- Beamer, J. P., D. F. Hill, A. Arendt, and G. E. Liston. 2016. High-resolution modeling of coastal freshwater discharge and glacier mass balance in the Gulf of Alaska watershed. Water Resources Research 52 (5):3888–909. doi:https://doi.org/10.1002/2015WR018457.
- Berthier, E., C. Larsen, W. J. Durkin, M. J. Willis, and M. E. Pritchard. 2018. Brief communication: Unabated wastage of the Juneau and Stikine icefields (Southeast Alaska) in the early 21st century. Cryosphere. Copernicus GmbH. doi:https://doi.org/10.5194/tc-12-1523-2018.
- Berthier, E., E. Schiefer, G. K. C. Clarke, B. Menounos, and F. Rémy. 2010. Contribution of Alaskan glaciers to sea-level rise derived from satellite imagery. Nature Geoscience 3 (2):92–95. doi:https://doi.org/10.1038/ngeo737.
- Błaszczyk, M., J. A. Jania, and L. Kolondra. 2013. Fluctuations of tidewater glaciers in Hornsund Fjord (Southern Svalbard) since the beginning of the 20th century. Polish Polar Research 34 (4):327–52. doi:https://doi.org/10.2478/popore-2013-0024.
- Brinkerhoff, D., M. Truffer, and A. Aschwanden. 2017. Sediment transport drives tidewater glacier periodicity. Nature Communications 8 (1). doi: https://doi.org/10.1038/s41467-017-00095-5.
- Calkin, P. E., G. C. Wiles, and D. J. Barclay. 2001. Holocene coastal glaciation of Alaska. Quaternary Science Reviews 20 (1–3):449–61. doi:https://doi.org/10.1016/S0277-3791(00)00105-0.
- Campbell, R. W. 2018. Hydrographic trends in Prince William Sound, Alaska, 1960–2016. Deep-sea Research. Part II, Topical Studies in Oceanography 147:43–57. doi:https://doi.org/10.1016/j.dsr2.2017.08.014.
- Chen, J., and A. Ohmura. 1990. Estimation of Alpine glacier water resources and their change since the 1870s. IAHS Publications 193:127–35.
- DeBeer, C. M., and M. J. Sharp. 2007. Recent changes in glacier area and volume within the southern Canadian Cordillera. Annals of Glaciology 46:215–21. doi:https://doi.org/10.3189/172756407782871710.
- Environmental Systems Research Institute (ESRI). 2019. ArcGIS Protm version 2.2.0. Redlands, CA: GIS Landsat on Amazon Web Services (AWS) portal.
- Field, W. O. 1975. Glaciers of the Chugach Mountains. In Mountain glaciers of the Northern Hemisphere, ed. W. O. Field, Vol. 2, 299–492. Hanover, New Hampshire: U.S. Army Corps of Engineers, Cold Regions Research and Engineering Laboratory.
- Fischer, M., M. Huss, C. Barboux, and M. Hoelzle. 2014. The new Swiss Glacier Inventory SGI2010: Relevance of using high-resolution source data in areas dominated by very small glaciers. Arctic, Antarctic, and Alpine Research 46 (4):933–45. doi:https://doi.org/10.1657/1938-4246-46.4.933.
- Intergovernmental Panel on Climate Change. 2007. Summary for policymakers. Climate change 2007: The physical science basis. Contribution of working group I to the fourth assessment report of the intergovernmental panel on climate change. Fourth assessment report of the intergovernmental panel on climate change. Cambridge, UK: S. Solomon et al. (eds). Cambridge Univ. Press. doi:https://doi.org/10.1038/446727a.
- Kienholz, C., S. Herreid, J. L. Rich, A. A. Arendt, R. Hock, and E. W. Burgess. 2015. Derivation and analysis of a complete modern-date glacier inventory for Alaska and Northwest Canada. Journal of Glaciology 61 (227):403–20. doi:https://doi.org/10.3189/2015JoG14J230.
- Le Bris, R., and F. Paul. 2013. An automatic method to create flow lines for determination of glacier length: A pilot study with Alaskan glaciers. Computers & Geosciences 52:234–45. doi:https://doi.org/10.1016/j.cageo.2012.10.014.
- Li, K., H. Li, L. Wang, and W. Gao. 2011. On the relationship between local topography and small glacier change under climatic warming on Mt. Bogda, Eastern Tian Shan, China. Journal of Earth Science 22 (4):515–27. doi:https://doi.org/10.1007/s12583-011-0204-7.
- Li, Y., and Y. Li. 2014. Topographic and geometric controls on glacier changes in the central Tien Shan, China, since the Little Ice Age. Annals of Glaciology 55 (66):177–86. doi:https://doi.org/10.3189/2014AoG66A031.
- Macheret, Y. Y., P. A. Cherkasov, and L. I. Bobrova. 1988. Tolschina i ob’em lednikov Djungarskogo Alatau po danniy aeroradiozondirovaniya, Materialy Glyatsiologicheskikh Issledovanii: Khronika. Obsuzhdeniya 62:59–71.
- MacHguth, H., and M. Huss. 2014. The length of the world’s glaciers–a new approach for the global calculation of center lines. Cryosphere. doi:https://doi.org/10.5194/tc-8-1741-2014.
- McAfee, S. A., G. Guentchev, and J. K. Eischeid. 2013. Reconciling precipitation trends in Alaska: 1. Station-based analyses. Journal of Geophysical Research Atmospheres 118 (14):7523–41. doi:https://doi.org/10.1002/jgrd.50572.
- McNabb, R. W., and R. Hock. 2014. Alaska tidewater glacier terminus positions, 1948-2012. Journal of Geophysical Research: Earth Surface. doi:https://doi.org/10.1002/2013JF002915.
- Meier, M. F., and A. Post. 1987. Fast tidewater glaciers. Journal of Geophysical Research. doi:https://doi.org/10.1029/JB092iB09p09051.
- Meier, M. F., and M. B. Dyurgerov. 2002. How Alaska affects the world. Science 297:350–51. doi:https://doi.org/10.1126/science.1073591.
- Menounos, B., R. Hugonnet, D. Shean, A. Gardner, I. Howat, E. Berthier, B. Pelto, C. Tennant, J. Shea, M.-J. Noh, et al. 2019. Heterogeneous changes in western North American glaciers linked to decadal variability in zonal wind strength. Geophysical Research Letters 46 (1):200–09. doi:https://doi.org/10.1029/2018GL080942.
- Mercer, J. H. 1961. The response of fjord glaciers to changes in the firn limit. Journal of Glaciology 3 (29):850–58. Cambridge University Press (CUP). doi:https://doi.org/10.3189/s0022143000027222.
- Molnia, B. F. 2008. Glaciers of North America—Glaciers of Alaska, in Satellite Image Atlas of Glaciers of the World, ed. J. R. S. Williams and J. G. Ferrigno, pp. K52–K83. Reston, VA: United States Geological Survey. U.S. Geological Survey Professional Paper 1386-K.
- Motyka, R. J., L. Hunter, K. A. Echelmeyer, and C. Connor. 2003. Submarine melting at the terminus of a temperate tidewater glacier, LeConte Glacier, Alaska, U.S.A. Annals of Glaciology 36:57–65. doi:https://doi.org/10.3189/172756403781816374.
- Motyka, R. J., M. Truffer, M. Fahnestock, J. Mortensen, S. Rysgaard, and I. Howat. 2011. Submarine melting of the 1985 Jakobshavn Isbræ floating tongue and the triggering of the current retreat. Journal of Geophysical Research: Earth Surface 116 (F1). doi: https://doi.org/10.1029/2009JF001632.
- Muir, J. 1902. Notes on the Pacific coast glaciers. In Alaska—Narrative, glaciers, natives, Volume 1 of the Harriman Alaska expedition with cooperation of the Washington Academy of Sciences, ed. J. Burroughs, J. Muir, and G. B. Grinnel, 119–35. New York: Doubleday, Page and Company.
- NASA/METI/AIST/Japan Spacesystems, and U.S./Japan ASTER Science Team. 2011. ASTER Global Digital Elevation Model (Alaska DEM). NASA EOSDIS Land Processes DAAC. doi: https://doi.org/10.5067/ASTER/ASTGTM.002
- NOAA. 2019a. Climate data online. Available at https://www.ncdc.noaa.gov/cdo-web/
- NOAA. 2019b. Bathymetric data viewer. Available at https://maps.ngdc.noaa.gov/viewers/bathymetry/
- NOAA. 2019c. Tides and Currents data. Available at https://tidesandcurrents.noaa.gov/stations.html?type=Physical%20Oceanography
- NOAA. 2019d. Teleconnections data. Available at https://www.ncdc.noaa.gov/teleconnections/
- Nuth, C., J. Kohler, M. König, A. Von Deschwanden, J. O. Hagen, A. Kääb, G. Moholdt, and R. Pettersson. 2013. Decadal changes from a multi-temporal glacier inventory of Svalbard. The Cryosphere 7 (5):1603–21. doi:https://doi.org/10.5194/tc-7-1603-2013.
- O’Neel, S., C. McNeil, L. C. Sass, C. Florentine, E. H. Baker, E. Peitzsch, D. McGrath, A. G. Fountain, and D. Fagre. 2019. Reanalysis of the US Geological Survey Benchmark Glaciers: Long-term insight into climate forcing of glacier mass balance. Journal of Glaciology 65 (253):850–66. doi:https://doi.org/10.1017/jog.2019.66.
- Osipov, E. Y., and O. P. Osipova. 2014. Mountain glaciers of southeast Siberia: Current state and changes since the Little Ice Age. Annals of Glaciology 55 (66):167–76. doi:https://doi.org/10.3189/2014AoG66A135.
- Paul, F., A. Kääb, M. Maisch, T. Kellenberger, and W. Haeberli. 2004. Rapid disintegration of Alpine glaciers observed with satellite data. Geophysical Research Letters 31 (21):L21402. doi:https://doi.org/10.1029/2004GL020816.
- Paul, F., and N. Mölg. 2014. Hasty retreat of glaciers in northern Patagonia from 1985 to 2011. Journal of Glaciology 60 (224):1033–43. doi:https://doi.org/10.3189/2014JoG14J104.
- Paul, F., S. Winsvold, R. Le Bris, K. Scharrer, T. Bolch, N. E. Barrand, H. Frey, et al. 2013. On the accuracy of glacier outlines derived from remote-sensing data. Annals of Glaciology 54 (63):171–82. doi:https://doi.org/10.3189/2013aog63a296.
- Paul, F., T. Bolch, K. Briggs, A. Kääb, M. McMillan, R. McNabb, T. Nagler, C. Nuth, P. Rastner, T. Strozzi, et al. 2017. Error sources and guidelines for quality assessment of glacier area, elevation change, and velocity products derived from satellite data in the Glaciers_cci project. Remote Sensing of Environment 203 (November):256–75. doi:https://doi.org/10.1016/j.rse.2017.08.038.
- Pfeffer, W. T., A. A. Arendt, A. Bliss, T. Bolch, J. G. Cogley, A. S. Gardner, J.-O. Hagen, R. Hock, G. Kaser, C. Kienholz, et al. 2014. The Randolph Glacier Inventory: A globally complete inventory of glaciers. Journal of Glaciology 60 (221):537–52. doi:https://doi.org/10.3189/2014JoG13J176.
- Pike, R. J., and S. E. Wilson. 1971. Elevation-relief ratio, hypsometric integral, and geomorphic area-altitude analysis. Bulletin of the Geological Society of America 82:1079. doi:https://doi.org/10.1130/0016-7606(1971)82[1079:ERHIAG]2.0.CO;2.
- Porter, S. C. 1986. Pattern and forcing of Northern Hemisphere glacier variations during the last millennium. Quaternary Research 26 (1):27–48. doi:https://doi.org/10.1016/0033-5894(86)90082-7.
- Post, A. 1975. Preliminary hydrography and historic terminal changes of Columbia Glacier. Alaska, US Geological Survey Hydrologic Investigations Atlas. 559, 3 sheets, scale 1:20,000.
- Post, A., S. O’Neel, R. J. Motyka, and G. Streveler. 2011. A complex relationship between calving glaciers and climate. Eos, Transactions American Geophysical Union 92 (37):305–06. doi:https://doi.org/10.1029/2011EO370001.
- Qiang, B., H. Lei, and Z. Chuan-Yan. 2014. Monitoring glacier changes of recent 50 years in the upper reaches of Heihe River Basin based on remotely-sensed data. IOP Conference Series: Earth and Environmental Science 17:012138. doi:https://doi.org/10.1088/1755-1315/17/1/012138.
- Racoviteanu, A. E., F. Paul, B. Raup, S. Jodha, S. Khalsa, and R. Armstrong. 2009. Challenges and recommendations in mapping of glacier parameters from space: Results of the 2008 Global Land Ice Measurements from Space (GLIMS) workshop, Boulder, Colorado, USA. Annals of Glaciology 50 (53):53. doi:https://doi.org/10.3189/172756410790595804.
- Radić, V., and R. Hock. 2011. Regionally differentiated contribution of mountain glaciers and ice caps to future sea-level rise. Nature Geoscience 4 (2):91–94. doi:https://doi.org/10.1038/NGEO1052.
- Rasmussen, L. A., H. Conway, R. M. Krimmel, and R. Hock. 2011. Surface mass balance, thinning and iceberg production, Columbia Glacier, Alaska, 1948-2007. Journal of Glaciology 57 (203):431–40. doi:https://doi.org/10.3189/002214311796905532.
- Raup, B. H., A. Racoviteanu, S. J. S. Khalsa, C. Helm, R. Armstrong, and Y. Arnaud. 2007. The GLIMS Geospatial Glacier Database: A New Tool for Studying Glacier Change. Global and Planetary Change 56:101–110. doi:https://doi.org/10.1016/j.gloplacha.2006.07.018
- RGI Consortium. 2017. Randolph Glacier Inventory - A dataset of global glacier outlines: Version 6.0. Colorado, USA: Technical Report, Global Land Ice Measurements from Space. doi:https://doi.org/10.7265/N5-RGI-60.
- Santos, J. A., L. J. Cunha, C. E. Cordova, and G. C. Wiles. 2010. Holocene glacial history of College Fjord, south-central Alaska. Polar Geography 33 (3–4):101–14. doi:https://doi.org/10.1080/1088937X.2010.543551.
- Schild, K. M., and G. S. Hamilton. 2013. Seasonal variations of outlet glacier terminus position in Greenland. Journal of Glaciology 59 (216):759–70. doi:https://doi.org/10.3189/2013JoG12J238.
- Sturm, M., D. K. Hall, C. S. Benson, and W. O. Field. 1991. Non-climatic control of glacier-terminus fluctuations in the Wrangell and Chugach Mountains, Alaska, USA. Journal of Glaciology 37 (127):348–56. doi:https://doi.org/10.1017/S0022143000005785.
- Thompson, D. W. J., and J. M. Wallace. 1998. The Arctic Oscillation signature in the wintertime geopotential height and temperature fields. Geophysical Research Letters 25 (9):1297–300. doi:https://doi.org/10.1029/98GL00950.
- U.S. Geological Survey. 2019. Topoview Mapping Service. Available at https://ngmdb.usgs.gov/topoview/viewer/#4/40.00/–100.00
- Van de Wal, R. S. W., and M. Wild. 2001. Modelling the response of glaciers to climate change by applying volume-area scaling in combination with a high-resolution GCM. Climate Dynamics 18 (3–4):359–66. doi:https://doi.org/10.1007/s003820100184.
- Wei, J., S. Liu, W. Guo, X. Yao, J. Xu, W. Bao, and Z. Jiang. 2014. Surface-area changes of glaciers in the Tibetan Plateau interior area since the 1970s using recent Landsat images and historical maps. Annals of Glaciology. doi:https://doi.org/10.3189/2014AoG66A038.
- Wiles, G. C., D. J. Barclay, and P. E. Calkin. 1999. Tree-ring-dated Little Ice Age histories of maritime glaciers from western Prince William Sound, Alaska. The Holocene 9 (2):163–73. doi:https://doi.org/10.1191/095968399671927145.
- Winsvold, S. H., L. M. Andreassen, and C. Kienholz. 2014. Glacier area and length changes in Norway from repeat inventories. Cryosphere. doi:https://doi.org/10.5194/tc-8-1885-2014.
- Xiao, C., S. Liu, L. Zhao, Q. Wu, P. Li, C. Liu, Q. Zhang, Y. Ding, T. Yao, Z. Li, et al. 2007. Observed changes of cryosphere in China over the second half of the 20th century: An overview. Annals of Glaciology 46:382–90. doi:https://doi.org/10.3189/172756407782871396.
- Yang, R., R. Hock, S. Kang, D. Shangguan, and W. Guo. 2020. Glacier mass and area changes on the Kenai Peninsula, Alaska, 1986–2016. Journal of Glaciology 1–15. doi:https://doi.org/10.1017/jog.2020.32.