
 ?Mathematical formulae have been encoded as MathML and are displayed in this HTML version using MathJax in order to improve their display. Uncheck the box to turn MathJax off. This feature requires Javascript. Click on a formula to zoom.
ABSTRACT
Permafrost occurs in the high Atacama Desert, and its thermal state was characterized at a study site 5,075 m a.s.l., at the lower regional altitude boundary for permafrost. The permafrost body is about 5 m thick and located in the hydrothermal alteration zone. The freeze–thaw layer and upper part of the permafrost layer temperatures were measured at 0 to 39 cm depth at 1-cm resolution throughout the year. The upper 3 cm of the ground experienced more than 100 freeze–thaw cycles in 2019. The maximum thaw depth was 14 cm. No significant thermal offset is observed between the annual mean of the surface temperature and the top permafrost boundary. The 14-m borehole reveals that the geothermal gradient was quite high at 200°C/km. In 2019 the seventy days of snow cover impacted the surface energy budget. Winter and summer snow conditions contribute to cooling the surface temperature regime in different ways.
Introduction
Tropical high mountain permafrost has been reported in Hawaii on Mauna Kea (Woodcock Citation1974; Schorghofer, Leopold, and Yoshikawa Citation2017), Iztaccíhuatl (Andrés et al. Citation2011) and Pico de Orizaba (Vizoto Citation2018) in Mexico, Kilimanjaro Tanzania (Yoshikawa Citation2013), the southern Peruvian Andes (Yoshikawa et al. Citation2020), and Chile (Nagy et al. Citation2018). In order to understand the thermal state of tropical desert mountain permafrost and active layer cycles, we consider four conditions, each substantially different from polar regions: (1) minimal seasonal temperature variation, resulting in low numbers of thawing and freezing degree days (FDD) and shallow active layer depth and (2) diurnal ground surface temperature amplitude exceeding the annual amplitude. This diurnal amplitude results in freeze–thaw cycles only near the surface. As a result, severe frost shattering occurs near the ground surface, producing a dusty, fine-material horizon called a hypercryogenic layer by Dr. Aldar Gorbunov (pers. comm., June 5, 2013) based on Pamir highland observations; (3) strong shortwave (solar) irradiance. Snow cover greatly reduces the solar energy input, because the snow’s higher albedo reflects most incident solar radiation; and (4) the importance of the latent heat of snow. The consumption of latent heat of melting and especially that of sublimation favors survival of permafrost. For the surface energy budget, low heat conduction into the ground during warm periods and high heat conduction out of the ground during cold periods favor survival of permafrost. However, in the tropics, sporadic snow cover generally does not provide a prolonged period of ground insulation, as in polar regions.
The snow cover in the study area, above 5,000 m, is sometimes characterized by the development of nieve penitentes. Penitentes are pinnacle-shaped structures formed as snow fields or glaciers sublimate at high elevations of arid regions (e.g., Andes and Himalayas; Betterton Citation2001). The formation of penitentes was first mentioned by Charles Darwin, from the Chilean Andes (Darwin Citation1839). Penitentes are formed by differential sublimation. Once the process of differential ablation begins, the surface geometry of the evolving penitentes produces a positive feedback mechanism, and radiation is trapped by multiple reflections between the walls (Corripio and Purves Citation2005). Enhanced ablation increases the amount of incoming shortwave radiation available for latent heat transfer and thus the underlying ground stays cooler (Mölg and Hardy Citation2004). In addition, the topography produced by penitentes can create a microclimate that develops convective heat circulation, pushing warmer air up during the day and causing entrapment of colder air at night.
In this short communication, we report on the active layer dynamics for the periods of snowstorm events and freeze–thaw cycles on a tropical arid high mountain in Chile. Active layer temperature monitoring at high depth resolution reveals the ground temperature patterns and the thermal state of the upper part of the permafrost layer.
Study site and methods
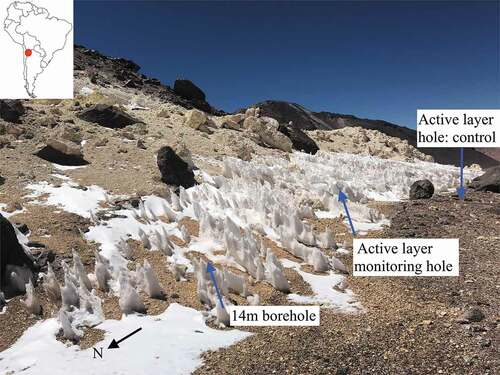
The study site (22°59′25″ S, 67°43′44″ W) is at 5,075 m a.s.l. located on the east-facing slope of the Chajnantor Volcano (5,640 m a.s.l.) at Western Cordillera, Altiplano, in northern Chile (). This area is on the eastern edge of the Atacama Desert. This arid environment is ideal for the development of snow penitentes after the winter storm events. There are two wet (snow) seasons in the high Atacama Andes. Winter snowfall tends to be higher during El Niño years, and heavy summer snowfall tends to be more common during La Niña. However, rather than the precipitation being directly controlled by the El Niño‐Southern Oscillation (Houston Citation2006), major snowstorms occur during austral winter–spring months (June–September) with northwest winds. After the storms, snow remains for several weeks and penitentes develop under subzero temperature conditions. In the austral summer months (January–March) convective storms bring precipitation from the east (called Bolivian Winter) without strong wind. Both types of storms cover the ground in the study area with snow, but after summer precipitation the snow on the ground quickly melts with runoff (Houston Citation2006).
Figure 1. Study site during penitentes formation. The 14-m borehole in the foreground and 40-cm active layer monitoring site farther behind about 5 m apart (photo taken on 10 January 2019).
Taking into account the Equilibrium Line Altitude (ELA) at Chajnantor Volcano and nearby mountains, the absence of current glaciers in this region is probably due to the altitude, which is just on the threshold delimited by the regional ELA (~6,200 m). Above 4,500 m, this area shows typical processes and periglacial landforms. There was a decrease of 300 to 400 m in the altitudinal belt of periglacial processes during the Last Glacial Maximum (Gjorup et al. Citation2019).
In the High Atacama Desert, the contemporary lower elevation boundary of permafrost is modeled to be 5,000 m on the polar-facing slopes and around 5,500 m on the equator-facing slopes (~23° S latitude; Azocar, Brenning, and Bodin Citation2017). This modeled permafrost elevation is slightly lower than the regional ELA. Higher ELA in arid regions will favor the presence of permafrost.
The surface lithology of the study drill site is lava altered by hydrothermal processes until 14 m depth, constituted by fine granulometry. It often exhibits fragments of sulfur deposits (Rámirez and Gardeweg Citation1982).
Active layer and permafrost temperature were measured with dataloggers at multiple depths over the year 2019. A deep permafrost monitoring borehole was drilled to 14 m depth, and temperature sensors were installed at 0, 0.5, 1, 2, 3, 5, 10, and 14 m. A 40-cm-deep active layer monitoring hole was drilled, and digital integrated circuit temperature sensors were installed at 1-cm intervals in the upper 40 cm of the ground and temperatures were stored in 30-minute intervals in the white hydrothermal alteration exposed site. Deep permafrost temperatures were measured with thermistors and logged hourly, primarily with Onset dataloggers (UX-120). The accuracy of the temperature observations is around ±0.15°C after calibration (±0.20°C from 0°C to 50°C at factory specification). Active layer temperatures were measured with DS18B20 digital thermometers (Dallas Semiconductor), which provides twelve-bit Celsius temperature measurements. The DS18B20 communicates over a 1-Wire bus that by definition requires only one data line (and ground) for communication with a central microprocessor that is programmable with Arduino. This study used a custom-made 40-cm probe (1-cm intervals, forty DS18B20 sensors) with one microprocessor to control many DS18B20s. The DS18B20 sensor’s factory-based accuracy information is not good enough (±0.5°C accuracy from −10°C to +85°C), but after ice bath calibration it provided better accuracy of around ±0.1°C to 0.2°C.
Thermal conductivity measurements were made with a KD2 Pro (Decagon Devices) portable laboratory and field thermal properties analyzer, whose measurement principle is based on the transient heat source method. The instrument consists of a handheld controller and sensors. Subsequently, the test tubes are stored in a freezer at a temperature of −17°C for at least eight consecutive hours. The sensor used was the KS-1 single-needle sensor (6 cm long, 1.3 mm diameter). Dielectric permittivity measurements were made for calculated soil moisture contents with a Stevens Vitel frequency domain reflectometer, which operates at a constant frequency of 50 MHz. This sensor is composed of four needles, three outer and one inside. The values obtained are the average of these properties within the measurement volume. Both thermal conductivity and soil moisture content were measured at the study site; previously the ground was drilled with a 1.2-mm-diameter drill bit for sensor probing.
Results and discussion
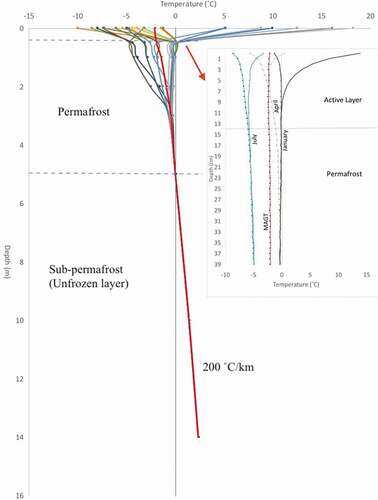
In 2019, the study site had a 14-cm active layer and seventy days of snow cover in summer and winter. Permafrost and active layer temperature profiles are plotted in . The bottom of the permafrost and the zero annual temperature amplitude depth are about 5 m below the ground surface. The 14-m-long temperature profile indicates that the geothermal gradient is quite steep (>200°C/km), higher than the normal (typically 20°C/km) value for a volcanic zone. White hydrothermal alteration rocks homogenously continue to at least 14 m depth at the study site. The salt content is considered as low in the active layer, and the freezing point was not depressed beyond −0.1°C. The ice content of the permafrost was estimated based on the water content of the thawed materials (46 percent [by volume] up to 2 m depth and 66 percent [by volume] at 2–4 m depth). All of the frozen layer (<5 m) was ice-bonded, however. The active layer was relatively dry (19 percent by weight) and unconsolidated. The range of thermal conductivity was 0.63 to 0.79 W/mK in the permafrost and 0.35 to 0.58 W/mK in the active layer, as determined by the in situ needle probing.
Figure 2. Permafrost and active layer temperature profiles every other month. Plotted are monthly borehole temperatures at 0, 0.5, 1, 2, 3, 5, 10, and 14 m depth and maximum and minimum profiles from the surface to 39 cm depth, January to December 2019. Maximum and minimum active layer temperature profiles are shown on the right side for January (black line), April (gray line), and July (blue line) 2019. Mean annual ground temperature is plotted with solid black circles with a red line. MAGT = mean annual ground temperature.
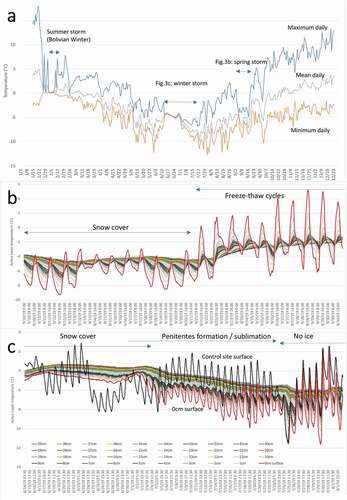
The coldest month was July and temperatures remained well below freezing (below −5°C) during the entire month. Daily mean, maximum, and minimum surface temperatures are plotted in . During major snowstorms in June 2019 (), all of the 0 to 39 cm ground temperatures (mean, maximum, and minimum) were similar (around −4°C without daily amplitude). During the spring snow event (10–21 September 2019), the maximum ground surface temperature was above 0°C, so the snow melted instead of sublimating (). However, only 2 cm of the ground was above 0°C seven days after the snow was gone. Most of the ground temperature was at −2°C to −3°C. An austral summer snow (Bolivian Winter) storm dropped the maximum temperature to near 0°C, and the minimum temperature also stayed near 0°C during this time (29 January–12 February 2019).
Figure 3. Active layer dynamics for the year 2019 and for each snowstorm event. (a) Mean, maximum, and minimum daily surface temperature profiles, January to December 2019. (b) During summer snow storm, profiles of the upper 40 cm (1-cm intervals) temperatures at 30-minute logging intervals (red solid line indicates ground surface temperature), 29 January to 13 February 2019. (c) During winter snow storm, profiles of upper 40 cm (1-cm intervals) temperatures at 30-minute logging intervals (red solid line indicated ground surface temperature), 14 June to 1 August 2019.
The mean annual ground temperature is cooler at the ground surface (−2.24°C) than at the upper part of the permafrost (−17 cm; −2.06°C; ). The active layer temperature data indicate a small negative offset. Typical thermal offset is a few degrees positive in the active layer, because of the difference of thermal states of the thermal conductivities. The thermal conductivity increases with the water content and, at a water content of 70 percent by volume, the conductivity in the frozen state (0.75 W/mK) is about 0.2 W/mK greater than the conductivity when the sample is not frozen (0.55 W/mK). This minor conductivity difference and small number of thawing degree days (TDD) could not result in any thermal offset and, instead, only about −0.1°C to −0.3°C negative shifting in the middle of active layer was observed. The reason for the negative offset is unknown; it could be due to sublimation of the penitentes or simply a response to recent climate change. This remains an open question at this stage. FDD and TDD are calculated by depth (each centimeter). FDD reached from 1005 °C・days below freezing on the surface to 787 °C・days below freezing at the bottom of the active layer (e.g., 15 cm depth). TDD were 186 °C・days above freezing. The permafrost distribution and ground surface heat balance are closely related. It is possible to determine a simple heat balance based on the FDD and TDD at the ground surface. FDD and TDD were calculated at the study site based on hourly data. The boundary conditions of permafrost presence are calculated using the following formula (Lunardini Citation1981; Romanovsky and Osterkamp Citation1995):
where λf and λt are frozen and thawed thermal conductivities; in the case of this study material, 0.75 and 0.55 W/mK, respectively. The ground surface FDD was 1005 in 2019. On the other hand, TDD was only 186.
Freeze–thaw cycles occurred 216 times at ground surface, decreasing to 9 times at 14 cm depth. The upper 3 cm of the ground surface exceeded 100 freeze–thaw cycles. The frequent freeze–thaw transitions, over more than half a year, are a frost-shattering process, and the top few centimeters can be considered a hypercryogenic layer.
Snowstorms are typical events in normal years, and in the 2019 observation period three distinct snowstorms were recorded. The austral summer snow event was warm and melted quickly. The base of the snow cover was close to the melting point and snow was ablated by solar radiation and positive daytime temperature. Then snowmelt water ran off at the surface. Austral spring (September–October) snow is a little colder and refreezes at the ground surface every night, which increases the thermal conductivity of the active layer. Austral winter snow was very different from the snow in the other seasons and lasted longer. The snow surface and ground interface stayed frozen and snow was ablated only by sublimation. and show detailed temperature time series during and after snow ablation. The black solid line in indicates dry control site surface temperature 3 m off the active layer monitoring hole. This control site had drier conditions and no snow and the soil pore space was ice-free. The control point has daily fluctuations but the temperatures at the active layer monitoring hole did not fluctuate until 2 July 2019 when most of the snow cover had disappeared. During this time of the year, the ground temperature never reaches above the melting point and thus the snow is lost by sublimation. The latent heat of sublimation is 8.5 times larger than the latent heat of melting. indicates continuously sublimated ground surface between 5 and 23 July 2019. The surface temperature (red solid line) has daily fluctuations and is 2°C to 3°C colder than the control site during daytime. During winter months, significant sublimation occurred at the ground surface, taking heat away from the ground in extreme dry conditions. The latent heat of sublimation could contribute to lowering the annual mean ground temperature as part of the surface offset, which is the temperature difference between air at standard screen height and the ground surface. However, this discussion of the negative surface offset will require multiple monitoring years and future research.
Summary
The detailed measurements reveal the thermal state at a tropical high desert permafrost site and demonstrate that the active layer behavior is significantly different from that known at higher latitudes. Several conditions have been identified that characterize this permafrost site through active layer monitoring. The study site is located at the lower altitude boundary of permafrost on the Chajnantor Volcano at 5,075 m a.s.l. with a thin permafrost layer (<5 m) and high geothermal gradient (200°C/km). The winter snow cover develops penitentes and ablates by sublimation and hence acts as a major heat sink. Winter and summer snow contribute to the surface temperature regime in different ways, because winter snow sublimates, whereas summer snow mostly melts. In this high-altitude arid environment, the active layer temperature regime is mainly controlled by sublimation processes, snow cover, and daily freeze–thaw cycles.
Highlights
The lower boundary of permafrost is found at 5,075 m a.s.l. in the Atacama Desert.
Permafrost thickness is about 5 m and contains 46 to 66 percent by volum of ice; the active layer is 14 cm.
More than 100 freeze–thaw cycles occur per year in the top 0 to 3 cm of the surface.
Winter snow at subzero temperature develops into penitentes and is lost by sublimation.
Summer snowstorms also aid permafrost survival.
Acknowledgments
The research was made possible thanks to Hisaka Iwano, Osamu Matsubara, and Drs. Koichiro Harada and Kazuyuki Saito. Our sincere thanks and gratitude to TAO/ALMA field staff members and the UNESCO Snow and Ice Working Group, Intergovernmental Hydrological Program, for help with laboratory analyses and field support. We also thank Dr. Seiji Sakamoto and two anonymous reviewers who provided insightful comments and suggestions that improved this article.
Disclosure statement
No potential conflict of interest was reported by the authors.
Additional information
Funding
References
- Andrés, N., D. Palacios, J. J. Zamorano, and L. Vázquez‐Selem. 2011. Shallow ground temperatures and periglacial processes on Iztaccíhuatl Volcano, Mexico. Permafrost and Periglacial Processes 22 (2):188–94. doi:https://doi.org/10.1002/ppp.713.
- Azocar, G. F., A. Brenning, and X. Bodin. 2017. Permafrost distribution modelling in the semi-arid Chilean Andes. The Cryosphere 11 (2):877–90. doi:https://doi.org/10.5194/tc-11-877-2017.
- Betterton, M. D. 2001. Theory of structure formation in snowfields motivated by penitentes, suncups, and dirt cones. Physical Review E63:056129, 12 pp.
- Corripio, J. G., and R. S. Purves. 2005. Surface energy balance of high-altitude glaciers in the central Andes: The effect of snow penitentes. In Climate and Hydrology in Mountain Areas, 15–27.
- Darwin, C. 1839. Journal of researches into the geology and natural history of the various countries visited by H. M. S. Beagle, under the command of Captain Fitz Roy, R.N., 1832 to 1836. London: H. Colburn.
- Gjorup, D. F., M. R. Francelino, R. F. M. Michel, E. O. Senra, and C. E. G. R. Schaefer. 2019. Pedoclimate monitoring in the periglacial high mountain soils of the Atacama Desert, northern Chile. Permafrost and Periglacial Processes 30 (4):310–29. doi:https://doi.org/10.1002/ppp.2029.
- Houston, J. 2006. Variability of precipitation in the Atacama Desert: Its causes and hydrological impact. International Journal of Climatology 26 (15):2181–98. doi:https://doi.org/10.1002/joc.1359.
- Lunardini, E. J. 1981. Heat Transfer in Cold Climates. New York: Van Nostrand Reinhold.
- Mölg, T., and D. R. Hardy. 2004. Ablation and associated energy balance of a horizontal glacier surface on Kilimanjaro. Journal of Geophysical Research 109 (D16):D16104. doi:https://doi.org/10.1029/2003JD004338.
- Nagy, B., Á. Ignéczi, J. Kovács, and M. László. 2018. Shallow ground temperature measurements on the highest volcano on Earth, Mt. Ojos del Salado, Arid Andes, Chile. Permafrost and Periglacial Processes 30 (1):3–18. doi:https://doi.org/10.1002/ppp.1989.
- Rámirez, C. F., and M. Gardeweg. 1982. Hoja Toconao, Region de Antofagasta. Santiago: Servicio Nacional de Geologia y Mineria, Carta Geologica de Chile, No. 54, 122 p., escala 1:250 000.
- Romanovsky, V. E., and T. E. Osterkamp. 1995. Interannual variations of the thermal regime of the active layer and near surface permafrost in Northern Alaska. Permafrost and Periglacial Processes 6 (4):313–35. doi:https://doi.org/10.1002/ppp.3430060404.
- Schorghofer, N., M. Leopold, and K. Yoshikawa. 2017. State of high-altitude permafrost on tropical Maunakea volcano, Hawaii. Permafrost and Periglacial Processes 28 (4):685–97. doi:https://doi.org/10.1002/ppp.1954.
- Vizoto, V. 2018. Estado del arte de la investigación periglaciar en México, 97. Investigaciones Geográficas. doi:https://doi.org/10.14350/rig.59811.
- Woodcock, A. H. 1974. Permafrost and climatology of a Hawaii volcano crater. Arctic and Alpine Research 6 (1):49–62. doi:https://doi.org/10.2307/1550369.
- Yoshikawa, K. 2013. Permafrost in Our Time, 300. Valencia,CA: University of Alaska Fairbanks.
- Yoshikawa, K., J. Ubeda, P. Masias, W. Pari, F. Apaza, P. Vasquez, B. Ccallata, et al. 2020. Current thermal state of permafrost in the southern Peruvian Andes and potential impact from El Niño–Southern Oscillation (ENSO). Permafrost and Periglacial Processes 31 (4):598–609. doi:https://doi.org/10.1002/ppp.2064.