
ABSTRACT
Tropical mountain permafrost has a unique thermal regime due to ground surface exposure to strong solar radiation. The intensity of the surface offset resulting from snow cover also strongly affects the absence or presence of permafrost. Latent heat transfer and reflected solar radiation (higher albedo) that occur during the snow-covered season contribute to a positive feedback that cools the ground. Eleven ground temperature monitoring sites were established on the mountain at 2,780 to 5,820 m.a.s.l. The geothermal heat flow is locally high in the caldera of this volcano, as shown by borehole temperature data. Permafrost is located near the only glacier entirely within the caldera (Furtwängler). These three-year continuous records of ground temperature data encompass years of high and low snow cover. Our results show that the current lower boundary of permafrost is slightly above summit altitude and relict permafrost is present due to the influence of saturated sand on latent heat transfer. Permafrost tends to be lost more rapidly during drought years. The remaining permafrost seems likely to disappear in the future. The presence of permafrost and its thermal resistance depends on the ice content of caldera sand and the duration of snow cover.
Introduction
Tropical high mountain permafrost has been reported in Hawaii on Mauna Kea (Woodcock Citation1974; Yoshikawa Citation2013; Schorghofer, Leopold, and Yoshikawa Citation2017), Iztaccíhuatl (Andres et al. Citation2011; Yoshikawa Citation2017) and Pico de Orizaba (Vizoto Citation2018) in Mexico, southern Peruvian Andes (Yoshikawa et al. Citation2020), and northern Chile (Mena et al. Citation2021). In addition to Kilimanjaro, other high mountains in Africa include Mt. Kenya (5,199 m.a.s.l.), Mt. Meru (4,562 m.a.s.l.), and the glacierized Rwenzori mountains (5,109 m.a.s.l.); permafrost is reportedly absent on these mountains due to their elevation (Yoshikawa Citation2013). However, recent work indicates that permafrost may also be present near the top of the Atlas Mountains, Morocco (Vieira, Mora, and Faleh Citation2017), and that it formerly existed in the Ethiopian Highlands (Groos et al. Citation2020).
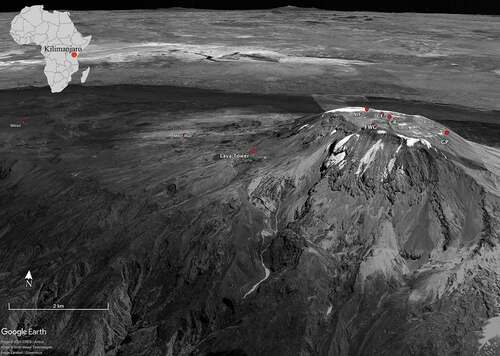
Typically, the contemporary lower elevation limit of alpine permafrost (LLAP) on tropical mountains is reported to be 5,200 m.a.s.l. on the polar-facing slopes and around 6,000 m.a.s.l. on the equatorial-facing slopes, between latitudes 15° and 23° in both hemispheres (Yoshikawa Citation2013; Yoshikawa et al. Citation2020). Kilimanjaro is located almost on the equator (3° S) and elevation is the critical factor for the presence of the permafrost (). Among tropical mountains, Mauna Kea is somewhat exceptional, in that a pocket of isolated ice-rich frozen soils was reported (ca. 4,130 m.a.s.l.; Woodcock Citation1974). Permafrost at Mauna Kea is located on the lower north-facing slope of the summit crater but not on the crater floor. The location of this permafrost indicates the importance of reduced solar radiation and longer periods of snow cover for permafrost survival. Although mean ground surface temperature is +2.2°C, the permafrost thickness is 10.5 m (Woodcock Citation1974). This location is considered either a result of unique microclimate-induced cooling and ice-rich bonded permafrost that better resists thawing or is a relict persisting since the last cooler period (Yoshikawa Citation2013; Schorghofer, Leopold, and Yoshikawa Citation2017).
Figure 1. Oblique view of Kilimanjaro and the study sites (Google Earth). Site abbreviations correspond with site names in .
In order to understand the thermal state of tropical mountain permafrost, we consider four conditions, each quite different from those affecting permafrost in polar regions:
A minimal seasonal temperature variation, resulting in a low surface-to-depth temperature offset and minimal active layer. Maximum thermal offsets typically occur in subarctic peatlands, where permafrost can remain stable despite positive mean annual surface temperatures. This offset is caused by the bigger difference between frozen and thawed thermal conductivities; summertime (thawed state) thermal conductivity is very low in peatland, which protects permafrost from higher air temperatures. However, during winter months, a higher thermal conductivity increases heat loss from the ground, stabilizing permafrost. In contrast to polar-region seasonality, minimum seasonal temperature fluctuations in tropical mountains result in no active-layer thermal offset.
Diurnal ground surface temperature amplitude that exceeds the annual amplitude, sometimes dramatically so (e.g., 40°C+ on Kilimanjaro). This diurnal amplitude results in freeze–thaw cycles only near the surface, on the order of 10 cm. As a result, severe frost shattering occurs near the ground surface.
Strong shortwave (solar) irradiance. For the surface energy budget, minimal heat conduction to the ground would be ideal for survival of permafrost, due, for example, to a high albedo surface reflecting shortwave energy or consumption of latent heat by a wet ground surface.
The importance of the snow-covered season, due to both higher albedo and wet surfaces. Snow cover provides great protection for surface energy penetration, with snow’s higher albedo reflecting most incident solar radiation. However, snow cover generally does not provide a prolonged period of ground insulation, as in polar regions.
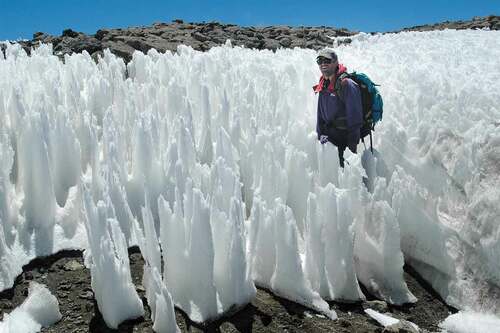
Snow cover on the summit area of Kilimanjaro is sometimes characterized by the development of nieve penitentes (). Penitentes are pinnacle-shaped structures formed as snow fields or glaciers sublimate at high elevations (e.g., Andes and Himalaya; Betterton Citation2001). The formation of penitentes was first mentioned by Charles Darwin, for the Central Andes near Santiago de Chile (Darwin Citation1839). Penitentes are formed by differential ablation, with the dew point always below freezing (Lliboutry Citation1954); in this condition, snow sublimates rather than melts. Once the process of differential ablation begins, the surface geometry of the evolving penitentes produce a positive feedback mechanism and radiation is trapped by multiple reflections between the walls (Corripio and Purves Citation2005). The general orientation of penitentes is pointing upward, toward maximum solar radiation. Enhanced ablation increases the amount of incoming shortwave radiation available for latent heat transfer to the penitentes, and thus the underlying ground stays cooler (Mölg and Hardy Citation2004). Also, the surface roughness induced by penitentes can create a microclimate that develops convective heat circulation, pushing warmer air up during the day and causing entrapment of colder air at night.
Figure 2. Nieve (snow) penitentes developed within Kibo caldera, near NIF monitoring site (5 October 2007).
In this article we focus our analysis on periods of snow cover, geothermal flow, freeze–thaw cycles, and ground temperature patterns to understand the thermal state of the ground near summit area of Kilimanjaro volcano.
Study area
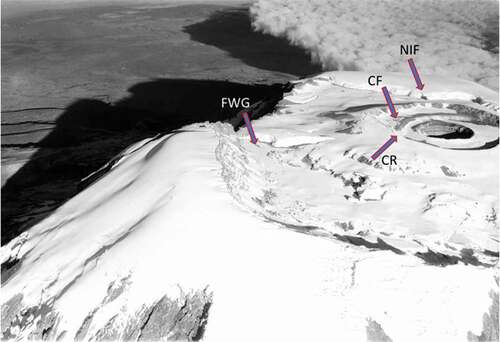
Kilimanjaro is a dormant volcano and the highest mountain in Africa (5,895 m.a.s.l.), located in the eastern portion of the East African Rift system. This huge stratovolcano (ca. 60 × 40 km) consists of three single cones (Shira, Kibo, and Mawenzi) and a major crater exceeding 5,790 m altitude, with fumaroles. The summit region of Kibo has collapsed to form a large caldera measuring 1.9 km × 2.4 km ( and 3). Glaciers are present on the caldera rim and on the outer slopes, with only the Furtwängler Glacier entirely within the caldera (Hardy Citation2011). Also within the caldera is the Inner or Reusch Crater, ca. 800 m in diameter and encompassing a central crater (ash pit).
Glaciers in tropical regions have retreated drastically since the mid- to late nineteeth century (Kaser and Osmaston Citation2002), and glaciers on Kilimanjaro follow this trend (Hastenrath and Greischar Citation1997; Cullen et al. Citation2006, Citation2013). To illustrate this, the areal extent of ice cover decreased between 74 percent (Cullen et al. Citation2013) and 80 percent (Thompson et al. Citation2002) from 1912 to 2000. More recently, the total ice area decrease has continued, amounting to 40 percent from 2000 to 2011 (Cullen et al. Citation2013). To facilitate the analysis of physical processes controlling glacier extent on the mountain, four separate glacier regimes were recognized by Kaser et al. (Citation2004) and discussed in detail by Hardy (Citation2011). As illustrated in , these are (1) horizontal surfaces, on which traditional mass balance determinations reveal a relatively slow rate of thinning; (2) slope glaciers, primarily on the southern flanks; (3) near-vertical margins, a special characteristic of Kilimanjaro’s summit glaciers and whose retreat (Winkler et al. Citation2010) is driving the areal recession revealed by mapping; and (4) basal surfaces—as with permafrost, subject to the influence of geothermal heat flow. Several early studies speculated that volcanic heat might be influencing Kilimanjaro’s glaciers (e.g., Jäger Citation1909).
Figure 3. Location map of borehole monitoring sites within the summit caldera in January 1938 aerial photograph. Site abbreviations correspond with site names in . The NIF and FWG are readily distinguished from adjacent snow cover, due to the near-vertical ice margins. (University of Wisconsin–Milwaukee Library Li000958).
Geothermal activity on Kilimanjaro volcano was first noted in a hut logbook report of sulfur fume venting by W.H. Tilman in 1933. Confirmation of this finding did not occur until July 1942 (Spink Citation1945) and was followed by reports of steadily increasing fumarole activity. Numerous venting fumaroles were found by Spink on the Reusch Crater flanks, with gas temperatures averaging over 75°C, as well as some cold, “apparently dead” eruptive areas. Indirect evidence of geothermal activity on Kilimanjaro prior to Tilman’s observation was presented by Downie and Wilkinson (Citation1972), who concluded that the reported activity was not new and possibly had continued since Kilimanjaro’s last eruptive phase. Downie and Wilkinson (Citation1972) examined the fumarole literature up to 1972 and concluded that there “is little doubt that intermittency occurs over periods of months, and maybe, years” (p. 181).
In recent decades, inactive, apparently relict fumarole sites have been observed at the margins of glaciers within the caldera rim (e.g., of Kaser et al. Citation2004). As ice cliffs retreat over the former vents, inverted domes become exposed, which we hypothesize to have formed at a time when steam and heat emanated from the vent. A manuscript with descriptions and photographs of six such sites is in preparation (Hardy et al. in preparation). Together with active fumaroles within Reusch Crater, these sites demonstrate that geothermal heat flow is an important consideration for both glacier mass balance and the existence of permafrost on the mountain.
Permafrost was previously reported on Kilimanjaro, at 4,700 m below where Arrow Glacier used to be ( of Kaser et al. Citation2004), based on observation of ground ice found along the moraine slope. This ice was later confirmed to be debris-covered glacier ice to melt slowly, not permafrost. We have also observed buried glacier ice of similar appearance below the Great Penck Glacier terminus at 4,800 m.a.s.l., in multiple locations beneath Little Barranco Glacier at ~4,900 m.a.s.l. (), and as low as 4,560 m.a.s.l. below Great Barranco Glacier.
Figure 4. Buried relict ice of Little Barranco Glacier at ~4,900 m southeast of Arrow Glacier camp, typical of that found elsewhere on the western slopes of Kilimanjaro.

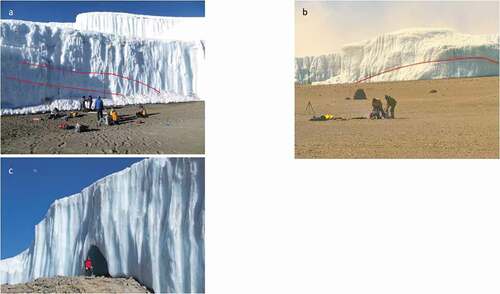
The Furtwängler Glacier (FWG) is noteworthy as the only ice body entirely within Kibo caldera. Thompson et al. (Citation2002) speculated that the FWG is an ephemeral feature, appearing to have formed only within the past few centuries. During ice core drilling in 2000, FWG ice was water saturated throughout; both areal recession and thinning have been rapid since then, with an area loss of 86 percent in the two decades since (Hardy, unpublished). Despite this marked recent decrease, area loss between 1975 and 2000 (twenty-five years) was less than 50 percent. The extent to which geothermal heat has accelerated ice loss at FWG is unknown. An unusual ponded water flood event occurred in January 2003, when meltwater drained abruptly from a depressed portion of the glacier (Hardy Citation2004). No evidence suggesting anomalous geothermal heat was found at the time; however, a basal, inverted dome and fumarole site emerged from a nearby margin in 2012 (); geothermal heat remains a hypothesis for both the initial depression and the meltwater production.
Figure 5. Indirect evidence for basal ice melting, due to spatially variable geothermal heat: (a) deformation of stratigraphy at the NIF borehole site, 29 September 2012; (b) deformation of Furtwängler Glacier stratigraphy near the FWG site, 3 September 2009; and (c) basal dome formed above vent at FWG, 25 September 2012. Red lines indicate expected stratigraphy in the absence of basal melting, roughly parallel to the caldera surface.
Kilimanjaro’s climate system differs from that of other tropical mountains with permafrost. Hawaii, Mexico, and the western Altiplano all experience one wet season annually. On Kilimanjaro, as elsewhere in East Africa, an equatorial precipitation regime prevails, with boreal spring peaks typically in March to May and autumn precipitation concentrated in October to November (Nicholson Citation2017). In the past, this seasonal cycle has been ascribed to the north–south oscillation of the Intertropical Convergence Zone, as in other equatorial regions such as the western Cordillera of Mexico. Recent research discussed by Nicholson (Citation2017) suggests that this explanation is not tenable, and seasonal precipitation fluctuations are instead related to atmospheric changes associated with Indian Ocean sea surface temperature changes (e.g., Yang et al. Citation2015). Overall, numerous interacting factors control the interannual variability of regional precipitation, and the degree to which different factors dominate changes on a decadal timescale (Nicholson Citation2017).
Materials and methods
Ground temperature monitoring on Kilimanjaro was done with dataloggers at multiple depths and numerous locations, over an elevation range of 3,000 m.a.s.l. and from 2009 to 2016 (). Within the summit caldera, boreholes were drilled to a depth of 3 m near Furtwängler Glacier and to 1 m at three locations: near the Northern Icefield (NIF), the Reusch Crater rim, and the Reusch Crater floor. Sensors and dataloggers were also installed at different elevations on the western flank of the mountain, at 0.02 and 1 m below the surface (). The sensors at 0.02-m depth, just below the surface, provided a proxy for surface temperature.
Table 1. Borehole locations and details. All measurements made by thermistor and recorded at 60-minute intervals with Onset dataloggers, except at Northern Icefield (Data Garrison). Site abbreviations correspond with labels in and 3. Dark shading indicates sites with measurements at one-meter depth
Borehole sites within Reusch Crater were comprised of lava altered to whitish, fine granules by hydrothermal processes. The extent to which glaciers covered this inner portion of the caldera is not known with certainty, yet Reusch Crater has been ice free for at least a century.
The FWG and NIF monitoring boreholes were located just outside the glacier perimeters ( and 5). At the NIF, glacier ice was likely present at the site for many centuries, until only a few years prior to installation of sensors (cf. Thompson et al. Citation2002); the borehole drilled in 2012 was 7 m from the glacier wall at the time. After drilling, water partially filled the hole, slowly. The FWG borehole site was approximately 100 m from the rapidly retreating current ice margin (), and historical photographs (e.g., 1938; ) indicate that the site was likely unglacierized for centuries, possibly even during the maximum Holocene ice extent. The surface lithology at FWG and NIF sites was grayish, sandy terrain over the lava layers. At the time of drilling, the sand was frozen below 2.5-m depth in the FWG hole but not at the NIF.
Ground temperatures were measured with thermistors and logged hourly, primarily with Onset dataloggers (). Thermistors are the most commonly used sensors for borehole measurements today, and the general installation procedure follows Global Terrestrial Network on Permafrost guidelines (Biskaborn et al. Citation2019). The accuracy of the temperature observations is around ±0.1°C (). Temperatures were measured hourly so a comparison of mean annual ground temperature (1-m depth) could be used to accurately determine the lapse rate at each elevation and permit estimation of the permafrost lower elevation boundary. Air temperature data from Duane et al. (Citation2008) were used for comparison with the lapse rate of ground data.
Additional temperature, snowfall, and other meteorological measurements used here are from automated weather stations operating through the study period on Kilimanjaro’s summit glaciers, including the Northern Icefield (Hardy Citation2011) and Kersten Glacier, south of Uhuru Peak (e.g., Mölg et al. Citation2009). These provide a context for our ground measurements, especially in terms of snow cover, and are discussed further in the Discussion section.
Freeze–thaw frequency was examined at each site based on an “effective freeze–thaw cycle” defined as a ground surface temperature of −2°C followed by a rise to above +2°C (Matsuoka Citation1990). This metric was chosen over “normal” freeze–thaw frequency based on fluctuations about 0°C, although both are more meaningful than daily temperature amplitude for processes of frost shattering and frost heaving (forming stripes), due to the 9 percent volume change associated with the water–ice phase change.
We also investigated the spatial variability of geothermal heat flow directly. A quantitative measure of geothermal activity distribution patterns was based on a thermal imaging camera (NEC Avio G100EX with measurement range of −40°C to 500°C and accuracy of ±2°C; 320 × 240 pixels with sensitivity of 8–14 μm and 14-bit data depth). Images were obtained at night, minimizing thermal emission due to heating by shortwave radiation during the day. Borehole temperatures in the four caldera sites also reveal how geothermal heat flow varied spatially.
Results
Ground and air temperature lapse rate
Ground and air temperature measurements spanning 3,000 m of elevation allowed a comparison of lapse rates. Ground temperature was measured at 1-m depth at sites with flat terrain, on the mountain’s west-facing slope (); this depth dampened diurnal temperature fluctuations, permitting better assessment of subsurface ground thermal conditions. We used air temperatures at screen level along a western slope profile from Duane et al. (Citation2008). Mean annual ground and air temperatures are shown in , along with linear lapse rates.
Figure 6. Mean air and ground temperatures at sites on Kilimanjaro south slope. Air temperature is at screen level (~1.5 m) for September 2004 to January 2006 (Duane et al. Citation2008, table 2). Ground temperatures (1-m depth) are from sites shown in , October 2009 to September 2012.
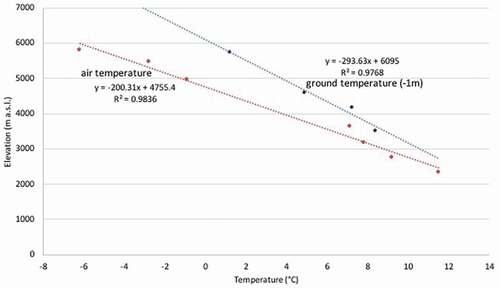
Air temperature and ground surface temperature regimes both generally show a linearly decreasing relationship with elevation (), with air temperature decreasing more rapidly due to the lower air density and stronger shortwave radiation. Typically, mean annual air temperature is 2°C to 4°C lower than ground temperature at a similar elevation. Measurements began at 3,500 m.a.s.l., and air temperature curves suggest that the local inversion (cloud) layer height is around 3,200 m.a.s.l. (Duane et al. Citation2008). A simple linear trend was used to predict the location of the permafrost lower boundary. The elevation where the ground temperature line crosses 0°C is about 6,100 m.a.s.l., broadly suggesting an absence of permafrost across the summit area. However, the air temperature line crossing 0°C is at 4,755 m.a.s.l. and suggests that permafrost would appear if microclimate conditions were suitable, including topographic shading, a boulder field, or a site with minimum surface offset (). We found evidence of permafrost on Kilimanjaro only at the FWG site, based on our observation of frozen sand at depth during borehole drilling. There, snow-covered periods and wet conditions persist longer than at other locations within the caldera basin. At other locations within the summit area above 5,700 m.a.s.l. (e.g., NIF site, Reusch Crater wall and floor), we did not find evidence of frozen ground.
All known tropical mountain permafrost in the world is present on dormant or active volcanoes. Some of these, such as Coropuna in the Peruvian Andes, are predominantly active; they discharge hot springs among the mountains, which implies possibly higher-than-normal geothermal heat. The active volcanoes, with higher geothermal heat flow conditions, often reach higher ground temperatures. On Kilimanjaro, the two Reusch Crater borehole sites revealed high ground temperature at 1-m depth, so these higher ground temperatures in the summit crater area (mean annual temperatures exceeding 10°C) were not used in the lapse rate estimation.
Borehole temperature profile
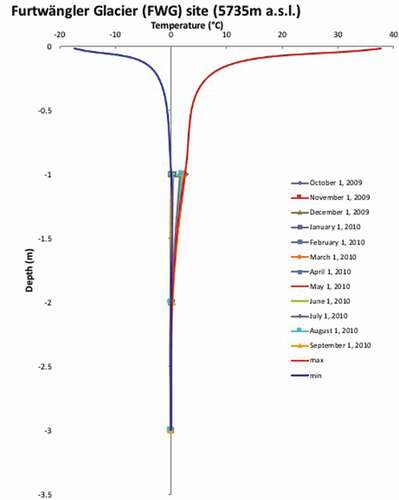
The annual cycle of borehole temperature profiles was established for all sites to a depth of 1 m and to 3 m at FWG. The typical “trumpet curve” constraining the minimum and maximum profiles is illustrated in , where values above 1 m are constrained by 0.02 m temperatures and smoothed on the basis on thermal conductivity. The characteristics of the tropical ground temperature profile are unique and unlike those found in polar regions. In tropical areas, diurnal ground surface temperature amplitude exceeds the annual amplitude. Among all borehole sites at 1-m depth, the annual temperature amplitude ranges from minimal at FWG (2°C–3°C) to 5°C to 7°C at the NIF site. In contrast, the diurnal ground surface temperature amplitude can exceed 40°C during the period of the year without snow cover. However, this diurnal temperature fluctuation typically penetrates the ground surface only to a depth of 5 to 30 cm (Gorbunov Citation1978), where this upper layer undergoes frequent freeze–thaw cycles. As a result, the ground surface is typically marked with a pattern of stripes and needle ice formation, indicating heavy freeze–thaw activity.
Figure 7. Borehole temperatures of the FWG at depths of 1, 2, and 3 m and maximum and minimum ground temperature profiles (e.g., trumpet curves), constrained by 0.02-m depth temperatures and smoothed to 1-m depth based on thermal conductivity, October 2009 to September 2010.
Despite similar elevations, there are two important differences between the FWG and NIF borehole sites: (1) FWG site has not been glacierized for at least centuries, whereas the NIF site was ice covered until a few years ago, and (2) the sand layer at FWG is thicker and ice-bonded, in contrast to the thin sand over the impermeable (lava) layer at NIF.
At the FWG borehole site, permafrost temperature at 2- to 3-m depth is 0°C, indicating that this permafrost is at the thawing point. Surface cooling during snow-covered periods is never sufficient (after consuming latent heat) to lower temperatures below freezing at any depth (). All ground heat energy lost and gained is consumed by latent heat, due to moisture in the pore spaces. Less seasonality and no active layer thermal offset were observed at FWG, as shown in and 8. The constancy of temperature at 3-m depth indicates that the permafrost layer is possibly relic. Once the 2011 short rains got underway, data show 10.5 months of snow cover, providing an ideal ground-cooling situation; however, ground temperature below the surface remained only slightly below freezing ().
Figure 8. Snow height and ground temperature patterns at the FWG monitoring site, October 2009 to September 2012. Top plot (a) shows changes in surface height on upper (black line) and lower (red) Kersten Glacier (half-hourly), along with daily Northern Icefield heights as the thin red line with short-rain (green) and long-rain (blue) seasons each year (all in meters, arbitrary datum). Shown on this line as cyan/blue circles are eight times for which photographs of caldera snow cover are available. Middle panel (b) is FWG site ground temperatures at depths of 1, 2, and 3 m (pink, orange, and red; all in degrees Celsius). Bottom panel (c) is four-hourly FWG surface temperature (°C). Vertical lines (cyan) align the timing of selected snowfall events (see text).

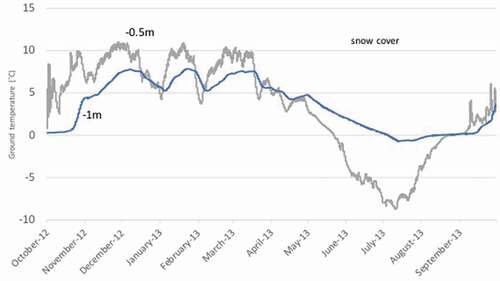
The ground temperature regime at the NIF site is shown in for 0.5- and 1-m depth at NIF site, about 7 m away from the glacier’s vertical wall. Beneath the glacier, at the ice core site in 2000, the basal temperature was −0.4°C (Thompson et al. Citation2002). Based on this measurement, the mean annual ground surface temperature at our recently exposed NIF site increased by +4.2°C since 2000 (not shown), an unlikely increase if ice-rich permafrost was present. The sandy sediment layer largely remained dry except during one month of subfreezing temperature at 1-m depth; we believe that freezing of wet sand was associated with released latent heat. Surface heat penetrated well to 1-m depth and no permafrost is expected in this borehole.
Figure 9. Temperature patterns recorded at a ground depths of 0.5 and 1 m at the NIF monitoring site, September 2012 to September 2013.
Geothermal heat flow
As mentioned earlier, Kilimanjaro is a dormant volcano and the major Reusch Crater has a history of higher geothermal activity, including some fumaroles. Images of surface geothermal activity within the crater were captured at night with a thermal camera (). Large areas of the rim walls both inside the ash pit and the outer Reusch Crater rim are considerably warmer (>40°C). These correspond to hardened lava or exposed sulfur deposits. shows one of the hot spots at the Reusch Crater rim where we drilled 1 m to monitor the ground temperature. Between 2010 and 2012, ground temperature at 1 m primarily fluctuated between 18°C and 20°C (), much warmer than the mean annual ground surface temperature of +0.9°C at the same site (; ca. 18°C/m geothermal gradient). The second-highest ground temperature over the same time period was observed at Reusch Crater floor, at 10°C to 15°C. The cause of ground temperature fluctuation at this site () is most likely a result of seasonal air temperature and snow cover variation (i.e., climate) and perhaps variability in volcanic activity.
Figure 10. Nighttime thermal images within Reusch Crater, 28 September 2012 at 22:00, showing (a) ash pit and Reusch Crater wall behind and (b) Reusch Crater outer rim. Also shown is daytime view of Reusch Crater and inner ash pit, looking approximately to the northeast direction.
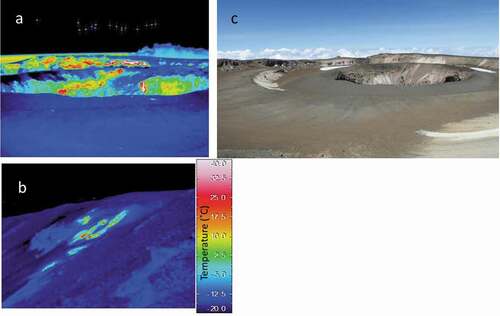
Figure 11. Hourly mean ground temperatures at 1-m depth for five sites, September 2010 to August 2012.
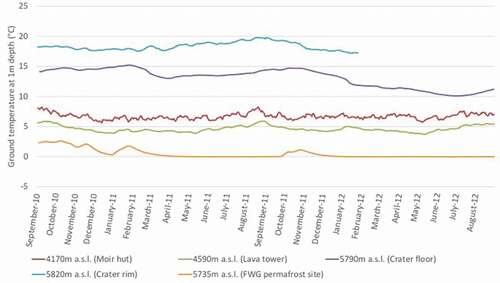
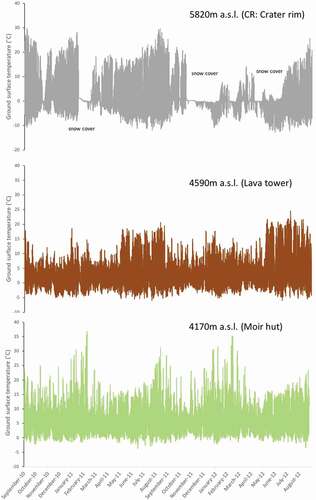
Figure 12. Hourly mean ground surface temperature through the study interval at three different elevations, September 2010 to September 2012. Temperature at all sites reached subfreezing and strongly fluctuated when the sites were snow-free. Crater rim site at 5,820 m.a.s.l. (gray: left y-axis) had frequent snow cover, especially between October 2011 and June 2012. Moir hut (4,170 m.a.s.l.; green: right y-axis) sometimes not freezing overnight but Lava Tower site at 4,590 m.a.s.l. (brown: right y-axis) had severe freeze–thaw cycles almost daily. Note that the illustrated time interval began one year later than that of other plots.
Geothermal heat flow evidence within the caldera can also be indirectly observed and monitored, by patterns of glacier retreat, cavity formation beneath the glaciers (e.g., ; Kaser et al. Citation2004, ), and larger-scale impacts ( and 5c). The effects of spatial variability in geothermal heat are revealed on the glacier’s vertical walls. Ice proximal to both summit drill sites (FWG and NIF) shows foliation deformation that appears associated with geothermal heat flux unevenly melting basal ice ( and 5c) over an unknown time interval.
Freeze–thaw cycles and periglacial geomorphology
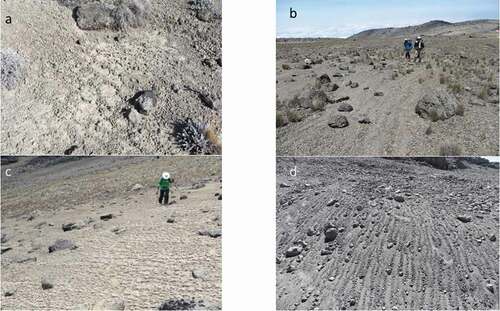
Strong solar radiation heats ground surfaces during the day on Kilimanjaro, raising surface temperatures above 0°C almost every day at the summit area (). However, at 50-cm depth ground temperature has very small diurnal fluctuations. shows a comparison of “normal” and “effective” ground surface freeze–thaw frequency at each elevation. At the lowest site Moir hut (4,170 m.a.s.l.), freeze–thaw cycles were very limited. During the study period at Moir hut, ground temperature dropped below 0°C 138 times per year on average, but only six effective freeze–thaw cycles occurred. In contrast, the number of effective freeze–thaw cycles at the summit crater rim was 268 times per year. Snow cover was present during the other ninety-seven days of the year at this site, preventing surface temperature from crossing the melting point (i.e., above 0°C). The most frequent freeze–thaw cycles were recorded at the 4,590 m.a.s.l. Lava Tower site (338 times per year), due to less snow cover than in the summit area. However, comparing effective frequency, higher temperatures at 4,590 m.a.s.l. may render frost weathering processes less active. indicates that freeze–thaw cycles start to be more active ca. 4,000 m.a.s.l. today, with the summit being more severe, if free of snow cover. The typical snowline elevation (ca. 4,500 m.a.s.l.) has ideal conditions for the most frequent freeze–thaw cycles, although higher temperatures limit the number of effective cycles. illustrates the diversity of patterned ground observed on Kilimanjaro: miniature sorted nets at Moir hut 4,170 m.a.s.l. (a), poorly sorted stripes at 4,590 m.a.s.l. near Lava Tower (b), due to melting needle ice in the afternoon near Arrow Glacier (c), and beautiful, well-sorted stripes seen in the summit crater area near FWG borehole site (d).
Table 2. The frequency of the “normal” and “effective” freeze–thaw cycles at each site
Figure 13. Examples of freeze–thaw impacts, including (a) patterned ground at 4,170 m.a.s.l., (b) stone stripes at 4,590 m.a.s.l., (c) surface pattern due to needle ice at 4,700 m.a.s.l., and (d) stone stripes at 5,735 m.a.s.l.
Discussion
Caldera climate and snow cover
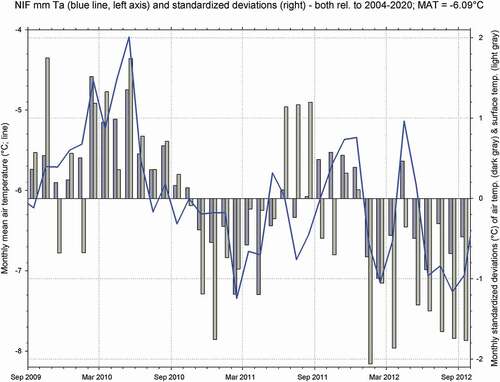
Our three-year study period encompassed extremes of both air temperature and glacier mass balance, relative to our twenty-year record (2000–2020) at the NIF Automated Weather Station (AWS). Monthly air temperature anomalies reached +1°C or more in February through May of the 2010 El Niño event (); May had the highest mean and mean minimum temperatures for any month on record. Not surprising, seasonal ablation on the NIF through the generalized June to October 2010 dry season was 144 percent of any other dry season in our record (Hardy, unpublished data), confirmed by October observations of no seasonal snow within the caldera. In contrast, early 2011 was anomalously cold during February, March, and April, with very little precipitation (i.e., March–May). Finally, the first nine months of 2012 were colder than average, including the lowest mean minima in August (all months, 2004–2020) and the highest negative deviation in average glacier surface temperature (−1.5°C; ). Above-average snowfall was measured during the 2012 long wet season ().
Figure 14. Monthly mean air temperatures (°C) on the Northern Icefield through the study period (line, left-hand y-axis) and standardized deviations of air (dark bars) and glacier surface temperatures (light bars) for each month in degrees Celsius (right-hand y-axis for both; 2004–2020 reference period).
Mean monthly air temperature at NIF AWS for the period exhibited a typical seasonality on average, ranging between −6.7°C (July) and −5.3°C (May). The seasonal cycle of mean monthly ground surface temperature at FWG was more pronounced, ranging from just below freezing from December through July (−1.6°C to 0.2 °C, mean = −0.5°C) to means of 2°C to 4°C in August through November. These months of high ground surface temperature coincide with the months of least snow cover, on average. The overall surface offset value over three years of measurement was +6.75°C, with the annual mean ground surface temperature at FWG site ranging widely, between −1.1°C (2011–2012) and 2.2°C (2009–2010).
The differences between the three years of measurements (cf. ) is further illustrated by the differing average maximum daily ground surface temperatures, ranging between 0.8°C in 2011–2012 and 13.9°C in the year encompassing the 2010 El Niño. For the three years, the 5th and 95th percentiles of daily maximum ground surface temperature were 0.03°C and 39.39°C, respectively.
Seasonal snow cover acts to thermally insulate the ground surface from the atmosphere above, due to snow’s high albedo (energy reflection), high emissivity (energy emission), low thermal conductivity (insulation), and role in latent heat transfer (snowmelt and sublimation as heat sinks). The difference between air temperature (2 m) and ground surface temperature (e.g., 2-cm depth) is termed the surface offset; positive surface offset values indicate higher temperature at the ground surface, relative to the air.
The climate on tropical high mountains differs fundamentally from that at high latitudes, such as the Arctic, with diurnal air temperature fluctuations typically exceeding those of the annual cycle and snow cover duration varying widely, sometimes from day to day and sometimes seasonally. Therefore, snow cover on mountains such as Kilimanjaro profoundly impacts surface offset and the existence of permafrost. In higher latitudes, the insulation impact of snow is important for degrading permafrost and establishing a stronger surface offset. Higher latitude snow contains a lot of pore space and often develops depth hoar due to the strong thermal gradient. This low-density snow layer acts to lower thermal conductivity and keeps the ground warmer during winter months. However, on tropical mountains, snow quickly becomes denser due to intense solar radiation and diurnal temperature fluctuations, causing refreezing and often formation of penitentes. This snow-to-ice transformation process increases thermal conductivity, which positively feeds back to stable/aggradating permafrost and minimum surface offsets (Calonne et al. Citation2011). This tropical mountain snow structure results in different thermal characteristics from polar-region snow, with much less impact on insulation of the ground.
Perhaps the best illustration of how snow cover influences ground surface temperature—even with Kilimanjaro’s variable snow cover—is the seasonality of monthly ground surface temperature range. Whereas the range between monthly mean maximums and minimums at FWG averaged nearly 24°C during the dry month of September, the typically snowy months of March and April both averaged less than 1°C, demonstrating that snow cover clearly dampens fluctuations in ground surface temperature.
The relationship between snowfall and ground temperature at the surface and at depths of 1, 2, and 3 m is shown in . Snowfall is deduced from records of surface height change at three different automated weather stations, located near the caldera rim 0.7 to 1.6 km on either side of the FWG borehole. Photographs depicting snow cover are available from eight different dates, as indicated on (top). Examples of subjectively chosen changes in snow cover that influenced ground temperature are delineated in with vertical bars for alignment. In almost all snowfall cases, the daily maximum ground surface temperature decreases abruptly and the daily minimum increases; both converge toward the freezing point, despite the distance between snowfall and temperature measurement sites. Subsequently, temperature at 1-m depth gradually decreases.
The time period May through October 2010 shows that ground temperatures at FWG are sensitive to anomalously high air temperatures, which accelerate melting of snow at the surface ( and 14). Despite an indication of snowfall during May, anomalous air temperature during the 2010 El Niño quickly melted the snow, we suspect, and resulted in large surface offsets and increasing temperature at 1 and 2 m.
Retreating glaciers and basal ice temperature
The englacial and basal temperatures of a glacier reflect both ambient climate and any present or past geothermal heat flow. In turn, these temperature characteristics impact ice rheology and the thermal environment beneath the ice. Temperate or warm glaciers, like those on Kilimanjaro, are essentially at the melting point throughout, except perhaps near the surface during cold portions of the year.
Isothermal glacier ice at 0°C implies that water may be present within and beneath the glacier. At the Furtwängler Glacier during the February 2000 ice core drilling campaign, a 9.5-m core penetrated to sand beneath water-saturated ice (Thompson et al. Citation2002). We have subsequently observed meltwater at the surface (locally) as well as within the glacier (Hardy, unpublished data). Elsewhere in 2000, two shorter cores were drilled through the Southern Icefield, with ice thicknesses of 18.5 and 22.3 m; no water was reported in these holes and the ice was near 0°C (Thompson et al. Citation2002). At NIF, the largest of the Kilimanjaro ice bodies, three cores were drilled through ice and were 50.9, 50.8, and 49.0 m thick. Temperatures in the NIF glacier borehole ranged from −1.2°C at 10-m depth to −0.4°C at the base, with no water observed (Thompson et al. Citation2002). However, within a short period of time after drilling (23 February), a water table was present near the surface and in one of the drill holes at unknown depth (Hardy, unpublished data). Since then, water-saturated ice has regularly been observed when drilling 1-m-deep ablation stake holes.
Observations of melting at the NIF glacier surface are despite a negative surface offset between the mean annual air temperature of −6.1°C and mean glacier surface (skin) temperature of −9.2°C (both 2004–2020; Hardy, unpublished data). There is therefore a sharp temperature gradient just below the ice surface. The only existing intermediate depth measurement is the 10-m depth value of −1.2°C reported two decades ago (Thompson et al. Citation2002).
Subfreezing temperatures have not been measured or indirectly observed at the base of any Kilimanjaro glaciers, besides the 2000 NIF drill hole measurement of −0.4°C. In contrast, numerous sites have been observed where enhanced geothermal heat has locally melted basal ice (see Geothermal heat flow in Results section). Our NIF borehole, drilled only 7 m from a thick vertical wall of ice and recently unglacierized, confirmed no permafrost at that location. On the basis of these admittedly limited observations, we believe it is unlikely that large areas of permafrost exist beneath glaciers on the mountain.
Furtwängler Glacier is currently the only body of ice existing entirely within the summit caldera, likely due to a combination of lower temperatures due to topographic shading and/or enhanced snowfall. The FWG permafrost borehole site has historically not been glacier covered yet may remain snow covered for longer periods than elsewhere in the caldera. For example, a 1938 aerial view of the summit shows a greatly enlarged glacier () yet no snow cover at the FWG borehole site.
Permafrost at FWG site may have formed as the glacier itself was forming, during the relatively wetter and colder environment of the most recent wetter/cooler period. The site is at the lowest spot of the Kibo caldera basin, with a thick sand layer (3 m) that promotes water accumulation and saturation, which leads to ice-bonded permafrost during wetter and colder intervals. Once ice formed, very high thermal resistance required considerable latent heat energy to completely thaw out. An impermeable layer (lava) under the sand benefits water saturation in that area, and the area may have lower geothermal flux in comparison with the surrounding area. Therefore, FWG permafrost likely formed during a Holocene colder period(s) and exists in relict form as “temperate” permafrost today.
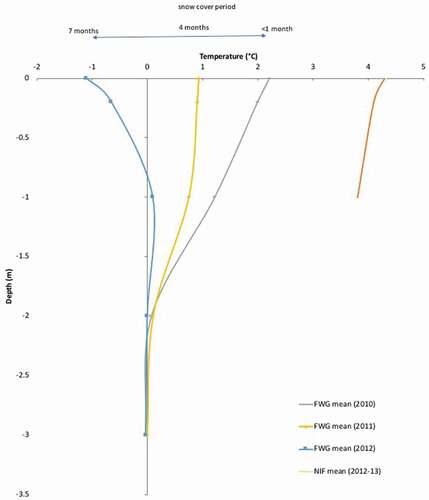
depicts several profiles of the Kilimanjaro ground temperature regime. The interannual variability of snow cover during our measurement period demonstrated the close relationship between snow cover duration and annual ground surface temperature, ranging from +2.2°C during a warm year with little snow cover to a surface temperature of −1.1°C during a year of greater snow cover. As shown in , permafrost would develop at the summit area during a colder period with snow cover most of the year. At present, the LLAP is estimated at around 6,100 m.a.s.l. by the 1-m depth mean annual ground temperature lapse rate, providing a first-order approach to estimate the potential lower permafrost boundary. During a Holocene colder period, the permafrost limit was possibly 300 to 400 m lower. At the Last Glacial Maximum, the glacier equilibrium line altitude was probably 700 m lower at Kilimanjaro (Kaser and Osmaston Citation2002). These elevation estimations during cold periods fit well with the potential conditions needed for the development of permafrost at the summit area.
Figure 15. Kilimanjaro ground temperature profiles from FWG and NIF drill sites, governed by the period of snow cover (top).
Conclusions
This article reports on observations of the thermal state of permafrost found in equatorial eastern Africa on its highest peak, Kilimanjaro. A very limited sector of the summit area confirmed permafrost close to thawing and in critical balance with the current climate. Permafrost is present at higher elevation in ice-bonded sandy materials, at shady sites with low geothermal heat flow conditions, and at sites with longer-lasting snow cover. The current estimated LLAP at 6,100 m.a.s.l. is based on the analysis of the 1-m depth ground temperature lapse rate. Warm permafrost was found at 5,735 m.a.s.l. during the drilling operation. However, with current climatic conditions it would be unlikely for permafrost to form in the summit area. Permafrost likely formed simultaneous to the formation of FWG during a Holocene colder period. During the next decades, the disappearance of permafrost will depend on the length of the snow cover period; permafrost will slowly be lost if the snow cover continues to be less than three to five months every year.
The number of effective freeze–thaw cycles showed a large increase between 4,170 and 4,590 m.a.s.l., reflecting the higher potential for frost-shattering activity. Patterned ground (miniature sorted nets and stripes) occurs above 4,170 m.a.s.l., especially on the gentle slopes of the summit area. This is due not only to the number of effective freeze–thaw cycles but also to the prevalence of moisture from melting snow and glaciers in summit areas.
Acknowledgments
The research has been made possible thanks to the INE UAF, Nobuo Matsumoto, Koichiro Harada, and Kazuyuki Saito. Our sincere thanks and gratitude to UAF WERC, IARC staff members and GLOBE students and teachers (especially Robbie Everett, Janny Heckathorn and Dan Heckathorn) for help with laboratory analyses and field support. We also thank the hard-working, friendly Tanzanian staff of Summit Expeditions (SENE). Professor Gonçalo Vieira and an anonymous reviewer provided insightful comments and suggestions that improved this article.
Disclosure statement
No potential conflict of interest was reported by the authors.
Additional information
Funding
References
- Andres, N., D. Palacios, J. J. Zamorano, and L. V. Zquez-selem. 2011. Shallow ground temperatures and periglacial processes on Iztaccíhuatl volcano, Mexico. Permafrost and Periglacial Processes 22 (2):188–94. doi:https://doi.org/10.1002/ppp.713.
- Basalirwa, C. P. K., J. O. Odiyo, R. J. Mingodo, and E. J. Mpeta. 1999. The climatological regions of Tanzania based on the rainfall characteristics. International Journal of Climatology 19 (1):69–80. doi:https://doi.org/10.1002/(SICI)1097-0088(199901)19:1<69::AID-JOC343>3.0.CO;2-M.
- Betterton, M. D. 2001. Theory of structure formation in snowfields motivated by penitentes, suncups, and dirt cones. Physical Review E 63 (5):056129.
- Biskaborn, B. K., S. L. Smith, J. Noetzli, H. Matthes, G. Vieira, D. A. Streletskiy, P. Schoeneich, V. E. Romanovsky, A. G. Lewkowicz, A. Abramov, et al. 2019. Permafrost is warming at a global scale. Nature Communications 10 (1):264. doi:https://doi.org/10.1038/s41467-018-08240-4.
- Calonne, N., F. Flin, S. Morin, B. Lesaffre, S. R. Du Roscoat, and C. Geindreau. 2011. Numerical and experimental investigations of the effective thermal conductivity of snow. Geophysical Research Letters 38 (23):1–6. doi:https://doi.org/10.1029/2011GL049234.
- Corripio, J. G., and R. S. Purves. 2005. Surface energy balance of high-altitude glaciers in the central Andes: The effect of snow penitentes. Climate and Hydrology in Mountain Areas:1–18.
- Cullen, N. J., P. Sirguey, T. Mölg, G. Kaser, M. Winkler, and S. J. Fitzsimons. 2013. A century of ice retreat on Kilimanjaro: The mapping reloaded. The Cryosphere 7 (2):419–31. doi:https://doi.org/10.5194/tc-7-419-2013.
- Cullen, N. J., T. Mölg, G. Kaser, K. Hussein, K. Steffen, and D. R. Hardy. 2006. Kilimanjaro glaciers: Recent areal extent from satellite data and new interpretation of observed 20th century retreat rates. Geophysical Research Letters 33 (16):L16502. doi:https://doi.org/10.1029/2006GL027084.
- Darwin, C. 1839. Journal of researches into the geology and natural history of the various countries visited by H. M. S. Beagle, under the command of captain Fitz Roy, R.N., 1832 to 1836. H. London: Colburn.
- Downie, C., and P. Wilkinson. 1972. The geology of Kilimanjaro. UK: Geology Department University of Sheffield.
- Duane, W. J., N. C. Pepin, M. L. Losleben, and D. R. Hardy. 2008. General characteristics of temperature and humidity variability on Kilimanjaro, Tanzania. Arctic, Antarctic, and Alpine Research 40 (2):323–34. doi:https://doi.org/10.1657/1523-0430(06-127)[DUANE]2.0.CO;2.
- Gorbunov, A. P. 1978. Permafrost investigations in high-mountain regions. Arctic and Alpine Research 10 (2):283–94. doi:https://doi.org/10.2307/1550761.
- Groos, A., J. Niederhauser, L. Wraase, F. Hansel, T. Nauss, N. Akcar, and H. Veit. 2020. Implications of present ground temperatures and relict stone stripes in the Ethiopian Highlands for the palaeoclimate of the tropics. Earth Surface Dynamics Discussion. doi:https://doi.org/10.5194/esurf-2020-53.
- Hardy, D. R. 2004. Furtwängler Glacier margin collapse - January 2003. Amherst: Climate System Research Center, University of Massachusetts Accessed May 15, 2020. www.geo.umass.edu/climate/tanzania/fwg04.html.
- Hardy, D. R. 2011. Kilimanjaro. In Encyclopedia of snow, ice and glaciers, ed. V. P. Singh, P. Singh, and U. K. Haritashya, 672–79. Dordrecht: Springer.
- Hastenrath, S., and L. Greischar. 1997. Glacier recession on Kilimanjaro, East Africa, 1912–89. Journal of Glaciology 43 (145):455–59. doi:https://doi.org/10.1017/S0022143000035048.
- Jäger, F. 1909. Forschungen im den Hochregionen des Kilimandscharo. Mitteilungen aus den Deutschen Schutzgebieten 22:113–97.
- Kaser, G., D. R. Hardy, T. Mölg, R. S. Bradley, and T. M. Hyera. 2004. Modern glacier retreat on Kilimanjaro as evidence of climate change: Observations and facts. International Journal of Climatology 24 (3):329–39. doi:https://doi.org/10.1002/joc.1008.
- Kaser, G., and H. Osmaston. 2002. Tropical glaciers, 207. Cambridge, UK: Cambridge University Press.
- Lliboutry, L. 1954. The origin of penitentes. Journal of Glaciology 2 (15):331–38.
- Matsuoka, N. 1990. Mechanism of rock breakdown by frost action: An experimental approach. Cold Regions Science and Technology 17 (3):253–70. doi:https://doi.org/10.1016/S0165-232X(05)80005-9.
- Mena, G., K. Yoshikawa, N. Schorghofer, C. Pastén, F. A. Ochoa, Y. Yoshii, M. Doi, T. Miyata, H. Takahashi, G. Casassa, et al. 2021. Freeze–thaw cycles and snow impact at arid permafrost region in Chajnantor Volcano, Atacama, northern Chile. Arctic, Antarctic, and Alpine Research 53 (1):60–66. doi:https://doi.org/10.1080/15230430.2021.1878739.
- Mölg, T., and D. R. Hardy. 2004. Ablation and associated energy balance of a horizontal glacier surface on Kilimanjaro. Journal of Geophysical Research 109 (D16):D16104. doi:https://doi.org/10.1029/2003JD004338.
- Mölg, T., N. J. Cullen, D. R. Hardy, M. Winkler, and G. Kaser. 2009. Quantifying climate change in the tropical midtroposphere over East Africa from glacier shrinkage on Kilimanjaro. Journal of Climate 22 (15):4162–81. doi:https://doi.org/10.1175/2009JCLI2954.1.
- Nicholson, S. E. 2017. Climate and climatic variability of rainfall over eastern Africa. Reviews of Geophysics 55:590–635. doi:https://doi.org/10.1002/2016RG000544.
- Schorghofer, N., M. Leopold, and K. Yoshikawa. 2017. State of high-altitude permafrost on tropical Maunakea volcano, Hawaii. Permafrost and Periglacial Processes 28 (4):685–97. doi:https://doi.org/10.1002/ppp.1954.
- Spink, P. C. 1945. Further notes on the Kibo inner crater and glaciers of Kilimanjaro and Mount Kenya. The Geographical Journal 106 (5/6):210–16. doi:https://doi.org/10.2307/1788958.
- Thompson, L. G., E. Mosely-Thompson, M. E. Davis, K. A. Henderson, H. H. Beecher, V. S. Zagorodnov, T. A. Mashiotta, P. Lin, V. N. Mikhalenko, D. R. Hardy, et al. 2002. Kilimanjaro ice core records: Evidence of Holocene climate change in tropical Africa. Science. 298 (5593):589–93. doi:https://doi.org/10.1126/science.1073198.
- University of Wisconsin–Milwaukee Library. Li000958, taken by Mary Meader at 07:20 on 15 January 1938. https://collections.lib.uwm.edu/digital/collection/agsafrica/id/488/rec/239
- Vieira, G., C. Mora, and A. Faleh. 2017. New observations indicate the possible presence of permafrost in North Africa (Djebel Toubkal, High Atlas, Morocco). The Cryosphere 11 (4):1691–705. doi:https://doi.org/10.5194/tc-11-1691-2017.
- Vizoto, V. 2018. Estado del arte de la investigación periglaciar en México, 97. Investigaciones Geográficas. doi:https://doi.org/10.14350/rig.59811.
- Winkler, M., G. Kaser, N. J. Cullen, T. Mölg, D. R. Hardy, and W. Tad Pfeffer. 2010. Land-based marginal ice cliffs: Focus on Kilimanjaro. Erdkunde 64 (2):179–93. doi:https://doi.org/10.3112/erdkunde.2010.02.05.
- Woodcock, A. H. 1974. Permafrost and climatology of a Hawaii volcano crater. Arctic and Alpine Research 6 (1):49–62. doi:https://doi.org/10.2307/1550369.
- Yang, W., R. Seager, M. A. Cane, and B. Lyon. 2015. The annual cycle of East African precipitation. Journal of Climate 28 (6):2385–404. doi:https://doi.org/10.1175/JCLI-D-14-00484.1.
- Yoshikawa, K. 2013. Permafrost in our time. Valencia, CA: University of Alaska Fairbanks. https://cryoperu.files.wordpress.com/2014/12/yoshikawa-2013-permafrost-in-our-time.pdf
- Yoshikawa, K. 2017. Вечная мерзлота в наше время [Permafrost in Our Time–Siberian communities], 211. North-eastern Federal University. (in Russian). ISBN 978-5-905573-44-6.
- Yoshikawa, K., J. Ubeda, P. Masias, W. Pari, F. Apaza, P. Vasquez, B. Ccallata, et al. 2020. Current thermal state of permafrost in the southern Peruvian Andes and potential impact from El Niño–Southern Oscillation (ENSO). Permafrost and Periglacial Processes 31 (4):598–609. doi:https://doi.org/10.1002/ppp.2064.