
ABSTRACT
Climate change is impacting lakes and ponds in Antarctica. To that end, we investigated the distribution and chemical composition of ice-covered ponds in Untersee Oasis, East Antarctica. Thirty-nine ponds were inventoried, and the thirteen sampled ponds have low total dissolved solutes (TDS) with a Ca(Na)-SO4 or Na-Cl geochemical facies. Tritium and radiocarbon measurements of the total inorganic carbon (TIC) suggest that the ponds are recharged by modern snowmelt. Hierarchical cluster analysis grouped the ponds based on the amount of potential incoming solar radiation reaching their surface. Ponds receiving higher insolation develop moats or completely lose their ice cover during summer, have lower pH, and higher TDS, δ18O, total inorganic carbon, and δ13CTIC,which suggest CO2 availability is not limiting benthic photosynthetic activity. The ponds that receive lower insolation retain their full ice cover and remain well-sealed to direct exchanges with the atmosphere, have high pH, and lower TDS and TIC, and likely host a CO2-starved benthic microbial ecosystem. Therefore, the state of the ponds’ ice cover evolved their hydrochemistry along different trajectories. The findings can be used to predict the trajectory of the chemical composition of the ponds and effect on biological productivity as the phenology of their ice cover shifts under a warming climate.
Introduction
The ice-free regions of Antarctica contain hundreds of surface ice–covered lakes and ponds that host benthic microbial ecosystems (Matsumoto et al. Citation1992; Doran et al. Citation2004; W. F. Vincent, Hobbie, and Laybourn-Parry Citation2008). Studies on perennially ice-covered lakes in the McMurdo Dry Valleys (MDV) suggested that the chemical and biological properties of the water column and the primary productivity of the benthic microbial ecosystem are associated with the phenology of their ice cover (Fountain et al. Citation2016; Obryk et al. Citation2016; Gooseff et al. Citation2017) and changes to recharge conditions (Matsubaya et al. Citation1978; Lyons et al. Citation2012; Mikucki et al. Citation2015; Badgeley et al. Citation2017; Lawrence et al. Citation2020). With increasing air temperature, some MDV lakes (e.g., Lake Bonney) are predicted to undergo a shift from a perennial to seasonal ice cover within the coming decades, thereby affecting the chemical and biological properties of the water column (Echeverría et al. Citation2019; Obryk, Doran, and Priscu Citation2019). For example, thinning or melting of lake ice cover during austral summer would increase light levels and initiate wind-driven mixing and disrupt the stratification and circulation patterns (Obryk et al. Citation2016; Begin et al. Citation2021). The addition of surface meltwater could increase the turbidity and ionic composition of the water column while delivering allochthonous carbon and nutrients (Priscu Citation1995; Dore and Priscu Citation2001; Andersen, McKay, and Lagun Citation2015). However, because the ice-covered lakes in the MDV all have a permanent ice cover, predictions that a shift to a seasonal ice cover will modify their hydrochemistry and microbial activity are based mainly on studies from seasonally ice-covered lakes along coastal regions (e.g., Schirmacher Oasis, Bunger Hills, and Vestfold Hills) and high Arctic ice-covered lakes (e.g., A. C. Vincent, Mueller, and Vincent Citation2008; Mueller et al. Citation2009; Lehnherr et al. Citation2018).
The Untersee Oasis in Dronning Maud Land (East Antarctica) is an approximately 60 km2 ice-free region that hosts two large perennially ice-covered lakes and numerous smaller ice-covered ponds (Kaup et al. Citation1988; Priscu and Foreman Citation2009; Haendel et al. Citation2011). Field observations showed that lakes Untersee and Obersee and some of the ponds have a permanent ice cover and do not develop moats during the summer, whereas other ponds completely lose their ice cover. Therefore, the lakes and ponds in the Untersee Oasis present the full spectrum of ice cover types (i.e., perennially to seasonally ice-covered). Consequently, comparing hydrochemical properties between ponds with different kinds of ice cover from the same region can yield insight into the potential shift in the chemical and biological properties of the water column under a warming climate. The study’s objective is to establish the current physical characteristics and hydrochemical conditions of the ice-covered ponds in the Untersee Oasis in order to monitor potential future changes under a warming climate. This is accomplished by (1) describing the distribution and morphometric properties of the ponds in the valley of Lake Untersee; (2) determining the concentration of major solutes, total inorganic and organic carbon (TIC-TOC), δD-δ18O composition, tritium, and radiocarbon of TIC (14CTIC) to assess the source of solutes and water recharging the ponds; and (3) modeling the evolution of their solute load and δ18O during freezing or evaporation. The measurements and modeling are used to predict the trajectory of the hydrochemical properties of the ponds under a warming climate as they transition from moatless perennially ice-covered ponds to moated perennially ice-covered ponds and eventually to seasonally ice-covered ponds.
Study area
Untersee Oasis (71.3°S; 13.5°E) is located in the Gruber Mountains of Queen Maud Land, approximately 150 km from the coast and approximately 90 km southeast of the Schirmacher Oasis (). Untersee Oasis is surrounded by the East Antarctic Ice Sheet and includes two main ice-free valleys: (1) Lake Untersee Valley, an approximately 11-km-long and approximately 4-km-wide north–south trending valley, and (2) Aurkjosen Cirque, an approximately 4-km-long and approximately 3-km-wide east–west trending valley. The local geology consists of Precambrian norite, anorthosite, and anorthosite–norite alternation of the Eliseev massif complex (Kampf and Stakerbrandt Citation1985; Bormann et al. Citation1986; Paech and Stackebrandt Citation1995). The East Antarctic Ice Sheet completely covered the Untersee Oasis during the Late Pleistocene, and based on 14C ages of stomach oils from snow petrel nests, thinning of the ice sheet began at c. 35 to 30 ka (Hiller et al. Citation1988). The thinning of the ice sheet led to a reconfiguration of the local ice flow, and Untersee Oasis came to its current configuration at c. 6 to 4 ka. The surface sediments in the Oasis consist mainly of till and colluvium, often covered by a thin layer of eolian sediments (Schwab Citation1998). The Lake Untersee Valley has a large terminal moraine at its southern section with ice-cored lateral moraines along its eastern and western sections.
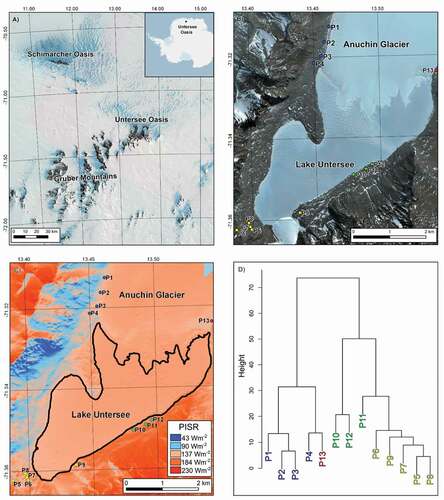
Figure 1. (a) Location map of Untersee Oasis in Dronning Maud Land (LIMA Landsat high-resolution virtual mosaic; Bindschadler et al. Citation2008); (b) Map showing the location of sampled ponds (background is a WorldView satellite image acquired 7 December 2017). The ponds are located on the west (blue dots) and east (red dot) lateral moraines of the Anuchin Glacier, the terminal moraine (yellow dots) and on the glacial diamicton a few meters above the eastern shore of Lake Untersee (green dots); (c) Map of Potential Incoming Solar Radiation (PISR; Wm-2) of the Untersee Oasis during the austral summer; (d) Hierarchical cluster plot of the ponds (based on their pH, total inorganic carbon, total organic carbon, PISR, δ18O, and D-excess values).
The Oasis is part of a polar desert climate regime. Climate data collected during the 2008–2017 period by an automated weather station along the shoreline of Lake Untersee (71.34°S, 13.45°E, 612 m.a.s.l.) yielded a mean annual air temperature of −9.5°C ± 0.7°C with thaw degree-days ranging from seven to fifty-one and a mean relative humidity of 42 ± 5 percent (Andersen, McKay, and Lagun Citation2015; Faucher et al. Citation2019). Despite having a relatively warm mean annual air temperature for Antarctica, the climate in the Oasis is dominated by intense evaporation and sublimation, limiting surface melting due to cooling associated with the latent heat of sublimation (e.g., Hoffman, Fountain, and Liston Citation2008). The precipitation in the region is characterized by Ca(Na)-SO4 facies (Isaksson et al. Citation1996), and near-surface samples of the Anuchin Glacier and local snow have δ18O values ranging from −36.4 to −22.3 per mill (Faucher et al. Citation2020). These samples define a local meteoric water line with a slope of 7.8 (δD = 7.8*δ18O + 5.2; unpublished data), similar to the one at nearby Neumayer station (δD = 7.9*δ18O + 7.6; Fernandoy et al. Citation2010). The tritium concentration of snow sampled at the nearby Schirmacher Oasis in the late 1990s was 5.8 ± 0.5 tritium units (TU; Sinha et al. Citation2000).
The hydrology of Untersee Oasis is characterized by standing water bodies with no supraglacial streams on the Anuchin glacier. Lake Untersee (8.7 km2) and Lake Obersee (3.4 km2) are the two largest perennially ice-covered lakes, and both lakes do not develop moats during austral summer. Besides these two lakes, numerous ice-covered ponds are found along the lateral and terminal moraines of the Lake Untersee valley. The smallest water bodies are found in cryoconite holes on the Anuchin glacier and glacial ice patches on the ice cover Lake Untersee (Weisleitner et al. Citation2019, Citation2020). The Aurkjosen Cirque has one small perennially ice-covered pond located at the head of the valley, directly below a hanging glacier. Within the Oasis, lakes Untersee, Obersee, and Burevestniksee (situated on the west lateral moraine; herein referred to as P3) are the only water bodies previously analyzed for their geochemical composition. All three lakes are characterized by high pH (9.5–11.4), high dissolved oxygen (120–280 percent) and low specific conductivities (90–480 µS cm−1). Snow petrels are one of the few wildlife inhabiting the Oasis, and they are often found bathing in moated sections of some ponds.
Methodologies
Distribution and morphology of ponds
The distribution and morphology of ponds in Untersee Oasis were determined from photos acquired in December 2017 and November 2019 using a DJI Phantom 4 Pro unmanned air vehicle. The unmanned air vehicle was flown 30 m above the ground in a gridded survey using the DJI Mission Planner softwarewith 85 percent forward and 75 percent side overlap. The photos at 1-cm resolution were captured at 400 ISO, shutter speed of 1/1,000 seconds, and focus fixed at infinity. The accuracy of the Global Positioning System tags from the JPEG Exif metadata was optimized with ground control points surveyed using a Trimble R9s dGPS and a local base station. Agisoft Photoscan Pro v.1.4 softwarewas used to generate point cloud models of the ponds. The dense point cloud models in .LAS data format (WGS 1984 UTM zone 33S projection) were used to create orthomosaics and digital surface models. The orthomosaics and digital surface models were used to determine each pond’s elevation and surface area and the height and volume of ice blisters (if present) using the Surface Volume tool in ArcGIS Pro 2.4.
Field sampling
Out of the thirty-nine ponds identified in Untersee Oasis, thirteen were sampled to determine their geochemical composition. Water was collected near the edge of each pond, and no attempt was made to determine whether the ponds were stratified; the samples should be considered as surface water. Due to the high pH of the ponds, the samples were collected unfiltered and transferred immediately into sampling bottles with care to limit exchanges with atmospheric CO2. Water samples for major ions and δD-δ18O analyses were collected in sealed 20 mL high-density polyethylene bottles (samples for cations and anion were collected in separate bottles, with cation samples acidified using 2 μL of trace metal–grade 10 percent nitric acid). Samples for pH, specific conductivity, TIC-TOC, and δ13CTIC compositions were collected in 40 mL prebaked glass amber bottles with care to limit atmospheric interactions. Samples for 14CTIC analyses were collected in 1 L prebaked glass amber bottles. Samples for tritium were collected in sealed 125 or 1000 mL high-density polyethylene bottles. All water samples were shipped in coolers and stored at 4°C until analyses at the University of Ottawa.
Laboratory analyses
The pH and specific conductivity of the ponds were measured from samples collected in glass amber bottles with septum using a calibrated Mettler Toledo handheld meter. For measurements, the septum was removed and the probe was inserted in the cap to limit exchange with atmospheric CO2. Major cations (Ca2+, Na+, Mg2+, and K+) were measured acidified using an Agilent 4200 inductively coupled plasma atomic emission spectrometer. Major anions (SO42−, NO3−, and Cl−) were measured by ion chromatography using a DIONEX ion chromatograph. Analytical precision is ±5 percent. The average charge balance error was +12 percent using measured cations–anions and [OH−] for a pH of 10. Charge balances (based on meq/L concentrations) were calculated from the difference between the sum of all major cations and anions divided by the sum of all major ions (100 × (sum of cations − sum of anions)/(sum of all major ions)).
The stable water isotopes of the ponds and melted ice samples were determined simultaneously using a Los Gatos Research liquid water analyzer coupled to a CTC LC-PAL autosampler. Each sample and standard were injected seven times, and the measurements from the first three injections were discarded to minimize memory effect between injections. The other four measurements were averaged, provided that there was no spectral contamination. The results are presented using the δ notation, where δ represents the parts per thousand differences for 18O/16O or D/H in a sample with respect to Vienna Standard Mean Ocean Water based on a set of three internal standards with values between the expected range of the samples analyzed at the beginning and end of each run and after every five samples. Analytical reproducibility for δ18O and δD was ±0.3 and ±1 per mill, respectively. Deuterium excess (d) was calculated according to Dansgaard (Citation1964; d = δD − 8*δ18O).
The TIC, TOC, and their stable isotope ratios (13C/12C) in the ponds were measured at the Ján Veizer Laboratory (University of Ottawa, Canada) by a wet TOC analyzer interfaced with a Thermo DeltaPlus XP isotope ratio mass spectrometer using methods described by St-Jean (Citation2003). The isotope ratios are presented using the δ notation with respect to the Vienna Ped Dee Belemnite reference. The 2σ analytical precision is ±0.5 ppm for TOC and TIC concentrations and ±0.2 per mill for the isotopes. The detection limit of TIC and TOC analyses is <0.3 ppm.
Radiocarbon analysis of the TIC in the ponds was performed at the A.E. Lalonde Accelerator Mass Spectrometry Laboratory (University of Ottawa, Canada). Sample preparation, extraction of inorganic and organic from waters, and graphitization was described by Murseli et al. (Citation2019). Graphitized samples were analyzed on a 3 MV tandem mass spectrometer. The 14C/12C ratios are expressed as fraction of modern carbon (F14C) and corrected for spectrometer and preparation fractionation using the Accelerating Mass Spectrometry (AMS)-measured13C/12C ratio (Crann et al. Citation2017). Radiocarbon ages are calculated as −8,033ln(F14C) and reported in 14C year BP (BP = AD 1950) as described by Stuiver and Polach (Citation1977). The 2σ errors are less than 0.013 F14C (or <190 years).
Tritium (3H) sample preparation and measurement were performed by the A.E. Lalonde Tritium and Radiohalide Laboratory (University of Ottawa). The samples were enriched by electrolytic and were then decay counted on a low-background Quantilus liquid scintillation counter. Results are reported in tritium units, and the 2σ analytical precision is ±0.8 TU.
Modeling potential incoming solar radiation
The amount of potential incoming shortwave radiation that reaches the ice-covered lakes significantly impacts their heat and energy balance (Mckay et al. Citation1985; Petrov et al. Citation2005). The potential incoming solar radiation (PISR) in the Untersee Oasis was determined using the Area Solar Radiation tool in ArcGIS Pro 2.4 and the 8-m spatial resolution Reference Elevation Model of Antarctica (Howat et al. Citation2019). The PISR was computed at 1-hour intervals for austral summer (November, December, January, and February) with a sky size of 512 cells and cloud cover and transmissivity set at 30 and 80 percent (according to Andersen, McKay, and Lagun (Citation2015), respectively. The PISR is represented in Watt-hour per square meter (WHm−2) and was converted to Watt per square meter (Wm−2) by dividing the duration of the radiation. The accuracy of the output of the PISR raster was assessed by comparing it to the incoming radiation measured at the meteorological station at Lake Untersee (measured = 100 Wm−2 by Andersen, McKay, and Lagun [Citation2015] and modeled = 120 Wm−2).
Results and discussion
Distribution of ponds in Untersee Oasis
A total of 39 ponds were inventoried in the Lake Untersee Valley. The ponds are located in four regions: the west (n = 24) and east (n = 7) lateral moraines of the Anuchin Glacier, the terminal moraine (n = 5), and on the diamicton a few meters above the eastern shore of Lake Untersee (n = 3); no ponds were observed on the west shoreline of the lake (). The mean surface area of the ponds is 2,190 ± 4,536 m2 (60–21,771 m2), and based on Landsat and Digital Globe imagery, they maintained a similar extent for the past two decades. Unlike ponds in the MDV (e.g., Lyons et al. Citation2012), most of the sampled ponds in Untersee Oasis do not show a relation between surface area and elevation except for the ponds situated along the west lateral moraine (). Field and airborne observations suggest that channels interconnect these ponds, and a spill-and-fill could explain why P3 (Lake Burevestniksee), located at a lower elevation, is the largest one along the western moraine. The interconnectivity of ponds was also noted for those on the east lateral moraine, but the elevation–surface area relation is weak. The PISR during the austral summer in the Untersee Oasis ranges from 119 to 162 Wm−2, with ponds located along eastern sections receiving higher PISR (). This spatial variation in the PISR affects the phenology of the ice cover during austral summers. In December 2019, some of the ponds along the east shoreline of Lake Untersee had developed moats (e.g., P5–P9, P11–P12), whereas others completely lost their ice cover (e.g., P10). Conversely, the ponds along the western lateral moraine (i.e., P1–P4) did not develop moats, and their shorelines were still covered by snow.
Figure 2. (a) Aerial photo of some ponds along the west lateral moraine. (b) Scatterplot of surface area (m2) and elevation of ponds in the Untersee Oasis. Note a negative relationship between pond elevation and surface for the west lateral moraine ponds (blue dots). (c) Scatterplot of the surface area (m2) and elevation relation for lakes and ponds in the McMurdo Dry Valleys (data from Lyons et al. [Citation2012] and Fountain et al. [Citation2017]). See for location of the ponds.
![Figure 2. (a) Aerial photo of some ponds along the west lateral moraine. (b) Scatterplot of surface area (m2) and elevation of ponds in the Untersee Oasis. Note a negative relationship between pond elevation and surface for the west lateral moraine ponds (blue dots). (c) Scatterplot of the surface area (m2) and elevation relation for lakes and ponds in the McMurdo Dry Valleys (data from Lyons et al. [Citation2012] and Fountain et al. [Citation2017]). See Figure 1 for location of the ponds.](/cms/asset/3232821e-0d06-40f2-bf9a-6defa61c7bcd/uaar_a_2000566_f0002_oc.jpg)
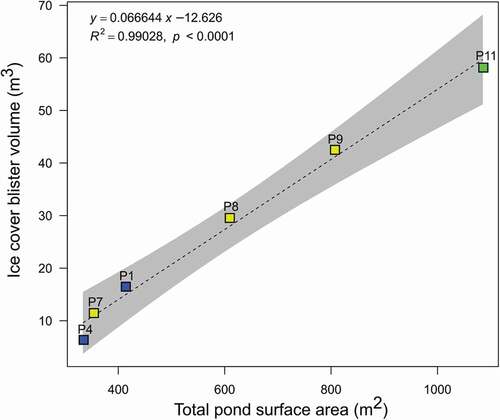
Singular ice blisters were observed on six of the thirteen sampled ponds. All six blisters were elliptical in shape with average height, surface area and volume of 0.48 m, 157 m2, and 27.4 m3 (). Dilation cracks were observed on all ice blisters and were typically oriented along the long axis of the blisters. The surface area of ponds with ice blisters was less than 1,000 m2, and the volume of the ice blister showed a positive relationship with the surface area of the ponds (). Ice blisters on perennially ice-covered ponds have also been observed in Terra Nova Bay (Northern Victoria Land; Guglielmin et al. Citation2009; Ponti et al. Citation2021). The ice blisters in Terra Nova Bay have morphology similar to those in Untersee Oasis, and also exibit a positive correlation between the surface area of the ponds and the volume of the blister. This positive relationship suggests that the ice blisters are likely formed by closed-system hydrostatic pressures developing during the accretion of the ice cover in winter and that their water column almost completely freezes to the bottom. The ponds that do not develop ice cover blisters likely have a water column that remains thick enough in the winter to prevent hydrostatic uplift of the overlying ice cover.
Table 1. Morphometric characteristics of ponds and their ice blisters in the Untersee Oasis. See for the location of ponds
Figure 3. Scatterplot of the relation between total pond surface area (m2) and ice blister volume (m3).
Geochemistry of ponds
A hierarchical cluster analysis was performed to summarize the measured physical and chemical variables of the thirteen sampled ponds in Untersee Oasis. The hierarchical cluster analysis clustered the ponds into three groups based on their location and spatial variation in PISR (). Group 1 consists of the ponds along the west and east lateral moraines (i.e., P1–P4, P13). These ponds receive low PISR (119–129 Wm−2), they do not develop a moat, and their near-surface water is characterized by a high pH (8.4–11.8; ). Further, they have a wide range in specific conductivity (84–900 µS cm−1), an Na-Cl facies (except for P3 and P13, which respectively have Ca-SO4 and Ca-Cl facies; ), and δ18O values that are the most depleted among the ponds (−41.9 to −30.3 per mill; , 5b) and negatively correlated with [Cl−] (except for P13); this group of ponds shares the most characteristics with Lake Untersee (i.e., Marsh et al. Citation2020). Group 2 consists of the ponds located along the east shoreline of Lake Untersee. These ponds receive the highest PISR (154–162 Wm−2), and most develop moats during the summer (i.e., P11–P12), whereas others have a seasonal ice cover (i.e., P10). The near-surface waters have the lowest pH (6.9–7.8) with high specific conductivity (162–2,380 µS cm−1) and high δ18O values (−24.3 to −20.9 per mill; , 5b) that are positively correlated with [Cl−]. Their δD-δ18O values plot well below the local meteoric water line. Group 3 includes the ponds situated on the terminal moraine (i.e., P5–P9) of the Lake Untersee Valley. These ponds receive intermediate PISR (134–144 Wm−2), and some develop moats. They have an Na-SO4 geochemical facies (), neutral to high pH (7.1–9.7), and low specific conductivity (59–232 µS cm−1) and their δ18O values (, 5b) show no relation with [Cl−]. In the following sections, we discuss the source of solutes, the effect of PISR on moating and evolution of the water chemistry, and the trajectory of the chemical composition of ponds under a warming climate.
Table 2. pH, conductivity, and major ions of ponds in the Untersee Oasis. See for the location of ponds
Figure 4. Geochemical composition of ponds in the Untersee Oasis. (a) Cations ternary plot; (b) anions ternary plot; (c) concentration of major cations; and (d) Cl− normalized molar ratios line chart for Ca, Na, SO4, and TIC. Values from the oxic waters of Lake Untersee and nearby snow/firn samples have been added for comparisons (from Isaksson et al. Citation1996).
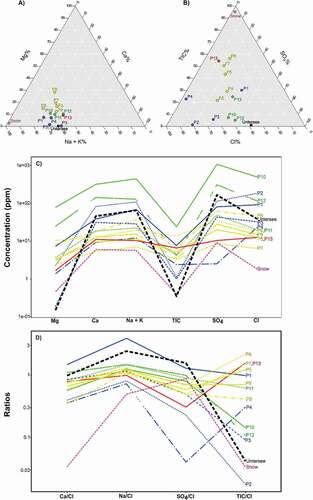
Figure 5. Scatterplots of (a) δD-δ18O of near-surface water and (b) ice cover samples of ponds in the Untersee Oasis. (c) Modeling of the evolution of δ18O and [Cl−] in the ponds under steady-state freezing (group 1) and evaporation (group 2; relative humidity set at 80 percent). In both simulations, the initial δ18O is set to −32 per mill, and the initial Cl− values are set to 5 and 10 ppm (similar to that of the nearby DML firn core; Isaksson et al. Citation1996). Also shown is steady-state freezing assuming initial δ18O = −35 per mill and 1 percent mixing rate. Grey dotted lines show the evolution of δ18O-[Cl−] for freezing only of well-sealed pond (no annual recharge). Black dots with decimal numbers indicate the fraction of residual water remaining. Squares and circles indicate ponds with and without ice cover blisters, respectively.
![Figure 5. Scatterplots of (a) δD-δ18O of near-surface water and (b) ice cover samples of ponds in the Untersee Oasis. (c) Modeling of the evolution of δ18O and [Cl−] in the ponds under steady-state freezing (group 1) and evaporation (group 2; relative humidity set at 80 percent). In both simulations, the initial δ18O is set to −32 per mill, and the initial Cl− values are set to 5 and 10 ppm (similar to that of the nearby DML firn core; Isaksson et al. Citation1996). Also shown is steady-state freezing assuming initial δ18O = −35 per mill and 1 percent mixing rate. Grey dotted lines show the evolution of δ18O-[Cl−] for freezing only of well-sealed pond (no annual recharge). Black dots with decimal numbers indicate the fraction of residual water remaining. Squares and circles indicate ponds with and without ice cover blisters, respectively.](/cms/asset/e3586a36-e326-4172-8139-3a25cfee7d65/uaar_a_2000566_f0005_oc.jpg)
Source of recharge and solutes to the ponds
The source of water recharging the ponds in Untersee Oasis can be constrained from the tritium and F14CTIC measurements. Tritium is a radionuclide (12.5-year half-life) produced naturally in the upper atmosphere with enhanced anthropogenic production during the early 1960s from nuclear testing (Clark Citation2015). Tritium was detected in five of the six ponds sampled for this analysis (1.5–11.8 TU; ); these concentrations are in the range of modern levels measured from nearby snow and ice core (5–7 TU range; Sinha et al. Citation2000; Naik et al. Citation2010). These ponds also have F14CTIC in the 0.97 to 1.0 range (), suggesting that the waters have been in contact and equilibrated with atmospheric CO2. Together, the tritium and F14CTIC measurements suggest that the ponds are recharged by modern snowmelt. This snowmelt runoff likely recharges the ponds via summer moats (for those that develop one) and/or along the edge of the lake basin (for those that maintain full ice-cover). However, P2 had a tritium concentration below detection limit (<0.8 TU) but had F14CTIC of 0.99. P2 is located along the western lateral moraine, and it is likely recharged by surface melting of tritium-free snow (i.e., residual snow along the shoreline or at higher elevation) that has dissolved modern atmospheric CO2.
Table 3. Stable water isotope (δD-δ18O) ratios, TIC, TOC, δ13CTIC, F14CTIC, and 3H composition of pond in the Untersee Oasis. See for the location of ponds
The geochemistry of the ponds supports recharge from snowmelt. The ponds have low TDS and Ca(Na)-SO4 or Na-Cl facies (). Normalizing solute concentrations to Cl− (a conservative tracer) allows removing the effects of cryo- or evapoconcentration of solutes in the ponds and comparing the values to snow and other possible sources of solutes (e.g., Marsh et al. Citation2020). Snow in Untersee Oasis was not analyzed for chemistry, but it should be similar to the geochemical record of shallow firn cores from the European Project for Ice Coring in Antarctica (EPICA) Dronning Maud Land (DML) (Isaksson et al. Citation1996). The ponds have SO4/Cl molar ratios (0.64 ± 0.33) similar to that in the nearby EPICA DMLcore (0.89 ± 0.61). In the absence of sulfate evaporites in the area, SO4 in the ponds is likely sourced from marine and/or terrestrial aerosols contributing to snowmelt (Alexander et al. Citation2003; Marsh et al. Citation2020). This is supported by the SO4/Cl ratios in the ponds that is near that of snow and the δ34SSO4 in P2 and P3 (11.4 and 11.1 per mill) that are within the range of the non–sea salt sulfate component (7.5–15.1 per mill; Alexander et al. Citation2003; Jonsell et al. Citation2005). The ponds have Na/Cl and Ca/Cl molar ratios (1.36 ± 0.81, 0.75 ± 0.31, respectively) that are higher than those in the nearby EPICA DML core (0.49 ± 0.21, 0.034 ± 0.036, respectively). Possible sources of Ca+ and Ca+ ions include dust and the weathering of plagioclase minerals in the surrounding till. A contribution from dust is ruled out because it would be present in the local snow and reflected in its chemistry. Therefore, the likely source of Na+ and Ca+ ions is derived from the weathering of local silicate minerals (Hermichen, Kowski, and Wand Citation1985; Kaup et al. Citation1988; Marsh et al. Citation2020). Plagioclase weathering simulations under closed- and open-system scenarios (for moatless and moated ponds) with the United States Geological Survey (USGS) pH redox equilibrium software (PHREEQC) yield much higher Na/Cl and Ca/Cl ratios than those measured for the ponds, regardless of the plagioclase mineral assemblage used for the simulations (Marsh et al. Citation2020). This suggests that, as for Lake Untersee, the weathering of plagioclase is a minor contributor of Ca+ and Na+ (<1 percent in the ponds). However, unlike Lake Untersee, the contribution of weathering of plagioclase minerals to the ponds could occur from the snowmelt and weathering of till material surrounding the ponds or in situ.
Fate of ice cover and evolution of δ18O and solutes
Despite all thirteen sampled ponds being recharged by snowmelt and solutes sourced from snowmelt and plagioclase weathering, the δ18O and solutes evolved differently within the ponds (i.e., Horita Citation2009). Ponds situated in regions with lower PISR (group 1) do not develop moat, and the δD-δ18O composition and solute load are affected mainly by the freezing at the bottom of the ice cover. This process leads to a depletion in δD-δ18O and enrichment of solutes and a negative relation between δ18O and [Cl−], as observed for the ponds along the western lateral moraine (). Conversely, ponds situated in regions that receive higher PISR (group 2) develop moats or completely lose their ice cover during the summer. This allows for evaporation of open water and leads to an enrichment of δD-δ18O and solutes and a positive relation between δ18O and [Cl−], as observed for the ponds along the east shoreline of Lake Untersee ().
Here, we model the evolution of δ18O and [Cl−] in the ponds in a freezing system (group 1) and an evaporative system (group 2) using FREZCH8D, which is an isotope augmented version of the FREZCHEM hydrochemical model (). The model used has subroutines that can simulate freezing (FREEZCH5) and evaporation (ISOVAP8) and their effect on solutes concentration and δD-δ18O.The modeling exercise is not meant to reproduce the values measured in the ponds, because we do not have sufficient control on key input variables for each pond, but to shed light on the extent freezing and evaporation are affecting the isotopic chemistry of the ponds. For the freezing simulation, we used the recursive FREEZCH5 submodel developed by Faucher et al. (Citation2020) and Fisher et al. (Citation2020) for moatless perennially ice-covered lakes. FREEZCH5 takes into account the changing salinity in the water column as a result of freezing and mixes the recharge water to the residual water. Under hydrological steady state, the evolution of δD-δ18O and solutes in the water column is controlled by the rate of recharge, which is determined by the sublimation rate of the surface of the ice cover (which equals the freezing rate at the bottom of the ice cover; i.e., Mckay et al. Citation1985). For the ponds, freezing was simulated assuming the ponds are under hydrological steady state with mixing rates of 5 and 50 percent, δ18O of the recharge water of −32 per mill, and Cl− of 2 and 10 ppm (similar to the nearby EPICA DML core; Isaksson et al. Citation1996). Modeling shows that isotopic equilibrium is reached after three or more residence times. The difference between initial and equilibrium δ18O values is determined by mixing, but [Cl−] would continue to progressively increase over time. The δ18O-[Cl−] composition of P1 and P4 have a good fit with that predicted under steady-state freezing system. However, P2 and P3 plot below the steady-state δ18O-[Cl−] curve, because either (1) they have not yet received summer recharge at the time of sampling or (2) they are recharged by meltwater with lower δ18O composition. The latter is the most likely scenario considering that the distribution of P2 and P3 along the freezing line only suggests that these ponds would nearly completely freeze. However, no ice blisters were observed for these two ponds.
We used the recursive ISOVAP8 model (Sofer and Gat Citation1972, Citation1975; Fisher et al. Citation2016; Lapalme et al. Citation2016) to simulate the effect of evaporation on the δ18O and [Cl−] of ponds that develop moats (group 2). However, we did not include the effect of seasonal freezing at the bottom of the ice cover. The latter is not critical given that the water–vapor fractionation factor (α18O-w-v = 1.0116 at 0°C;Majzoub Citation1971) is approximately four times larger than the water–ice fractionation factor (α18O-i-w = 1.0031; O’Neil Citation1968). For the ponds, evaporation was simulated for temperature and relative humidity in the boundary layer of 0°C and 80 percent, respectively, and the same conditions used for freezing: hydrological steady state, mixing rates of 5 and 50 percent, δ18O of the recharge water of −32 per mill, with Cl− of 2 and 10 ppm. The δ18O-[Cl−] composition of P10–P12 has a reasonable fit with that predicted under a steady-state evaporative system (). Under an evaporative system, the evolution of δ18O and solutes in the water column progressively increases, with isotopic equilibrium being reached after three or more residence times and the difference between initial and equilibrium δ18O ratios determined by the mixing rate. Our simulations demonstrate that the group 2 ponds are affected by evaporation and that this is a consequence of the higher PISR they receive during the summer months and the development of open water.
Benthic microbial activity in the ponds
The TIC and δ13CTIC in the water column of perennially ice-covered lakes have been used to assess the carbon cycling of their benthic microbial ecosystem (e.g., Wharton, Lyons, and Des Marais Citation1993; Lawson et al. Citation2004; Neumann et al. Citation2004). For example, in near-neutral pH benthic lacustrine ecosystems where abundant CO2 is available for carbon fixation by the Rubisco enzyme, photosynthetic activity preferentially utilizes 12C, producing microbial mats with depleted δ13C and leaving the residual TIC enriched in 13C (Hayes Citation1993; Lawson et al. Citation2004; Hage, Uhle, and Macko Citation2007). However, in high-pH CO2-starved ecosystems, the cyanobacteria transport HCO3− and CO32− to their cells, where carbonic anhydrase subsequently catalyzes the production of dissolved CO2 used for carbon fixation (Badger Citation1987; Hayes Citation1993). This process is nonfractionating because all of the TIC is used; Lake Untersee is an example of such a CO2-starved ecosystem, and the δ13C values of englacial meltwater, TIC in the water column, and top layer of mats are equal (Marsh et al. Citation2020).
The TIC and δ13CTIC of the snowmelt that recharges the ice-covered ponds have not been determined because snowmelt was absent during our field campaigns. Snowmelt flowing over plagioclase material should have TIC and δ13CTIC in near equilibrium with atmospheric CO2: [TIC] of 1.2–1.5 ppm C and δ13CTIC approximately −6.8 per mill (assuming a pH of 5.6 for atmospherically equilibrated waters, δ13CCO2 of −8 per mill, and a CO2 (gas)–CO2 (aqueous) fractionation factor of 1.0012 at 0°C; Clark Citation2015). However, the ponds have higher pH (7–10), [TIC] (>1.5 ppm C), and lower δ13C (−18.0 to −1.9 per mill; ). Although the soils around the ponds are largely deprived of organic matter (Shamilishvili, Abakumov, and Andersen Citation2020), the ponds, especially those that develop moat, are frequently visited by snow petrels that leave organic material. The TOC in the ponds is in the 1.2 to 12.6 ppm C range and is much higher than that in Lake Untersee (~0.3 ppm C), with low δ13CTOC values (<–15 per mill, except P2 and P3; ). Steele (Citation2005) found that the δ13C of the snow petrels’ humeri bone collagen ranged between −24.7 and −22.9 per mill, which is in the range of the δ13CTOC in most ponds (). The decomposition of TOC would provide additional TIC and produce δ13CTIC with a value similar to the δ13CTOC (e.g., Lawson et al. Citation2004). Assuming that the TIC in the ponds is sourced mainly from TOC oxidation, the higher δ13CTIC over δ13CTOC suggests that, unlike Lake Untersee, the benthic microbial mats of most ponds are not CO2-starved (). The maximum carbon fractionation factor of cyanobacteria ranges between 1.018 and 1.023 (Calder and Parker Citation1973; Pardue et al. Citation1976), which is slightly higher than the difference between δ13CTIC over δ13CTOC (5–15 per mill higher). P2 and P3 have well-sealed ice covers with pH, [TIC], [TOC], and TIC/Cl similar to Lake Untersee but with higher δ13CTIC and δ13CTOC values (). These two ponds are recharged by snowmelt likely with [TIC] near 1.5 ppm C and δ13CTIC near −6.8 per mill, and photosynthesis uptake of CO2 could decrease the TIC and increase δ13CTIC; if that is the case, photosynthesis activity appears to be restricted compared to the other ponds given the more minor difference between the predicted input and measured pond water columns’ δ13CTIC.
Figure 6. Scatterplots of relation between (a) TIC and δ13CTIC; (b) TOC and δ13CTOC; (c) TIC/Cl (molar ratio) and δ13CTIC, including data from MDV lakes (Neumann et al. Citation2004); and (d) δ13CTOC and δ13CTIC of ponds in the Untersee Oasis.
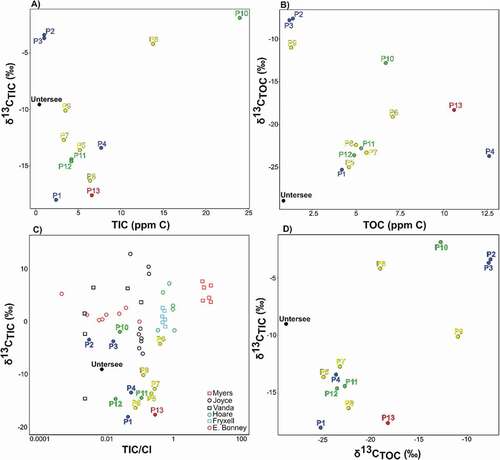
Overall, it appears that most ponds host a benthic microbial ecosystem that is not CO2 limited. The range in TIC/Cl in the ponds is similar to that of perennially ice-covered lakes in the MDV. However, the δ13CTIC values are much lower in the ponds in Untersee Oasis. This would suggest that the source of TIC is different, mainly sourced from oxidation of TOC in the ponds. In the MDV, the lakes are recharged by glacial meltwater rivers where they can source TIC from the dissolution of atmospheric CO2. Carbonate dissolution with δ13C near 0 per mill is also a source of TIC to these MDV lakes. Conversely, Untersee Oasis lacks rivers and snowmelt directly entering the ponds.
Climate change and trajectory of ponds
The mean annual air temperature (MAAT) in Antarctica’s Queen Maud Land region has increased at a rate of 1.1 ± 0.7°C per decade between 1998 and 2016 (Medley et al. Citation2018), but it has remained stable in Untersee Oasis since the early 1960s (Turner et al. Citation2004; Andersen, McKay, and Lagun Citation2015). However, the MAAT in the Oasis is likely to increase in the coming decades due to climate change. This should result in a shift in ice cover phenology (e.g., Obryk, Doran, and Priscu Citation2019). Untersee Oasis hosts the full range of ice-covered ponds, ranging from moatless perennially ice-covered (e.g., lakes Untersee and Obersee and ponds situated along the west lateral moraine) to perennially ice-covered forming moats (e.g., terminal and east lateral moraine ponds) and some seasonally ice-covered ponds (e.g., along the east shoreline of Lake Untersee). Therefore, the data from this study can be used to inform the trajectory of the chemical and biological properties of ponds in the Untersee Oasis under a warming climate and associated shift in ice cover phenology.
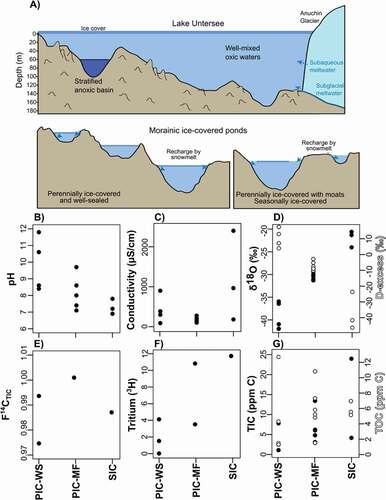
A shift from moatless perennially ice-covered ponds to seasonally ice-covered ponds may not cause a change in the source of recharge unless supraglacial streams start to form on the Anuchin Glacier; the radiocarbon and tritium levels in all the ponds have similar values since they are all recharged by atmospheric CO2 equilibrated snowmelt. However, a decreased ice cover extent would cause an increase in TDS and δ18O composition because both parameters are negatively correlated with persistence of the ice cover (). This is expected because TDS and δ18O values of the water should increase as evaporation concentrates the ions in the pond and enriches δ18O (). Finally, a shift from moatless perennially ice-covered ponds to seasonally ice-covered ponds may cause a decrease in pH but an increase in TIC and TOC load, a consequence of increased interactions with the atmosphere (i.e., uptake of CO2) and input of allochthonous organics likely derived from the snow petrels. This would shift the CO2-starved benthic microbial ecosystem of moatless perennially ice-covered lakes to one where CO2 availability is not limiting photosynthesis.
Figure 7. (a) Cross-sectional view of the perennially ice-covered Lake Untersee and the ponds in the Untersee Oasis with their differing ice cover types (i.e., from well-sealed perennial ice cover to moat-forming perennial ice cover and seasonal ice cover). Panels (b-g) indicate the pH, conductivity (uS/cm-1), δ18O, F14CTIC, Tritium (3H), and TIC (ppm C) values of near-surface waters in the ponds as a function of ice cover type. PIC-WS = perennially ice-covered and well-sealed; PIC-MF = perennially ice-covered and moat-forming; SIC = seasonally ice-covered.
Concluding remarks
Untersee Oasis lacks surface streams but currently hosts about thirty-nine freshwater lacustrine basins with moatless perennial ice covers to seasonal ice covers. Our findings suggest that an increase in insolation (or air temperatures) would result in a shift in ice cover phenology. A reduced ice cover would lead to enhanced interactions between the water column of the ponds and the atmosphere and increased inputs of allochthonous carbon (likely from snow petrels); however, unless supraglacial streams begin to form, the source of water recharging the ponds would remain largely unchanged. Therefore, the empirical data allow estimating the trajectory of the hydrochemistry and microbial activity properties of ponds in the Oasis as they evolve in a changing climate.
Authors’ contributions
B. Faucher: Paper writing (main contributor); data collection; data analysis and interpretation; editing prior to submission. D. Lacelle: Paper writing; data collection; data analysis and interpretation; editing prior to submission. N. B. Marsh: Data collection; data analysis and interpretation. D. A. Fisher: Model development; data analysis and interpretation; editing prior to submission. D. T. Andersen: Data collection; data analysis and interpretation; editing prior to submission.
Acknowledgments
We thank the two reviewers for providing constructive comments on the article.
Disclosure statement
No potential conflict of interest was reported by the authors.
Additional information
Funding
References
- Alexander, B., M. H. Thiemens, J. Farquhar, A. J. Kaufman, J. Savarino, and R. J. Delmas. 2003. East Antarctic ice core sulfur isotope measurements over a complete glacial–interglacial cycle. Journal of Geophysical Research: Atmospheres 108. doi:https://doi.org/10.1029/2003JD003513.
- Andersen, D. T., C. P. McKay, and V. Lagun. 2015. Climate conditions at perennially ice-covered Lake Untersee, East Antarctica. Journal of Applied Meteorology and Climatology 54 (7):1393–412. doi:https://doi.org/10.1175/JAMC-D-14-0251.1.
- Badgeley, J. A., E. C. Pettit, C. G. Carr, S. Tulaczyk, J. A. Mikucki, and W. B. Lyons. 2017. An englacial hydrologic system of brine within a cold glacier: Blood Falls, McMurdo Dry Valleys, Antarctica. Journal of Glaciology 63 (239):387–400. doi:https://doi.org/10.1017/jog.2017.16.
- Badger, M. R. 1987. The CO2 concentrating mechanism in aquatic phototrophs. In The Biochemistry of Plants: A Comprehensive Treatise. Vol. 10: Photosynthesis, ed. M. D. Hatch and N. K. Boardman, 219–274. New York: Academic Press.
- Begin, P. N., Y. Tanabe, M. Rautio, M. Wauthy, I. Laurion, M. Uchida, A. I. Culley, and W. F. Vincent. 2021. Water column gradients beneath the summer ice of a high Arctic freshwater lake as indicators of sensitivity to climate change. Scientific Reports 11 (1):2868. https://doi.org/https://doi.org/10.1038/s41598-021-82234-z
- Bindschadler, R., P. Vornberger, A. Fleming, A. Fox, J. Mullins, D. Binnie, S. Paulsen, B. Granneman, and D. Gorodetzky. 2008. The Landsat image mosaic of Antarctica. Remote Sensing of Environment 112 (12):4214–26. doi:https://doi.org/10.1016/j.rse.2008.07.006.
- Bormann, P., P. Bankwitz, E. Bankwitz, V. Damm, E. Hurtig, H. Kämpf, M. Menning, H.-J. Paech, U. Schäfer, and W. Stackebrandt. 1986. Structure and development of the passive continental marging across the Princess Astrid coast, East Antarctica. Journal of Geodynamics 373:347–73. doi:https://doi.org/10.1016/0264-3707(86)90049-9.
- Calder, J. A., and P. L. Parker. 1973. Geochemical implications of induced changes in C13 fractionation by blue-green algae. Geochimica et Cosmochimica Acta 37 (1):133–40. doi:https://doi.org/10.1016/0016-7037(73)90251-2.
- Clark, I. 2015. Groundwater geochemistry and isotopes. doi:https://doi.org/10.1201/b18347.
- Crann, C. A., S. Murseli, G. St-Jean, X. Zhao, I. D. Clark, and W. E. Kieser. 2017. First status report on radiocarbon sample preparation techniques at the A.E. Lalonde AMS Laboratory (Ottawa, Canada). Radiocarbon 59 (3):695–704. doi:https://doi.org/10.1017/RDC.2016.55.
- Dansgaard, W. 1964. Stable isotopes in precipitation. Tellus 16:436–68. doi:https://doi.org/10.3402/tellusa.v16i4.8993.
- Doran, P. T., J. C. Priscu, W. B. Lyons, R. D. Powell, D. T. Andersen, R. J. Poreda. 2004. Paleolimnology of extremely cold terrestrial and extraterrestrial environments. In Long-term environmental change in Arctic and Antarctic lakes, ed. R. Pienitz, M. S. V. Douglas, and J. Smol, 475–508. Dordrecht: Springer.
- Dore, J. E., and J. C. Priscu. 2001. Phytoplankton phosphorus deficiency and alkaline phosphatase activity in the McMurdo Dry Valley lakes, Antarctica. Limnology and Oceanography 46 (6):1331–46. doi:https://doi.org/10.4319/lo.2001.46.6.1331.
- Echeverría, S., M. B. Hausner, N. Bambach, S. Vicuña, and F. Suárez. 2019. Modeling present and future ice covers in two Antarctic lakes. Journal of Glaciology 66:11–24. doi:https://doi.org/10.1017/jog.2019.78.
- Faucher, B., D. Lacelle, D. A. Fisher, D. T. Andersen, and C. P. McKay. 2019. Energy and water mass balance of Lake Untersee and its perennial ice cover, East Antarctica. Antarctic Science 31 (5):271–85. doi:https://doi.org/10.1017/S0954102019000270.
- Faucher, B., D. Lacelle, D. A. Fisher, K. Weisleitner, and D. T. Andersen. 2020. Modeling δD-δ18O steady-state of well-sealed perennially ice-covered lakes and their recharge source: Examples from Lake Untersee and Lake Vostok, Antarctica. Frontiers in Earth Science 8. doi:https://doi.org/10.3389/feart.2020.00220.
- Fernandoy, F., H. Meyer, H. Oerter, F. Wilhelms, W. Graf, and J. Schwander. 2010. Temporal and spatial variation of stable-isotope ratios and accumulation rates in the hinterland of Neumayer station, East Antarctica. Journal of Glaciology 56 (198):673–87. doi:https://doi.org/10.3189/002214310793146296.
- Fisher, D. A., D. Lacelle, W. Pollard, A. Davila, and C. P. McKay. 2016. Ground surface temperature and humidity, ground temperature cycles and the ice table depths in University Valley, McMurdo Dry Valleys of Antarctica. Journal of Geophysical Research: Earth Surface 121 (11):2069–84. doi:https://doi.org/10.1002/2016JF004054.
- Fisher, D. A., D. Lacelle, W. Pollard, and B. Faucher. 2020. A model for stable isotopes of residual liquid water and ground ice in permafrost soils using arbitrary water chemistries and soil-specific empirical residual water functions. Permafrost and Periglacial Processes 1–13. doi:https://doi.org/10.1002/ppp.2079.
- Fountain, A. G., G. Saba, B. Adams, P. Doran, W. Fraser, M. Gooseff, M. Obryk, J. C. Priscu, S. Stammerjohn, and R. A. Virginia. 2016. The impact of a large-scale climate event on Antarctic ecosystem processes. Bioscience 66 (10):848–63. doi:https://doi.org/10.1093/biosci/biw110.
- Fountain, A. G., J. C. Fernandez-Diaz, M. Obryk, J. Levy, M. Gooseff, D. J. Van Horn, P. Morin, and R. Shrestha. 2017. High-resolution elevation mapping of the McMurdo Dry Valleys, Antarctica, and surrounding regions. Earth System Science Data 9 (2):435–43. doi:https://doi.org/10.5194/essd-9-435-2017.
- Gooseff, M. N., J. E. Barrett, B. J. Adams, P. T. Doran, A. G. Fountain, W. B. Lyons, D. M. McKnight, J. C. Priscu, E. R. Sokol, C. Takacs-Vesbach, et al. 2017. Decadal ecosystem response to an anomalous melt season in a polar desert in Antarctica. Nature Ecology & Evolution 1 (9):1334–38. doi:https://doi.org/10.1038/s41559-017-0253-0.
- Guglielmin, M., A. G. Lewkowicz, H. M. French, and A. Strini. 2009. Lake-ice blisters, terra nova bay area, Northern Victoria Land, Antarctica. Geografiska Annaler: Series A, Physical Geography 91 (2):99–111. doi:https://doi.org/10.1111/j.1468-0459.2009.00357.x.
- Haendel, D., W.-D. Hermichen, R. Höfling, and P. Kowski. 2011. Hydrology of the lakes in Central Wohlthat Massif, East Antarctica: New results. Isotopes in Environmental and Health Studies 47 (4):402–06. doi:https://doi.org/10.1080/10256016.2011.630464.
- Hage, M. M., M. E. Uhle, and S. Macko. 2007. Biomarker and stable isotope characterization of coastal pond-derived organic matter, McMurdo Dry Valleys, Antarctica. Astrobiology 7:645–61. doi:https://doi.org/10.1089/ast.2006.0033.
- Hayes, J. M. 1993. Factors controlling 13C contents of sedimentary organic compounds: Principles and evidence. Marine Geology 113 (1–2):111–25. doi:https://doi.org/10.1016/0025-3227(93)90153-M.
- Hermichen, W. D., P. Kowski, and U. Wand. 1985. Lake Untersee, a first isotope study of the largest freshwater lake in the interior of East Antarctica. Nature 315:131–33. doi:https://doi.org/10.1038/315131a0.
- Hiller, A., U. Wand, H. Kämpf, and W. Stackebrandt. 1988. Occupation of the Antarctic continent by petrels during the past 35 000 years: Inferences from a 14C study of stomach oil deposits. Polar Biology 9:69–77. doi:https://doi.org/10.1007/BF00442032.
- Hoffman, M. J., A. G. Fountain, and G. E. Liston. 2008. Surface energy balance and melt thresholds over 11 years at Taylor Glacier, Antarctica. Journal of Geophysical Research 113 (F4):1–12. doi:https://doi.org/10.1029/2008JF001029.
- Horita, J. 2009. Isotopic evolution of saline lakes in the low-latitude and polar regions. Aquatic Geochemistry 4:3–69. doi:https://doi.org/10.1007/s10498-008-9050-3.
- Howat, I. M., C. Porter, B. E. Smith, M.-J. Noh, and P. Morin. 2019. The reference elevation model of Antarctica. The Cryosphere 13 (2):665–74. doi:https://doi.org/10.5194/tc-13-665-2019.
- Isaksson, E., W. Karlén, N. Gundestrup, P. Mayewski, S. Whitlow, and M. Twickler. 1996. A century of accumulation and temperature changes in Dronning Maud Land, Antarctica. Journal of Geophysical Research: Atmospheres 101 (D3):7085–94. doi:https://doi.org/10.1029/95JD03232.
- Jonsell, U., M. E. Hansson, C. M. Morth, and P. Torssander. 2005. Sulfur isotopic signals in two shallow ice cores from Dronning Maud Land, Antarctica. Tellus Series B: Chemical and Physical Meteorology 57:341–50. doi:https://doi.org/10.3402/tellusb.v57i4.16558.
- Kampf, H., and W. Stakerbrandt. 1985. Geological investigation in the Eliseev anorthosite massif, central Dronning Maud Land, East Antarctica. Zeitschrift für Geologische Wissenschaften 13:32–60.
- Kaup, E., A. Loopmann, V. Klokov, I. Simonov, D. Haen-Del. 1988. Limnological investigations in the Untersee Oasis. In Limnological studies in Queen Maud Land (East Antarctica)ed. J. Martin, 28–42. Valgus: Tallinn.
- Lapalme, C., D. Lacelle, W. Pollard, D. Fisher, A. Davila, and C. P. Mckay. 2016. Distribution and origin of ground ice in University Valley, McMurdo Dry Valleys, Antarctica. Antarctic Science 29:183–98. doi:https://doi.org/10.1017/S0954102016000572.
- Lawrence, J. P., P. T. Doran, L. A. Winslow, and J. C. Priscu. 2020. Subglacial brine flow and wind-induced internal waves in Lake Bonney, Antarctica. Antarctic Science 32 (3):223–37. doi:https://doi.org/10.1017/S0954102020000036.
- Lawson, J., P. T. Doran, F. Kenig, D. J. Des Marais, and J. C. Priscu. 2004. Stable carbon and nitrogen isotopic composition of benthic and pelagic organic matter in lakes of the McMurdo Dry Valleys, Antarctica. Aquatic Geochemistry 10 (3–4):269–301. doi:https://doi.org/10.1007/s10498-004-2262-2.
- Lehnherr, I., V. L. St. Louis, M. Sharp, A. S. Gardner, J. P. Smol, S. L. Schiff, D. C. G. Muir, C. A. Mortimer, N. Michelutti, C. Tarnocai, et al. 2018. The world’s largest high Arctic lake responds rapidly to climate warming. Nature Communications 9 (1):1–9. doi:https://doi.org/10.1038/s41467-018-03685-z.
- Lyons, W. B., K. A. Welch, C. B. Gardner, C. Jaros, D. L. Moorhead, J. L. Knoepfle, and P. T. Doran. 2012. The geochemistry of upland ponds, Taylor Valley, Antarctica. Antarctic Science 24 (1):3–14. doi:https://doi.org/10.1017/S0954102011000617.
- Majzoub, M. 1971. Fractionnement en oxygen-18 et deuterium entre l’eau et sa vapeu. Journal de Chimie Physique 68:563–68.
- Marsh, N. B., D. Lacelle, B. Faucher, S. Cotroneo, L. Jasperse, I. D. Clark, and D. T. Andersen. 2020. Sources of solutes and carbon cycling in perennially ice-covered Lake Untersee, Antarctica. Scientific Reports 10 (1):1–12. doi:https://doi.org/10.1038/s41598-020-69116-6.
- Matsubaya, O., H. Sakai, T. Tori, H. Burton, and K. Kerry. 1978. Antarctic saline lakes-stable isotopic ratios, chemical compositions and evolution. Geochimica et Cosmochimica Acta 43:7–25. doi:https://doi.org/10.1016/0016-7037(79)90042-5.
- Matsumoto, G. I., S. Nakaya, H. Murayama, N. Masuda, T. Kawano, K. Watanuki, and T. Torii. 1992. Geochemical characteristics of Antarctic lakes and ponds. Proceedings of the NIPR Symposium on Polar Biology 5:125–45.
- Mckay, C. P., G. D. Clow, R. A. Wharton, and S. W. Squyres. 1985. Thickness of ice on perennially frozen lakes. Nature 313:561–62. doi:https://doi.org/10.1038/313561a0.
- Medley, B., J. R. McConnell, T. A. Neumann, C. H. Reijmer, N. Chellman, M. Sigl, and S. Kipfstuhl. 2018. Temperature and snowfall in western Queen Maud Land increasing faster than climate model projections. Geophysical Research Letters 45 (3):1472–80. doi:https://doi.org/10.1002/2017GL075992.
- Mikucki, J. A., E. Auken, S. Tulaczyk, R. A. Virginia, C. Schamper, K. I. Sørensen, P. T. Doran, H. Dugan, and N. Foley. 2015. Deep groundwater and potential subsurface habitats beneath an Antarctic dry valley. Nature. doi:https://doi.org/10.1038/ncomms7831.
- Mueller, D. R., P. Van Hove, D. Antoniades, M. O. Jeffries, and W. F. Vincent. 2009. High Arctic lakes as sentinel ecosystems: Cascading regime shifts in climate, ice cover, and mixing. Limnology and Oceanography 54 (6part2):2371–85. doi:https://doi.org/10.4319/lo.2009.54.6_part_2.2371.
- Murseli, S., P. Middlestead, G. St-Jean, X. Zhao, C. Jean, C. A. Crann, W. E. Kieser, and I. D. Clark. 2019. The preparation of water (DIC, DOC) and gas (CO2, CH4) samples for radiocarbon analysis at AEL-AMS, Ottawa, Canada. Radiocarbon 61:1563–71. doi:https://doi.org/10.1017/RDC.2019.14.
- Naik, S. S., M. Thamban, C. M. Laluraj, B. L. Redkar, and A. Chaturvedi. 2010. A century of climate variability in central Dronning Maud Land, East Antarctica, and its relation to Southern annular mode and El Nio-Southern oscillation. Journal of Geophysical Research 115:1–12. doi:https://doi.org/10.1029/2009JD013268.
- Neumann, K., W. B. Lyons, J. C. Priscu, D. J. Desmarais, and K. A. Welch. 2004. The carbon isotopic composition of dissolved inorganic carbon in perennially ice-covered Antarctic lakes: Searching for a biogenic signature. Annals of Glaciology 39:518–24. doi:https://doi.org/10.3189/172756404781814465.
- O’Neil, J. R. 1968. Hydrogen and oxygen isotope fractionation between ice and water. The Journal of Physical Chemistry 72 (10):3683–84. doi:https://doi.org/10.1021/j100856a060.
- Obryk, M. K., P. T. Doran, A. S. Friedlaender, M. N. Gooseff, W. Li, R. M. Morgan-Kiss, J. C. Priscu, O. Schofield, S. E. Stammerjohn, D. K. Steinberg, et al. 2016. Responses of Antarctic marine and freshwater ecosystems to changing ice conditions. Bioscience 66 (10):864–79. doi:https://doi.org/10.1093/biosci/biw109.
- Obryk, M. K., P. T. Doran, and J. C. Priscu. 2019. Prediction of ice‐free conditions for a perennially ice‐covered Antarctic lake. Journal of Geophysical Research: Earth Surface 124:686–94. doi:https://doi.org/10.1029/2018JF004756.
- Paech, H.-J., W. Stackebrandt. 1995. Geology. In The Schirmacher Oasis, Queen Maud Land, East Antarctica and its surroundings, ed. P. Bormann and D. Fritzsche, 59–159. Gotha: Justus Perthes.
- Pardue, J. W., R. S. Scalan, C. Van Baalen, and P. L. Parker. 1976. Maximum carbon isotope fractionation in photosynthesis by blue-green algae and a green alga. Geochimica et Cosmochimica Acta 40 (3):309–12. doi:https://doi.org/10.1016/0016-7037(76)90208-8.
- Petrov, M. P., A. Y. Terzhevik, N. I. Palshin, R. E. Zdorovennov, and G. E. Zdorovennova. 2005. Absorption of solar radiation by snow-and-ice cover of lakes. Water Resources 32:546–54.
- Ponti, S., R. Scipinotti, S. Pierattini, and M. Guglielmin. 2021. The spatio-temporal variability of frost blisters in a perennial frozen lake along the Antarctic coast as indicator of the groundwater supply. Remote Sensing 13 (3):435. doi:https://doi.org/10.3390/rs13030435.
- Priscu, J. C., and C. M. Foreman. 2009. Lakes of Antarctica. In Encyclopedia of inland waters, vol. 2, ed. G. E. Likens, 555–66. Amsterdam: Academic Press.
- Priscu, J. C. 1995. Phytoplankton nutrient deficiency in lakes of the McMurdo Dry Valleys, Antarctica. Freshwater Biology 34 (2):215–27. doi:https://doi.org/10.1111/j.1365-2427.1995.tb00882.x.
- Schwab, M. J. 1998. Reconstruction of the late quaternary climatic and environmental history of the Schirmacher Oasis and the Wohlthat Massif (East Antarctica). Bremerhaven: Alfred Wegener Institute for Polar and Marine Research.
- Shamilishvili, G., E. V. Abakumov, and D. T. Andersen. 2020. Biogenic-abiogenic interactions and soil formation in extreme conditions of Untersee Oasis, surroundings of Lake Untersee, central Queen Maud Land, East Antarctica. In Processes and Phenomena on the Boundary Between Biogenic and Abiogenic Nature. Lecture Notes in Earth System Sciences, vol. 1, ed. O. Frank-Kamenetskaya, D. Vlasov, E. Panova, and S. Lessovaia, 457–79. Cham: Springer.
- Sinha, R., S. V. Navada, A. Chatterjee, S. Kumar, A. Mitra, and A. R. Nair. 2000. Hydrogen and oxygen isotopes analysis of Antarctic lake waters, Schirmacher Oasis, East Antarctica. Current Science 78:992–95.
- Sofer, Z., and J. R. Gat. 1972. Activities and concentrations of oxygen-18 in concentrated aqueous salt solutions: Analytical and geophysical implications. Earth and Planetary Science Letters 15 (3):232–38. doi:https://doi.org/10.1016/0012-821X(72)90168-9.
- Sofer, Z., and J. R. Gat. 1975. The isotopic compositions of evaporating brines: Effect of the isotopic acitivity ratio in saline solutions. Earth and Planetary Science Letters 26:179–86. doi:https://doi.org/10.1016/0012-821X(75)90085-0.
- St-Jean, G. 2003. Automated quantitative and isotopic (13C) analysis of dissolved inorganic carbon and dissolved organic carbon in continuous-flow using a total organic carbon analyser. Rapid Communications in Mass Spectrometry 17:419–28. doi:https://doi.org/10.1002/rcm.926.
- Steele, W. K. 2005. Stable isotope ratios of Antarctic petrel (Thalassoica Antarctica) and snow petrel (Pagodroma nivea) bone collagen. Polar Biology 28 (9):672–79. doi:https://doi.org/10.1007/s00300-005-0736-3.
- Stuiver, M., and H. A. Polach. 1977. Reporting of 14C data. Radiocarbon 19:355–63. doi:https://doi.org/10.1016/j.forsciint.2010.11.013.
- Turner, J., S. R. Colwell, G. J. Marshall, T. A. Lachlan-Cope, A. M. Carleton, P. D. Jones, V. Lagun, P. A. Reid, and S. Iagovkina. 2004. The SCAR READER project: Toward a high-quality database of mean Antarctic meteorological observations. Journal of Climate 17 (14):2890–98. doi:https://doi.org/10.1175/1520-0442(2004)017<2890:TSRPTA>2.0.CO;2.
- Vincent, A. C., D. R. Mueller, and W. F. Vincent. 2008. Simulated heat storage in a perennially ice-covered high Arctic lake: Sensitivity to climate change. Journal of Geophysical Research 113 (C4):1–11. doi:https://doi.org/10.1029/2007JC004360.
- Vincent, W. F., J. E. Hobbie, J. Laybourn-Parry. 2008. Introduction to the limnology of high-latitude lake and river ecosystems. In Polar lakes and rivers: Limnology of Arctic and Antarctic aquatic ecosystems, ed. W. F. Vincent and J. Laybourn-Parry, 1–23. Oxford: Oxford University Press.
- Weisleitner, K., A. K. Perras, S. H. Unterberger, C. Moissl-Eichinger, D. T. Andersen, and B. Sattler. 2020. Cryoconite hole location in East-Antarctic Untersee Oasis shapes physical and biological diversity. Frontiers in Microbiology 11:1–21. doi:https://doi.org/10.3389/fmicb.2020.01165.
- Weisleitner, K., A. Perras, C. Moissl-Eichinger, D. T. Andersen, and B. Sattler. 2019. Source environments of the microbiome in perennially ice-covered Lake Untersee, Antarctica. Frontiers in Microbiology 10:1–18.
- Wharton, R. A., W. B. Lyons, and D. J. Des Marais. 1993. Stable isotopic biogeochemistry of carbon and nitrogen in a perennially ice-covered Antarctic lake. Chemical Geology 107:159–72.