
 ?Mathematical formulae have been encoded as MathML and are displayed in this HTML version using MathJax in order to improve their display. Uncheck the box to turn MathJax off. This feature requires Javascript. Click on a formula to zoom.
ABSTRACT
It is important to develop a convenient method for predicting photosynthetic rates in cold regions such as high elevations. Dwarf pine Pinus pumila is a representative treeline species in Japan. In this study, we investigated how environmental factors affect diurnal and seasonal variations of the in situ photosynthetic rate of P. pumila. Five environmental factors (photosynthetic photon flux density [PPFD], air temperature [Ta], soil temperature [Ts], vapor pressure deficit [VPD], and soil water content [SWC]) were examined. Photosynthetic measurements were conducted for four needle ages at hourly intervals on fifteen days from July to October 2018. The net photosynthetic rate decreased with needle age and changed seasonally and diurnally for each needle age. The net photosynthetic rate showed unimodal patterns with Ta, Ts, and SWC. The seasonal and diurnal changes in the net photosynthetic rate were related to seasonal changes in the four environmental factors (PPFD, Ta, Ts, SWC); the net photosynthetic rate decreased in mid-summer when Ta, Ts, and PPFD were high due to a decrease in SWC. Seasonal and diurnal changes in net photosynthetic rates could be reproduced by the multiplicative model of the four environmental factors and needle age. Therefore, the photosynthetic rate of P. pumila can be explained and predicted using these environmental factors and needle age. This information will be useful for predicting the effects of climate change on the photosynthetic production of plants in cold regions.
Introduction
The Intergovernmental Panel on Climate Change (Citation2013) reported that the mean global air temperature increased by 0.12°C per decade from 1951 to 2012 and predicted that the mean annual air temperature between 2081 and 2100 will be up to 4.8°C higher than that during 1986 to 2005. Air temperature affects plant growth and distribution by altering physiological traits, such as photosynthesis and respiration (Sage and Kubien Citation2007; Ganjurjav et al. Citation2015; Hu et al. Citation2016). In general, climate change is expected to increase both photosynthesis and respiration (Wu, Su, and Jiang Citation2011); however, the degree of change varies between ecosystems (Oberbauer et al. Citation2007; Craine et al. Citation2011). In colder regions, the correlation between plant growth and summer temperatures is stronger (King et al. Citation2013; Y. Zhang et al. Citation2014; Jørgensen et al. Citation2015). Therefore, climate change is expected to increase plant growth and photosynthetic production in cold regions (Takahashi and Okuhara Citation2013; Reyer et al. Citation2014; Sánchez-Salguero et al. Citation2017; Kellomäki et al. Citation2018).
The photosynthetic rates of plants change seasonally and diurnally in response to climate conditions. Photosynthesis is a temperature-dependent process, and the optimal air temperature for photosynthesis (Ta•opt) varies among species and individuals (Farquhar, Von Caemmerer, and Berry Citation1980). Photosynthesis temperature dependence is the result of physiological acclimation because Ta•opt is lower for individual plants growing in colder environments (Wieser et al. Citation2010; Zaka et al. Citation2016). Soil temperature affects stomatal conductance and transpiration (Foster and Smith Citation1991; Cochard et al. Citation2000; Mellander, Bishop, and Lundmark Citation2004), which further influences photosynthetic rates through stomatal control (DeLucia, Day, and Öquist Citation1991). Vapor pressure deficit (VPD) and soil water content (SWC) also affect photosynthesis and stomatal closure (Francey and Farquhar Citation1982; Granier and Bréda Citation1996; Reich et al. Citation2018). For example, the photosynthetic rate of black spruce decreases with low SWC due to stomatal closure (Major and Johnsen Citation1996). Midday depressions in photosynthesis are often observed due to reduced stomatal conductance and relative humidity and increased temperature and VPD (S. B. Zhang et al. Citation2005). In addition, the assimilative capacity or maximum photosynthetic rate of plants generally decreases with leaf age because of decreases in leaf nitrogen concentration (Reich, Walters, and Ellsworth Citation1992; Suzuki and Takahashi Citation2020). Therefore, it is important to examine how climatic conditions affect seasonal and diurnal variations in the photosynthetic rates of leaves of different ages to accurately determine the effects of climate change on the photosynthetic production of plants in cold regions.
Many photosynthesis studies employ biochemical models (Farquhar, Von Caemmerer, and Berry Citation1980; Kattge and Knorr Citation2007; Sharkey et al. Citation2007; Bellasio and Farquhar Citation2019); however, biochemical models are complex and difficult to apply in field studies, especially in cold regions and at high elevations where measuring in situ photosynthetic rates can be challenging. Alternatively, annual or long-term photosynthetic production can be estimated using empirical photosynthesis models as functions of environmental factors (e.g., light, temperature, VPD) and leaf traits (e.g., leaf mass per area, leaf age; Peri et al. Citation2002; Liu, Xie, and Li Citation2019). Therefore, developing empirical models will facilitate evaluations of the effects of climate change on the photosynthetic production of plants in cold regions.
Pinus pumila Regel is a dwarf pine distributed in the uppermost subalpine zone in central Japan, forming the treeline (Okitsu and Ito Citation1984; Miyajima, Sato, and Takahashi Citation2007; Ohdo and Takahashi Citation2020). It is well known that the annual shoot elongation rate of P. pumila is positively correlated with the summer temperatures of the previous year (Takahashi Citation2006). Therefore, increases in summer temperatures are expected to increase the photosynthetic production of P. pumila. Although Ishida et al. (Citation2001) investigated diurnal changes in the in situ photosynthetic rates of P. pumila on three days, diurnal and seasonal changes over an entire growing season have not been determined. The present study investigated diurnal and seasonal variations in the in situ photosynthetic rate of P. pumila to reveal the effects of environmental factors (light, air and soil temperatures, SWC, and VPD) on photosynthetic production. The purpose of the study was to determine whether diurnal and seasonal variations in the in situ photosynthetic rate of P. pumila can be explained by environmental factors and needle age. This information will be useful for predicting the effects of climate change on photosynthetic production in cold regions.
Methods
Study site
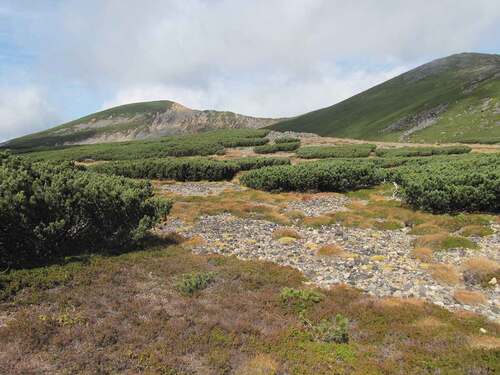
This study was conducted at a P. pumila krummholz (2,770 m.a.s.l., 36°06′ N, 137°33′ E) on Mount Norikura (summit elevation 3,026 m.a.s.l.) in central Japan in 2018 (). The krummholz height was about 1 m (Takahashi and Yoshida Citation2009). The P. pumila krummholz was distributed in a vast area, so the study site is a representative area of this species. Empetrum nigrum var. japonicum was also distributed in the area. The plant height of E. nigrum var. japonicum was only several centimeters. In 2018, mean monthly temperatures of the coldest month (February) and the hottest month (July) were −15.0°C and 13.1°C, respectively, and the mean annual temperature was −0.48°C at the study site, according to Agro-Meteorological Grid Square Data (AMGSD), National Agricultural Research Organization (Ohno et al. Citation2016; Kominami, Sasaki, and Ohno Citation2019; 1 × 1 km resolution; https://amu.rd.naro.go.jp). An air temperature of 5.0°C is often used as a threshold for the growing season of plants (Flanagan and Syed Citation2011; Weijers et al. Citation2013); the mean monthly temperature at the study site exceeded 5.0°C between June and September in 2018. However, snow covered the forest floor until mid- to late June.
Figure 1. A photo of the study site (2,770 m.a.s.l.). Dwarf pine Pinus pumila is distributed in the vast area near the top of Mount Norikura (summit elevation 3,026 m.a.s.l.) in central Japan.
Photosynthetic measurements
Photosynthetic measurements were performed at weekly intervals from early July to late October for a total of fifteen days. Photosynthetic rates were measured hourly from early morning to late afternoon on each measurement day. However, from summer to autumn, the start of the measurement was delayed and the end time was earlier. The measurement time was shortened due to bad weather and logistic problems on eight of fifteen days.
The maximum longevity of P. pumila needles is five years. However, most four- and five-year-old needles in the study area had fallen, so we measured the net photosynthetic rate of current, one-, two-, and three-year-old needles (Appendix 1; Figure S1). Measurements began in July for one- to three-year-old needles and in August for current year needles because current year needles were immature in July. Net photosynthetic rates (Pn) and stomatal conductance (gs) were measured using a portable photosynthesis system (model LI-6400; LI-COR Biosciences, Lincoln, NE) equipped with a standard 2 × 3 cm chamber under natural conditions of light intensity, air temperature, relative humidity, and carbon dioxide concentration in ambient air. The soda lime and desiccant columns were bypassed. Air temperature (Ta), carbon dioxide concentration, relative humidity, and VPD in the chamber and photosynthetic photon flux density (PPFD) beside the chamber were measured simultaneously with each photosynthetic measurement. Carbon dioxide concentration ranged between 370 and 430 ppm for each measurement day.
P. pumila has five needles per fascicle, and the needle length ranges between 3 and 7 cm (Kajimoto Citation1993). Five needles of a fascicle were used to measure the photosynthetic rate at each hour for each needle age. The photosynthetic rate of the same five needles was recorded at 1-minute intervals for 10 to 30 minutes in each hour for each needle age. Different needles were measured each hour for each needle age. Approximately fifty P. pumila trees in the krummholz were used for the measurements. The environmental conditions were the same among these trees because these trees were grown at the same krummholz (). The five needles used for the photosynthetic measurement were sampled immediately after the measurement of each hour and transported to the laboratory to measure the projected leaf area of five needles. The projected leaf area of five needles was estimated by the product of the mean needle diameter, needle length in the chamber (3 cm), and the number of needles (five).
Data on outliers and measurement errors were removed, and the total number of data used for the statistical analysis was 8,205 for four needle ages between July and October. Photosynthetic rates and stomatal conductance of each needle age were averaged for each hour. The hourly average of photosynthetic rates and stomatal conductance were 91, 120, 117, and 116 for the current and one-, two-, and three-year-old needles, respectively.
Environmental factors
Daily mean air temperature, daily total solar radiation, daily mean relative humidity, and daily precipitation at the study site in 2018 were obtained from the AMGSD (1 × 1 km resolution). Hourly air temperature and relative humidity were estimated from the AMGSD (Appendix 2). VPD was calculated from the estimated temperature and relative humidity for each hour (Howell and Dusek Citation1995).
On each photosynthesis measurement day, air temperature and relative humidity were measured at hourly intervals at a height of 1 m in an open site using a thermohygrometer (HOBO H8 Pro Series; Onset Computer Corporation, Bourne, MA) in a radiation shield (CO-RS1; Onset Computer Corporation). PPFD was also measured at 10-minute intervals between 0:00 and 23:50 using a light quantum sensor (IKS-27; Koito Electric Corporation, Shizuoka, Japan) connected to a data logger (MES-101; Koito Electric Corporation). However, measurements of temperature, relative humidity, and PPFD were limited to the period when the photosynthetic measurements were conducted in October.
Soil temperature (Ts) and volumetric SWC (unitless) at a soil depth of 5 cm were measured in the P. pumila krummholz at hourly intervals throughout 2018 using a digital thermometer (TR-52i, T & D Corporation, Matsumoto, Japan) and five soil moisture sensors (ECH2O EC-5; METER Environment, Pullman, WA) connected to a data logger (Em50; METER Environment), respectively.
Abbreviations and units of measurement for variables measured in this study are listed in .
Table 1. Definitions and units of abbreviations
Statistical analysis
This study constructed an empirical photosynthetic model that was the product of the functions of environmental factors to examine the effects of environmental factors (PPFD, VPD, SWC, Ta, and Ts) and needle age on the net photosynthetic rate (Pn) of P. pumila. Data for three environmental factors (PPFD, VPD, Ta) recorded by the LI-6400 were used for the analysis. In the model, the maximum gross photosynthetic rate (Pmax) was multiplied by the function of the relative effect of each factor, and the dark respiration rate (Rd) was subtracted (EquationEquation (1)(1)
(1) ):
The functions of the environmental factors are shown in EquationEquations (2)(2)
(2) to (7) and range between 0 and 1:
where a to f are constants. Ta•opt (EquationEquation (3)(3)
(3) ), SWCopt (EquationEquation (5)
(5)
(5) ), and Ts•opt (EquationEquation (6)
(6)
(6) ) are the optimal air temperature, SWC, and soil temperature for photosynthesis, respectively, and age (EquationEquation (7)
(7)
(7) ) is needle age. The age of current year needles is zero. All constants were estimated by nonlinear regression analysis using mean photosynthetic rates of four needle ages at each hour on the fifteen measurement days. The Akaike information criterion (AIC) was used to assess the relative effect of each function (EquationEquations (2
(2)
(2) )‒(7)) and Rd on the whole model (EquationEquation (1)
(1)
(1) ). The model with the lowest AIC is essentially the best model; however, another model may be considered the same as the best model if the difference in AIC values (ΔAIC) is smaller than two (Burnham and Anderson Citation2002). If a certain function is important on the whole model, it is expected that the AIC value largely increases when the function is removed from the model. We compared AIC values among fifteen patterns of variable combinations to select a best model.
All statistical analyses were conducted using R v3.5.1 (R Core Team Citation2018). The nls function in R was used for the nonlinear regression analysis.
Results
Diurnal and seasonal changes in net photosynthetic rate
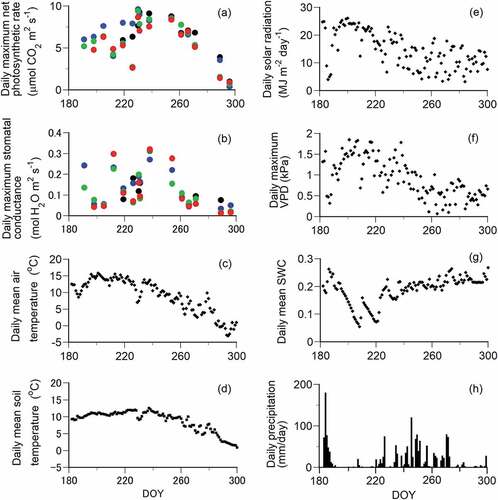
The daily maximum net photosynthetic rate and stomatal conductance were highest in late August (day of year [DOY] 230) and decreased in October (after DOY 275) for each needle age (). The seasonal variation in the daily mean soil temperature was smaller than that in the daily mean air temperature (). Although the daily mean air and soil temperatures and daily solar radiation were highest from mid-July to early August (DOY 190‒220; ), the daily maximum net photosynthetic rate and stomatal conductance decreased (). VPD increased and SWC decreased during this period (DOY 190‒220), with less precipitation (). Stomatal conductance temporarily increased at the end of July (DOY 212) because of the increase of SWC due to precipitation ().
Figure 2. Seasonal changes in the daily maximum net photosynthetic rate and daily maximum stomatal conductance of Pinus pumila and six environmental factors at the study site in 2018. (a), (b) The black, blue, green, and red circles indicate the current and one-, two-, and three-year-old needles, respectively. The photosynthetic rate and stomatal conductance of the three-year-old needles on 10 July (DOY 191) were not plotted because of the limited measurement time in late evening between 16:00 and 18:00. The six environmental factors are (c) daily mean air temperature, (d) daily mean soil temperature at a soil depth of 5 cm, (e) daily total solar radiation, (f) daily maximum VPD, (g) daily mean volumetric SWC at a soil depth of 5 cm, and (h) daily total precipitation. Air temperature, solar radiation, precipitation, and relative humidity were obtained from the Agro-Meteorological Grid Square Data, National Agricultural Research Organization (1 × 1 km resolution). VPD was calculated from the temperature and relative humidity.
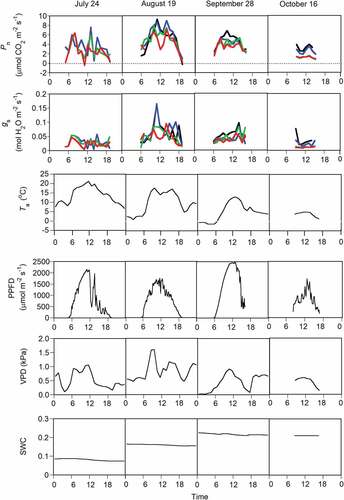
Decreases in photosynthetic rate and stomatal conductance were observed during daytime in July and August, even when PPFD and temperature were high (). VPD increased during daytime with high PPFD (). Stomatal conductance decreased with the increase of VPD for each needle age (Appendix 1; Figure S2d, Table S1).
Figure 3. Examples of diurnal changes in the net photosynthetic rate (Pn) and stomatal conductance (gs) of Pinus pumila and four environmental factors on four days. The black, blue, green, and red lines indicate the current and one-, two-, and three-year-old needles, respectively. The four environmental factors are air temperature (Ta), PPFD, VPD, and volumetric SWC at a soil depth of 5 cm.
Regression model of photosynthetic rates
We estimated the parameters of EquationEquation (1)(1)
(1) for the three best models (ΔAIC < 2), and many parameters were statistically significant, except for the dark respiration rate (Rd) of the first and third models, the parameter c of the third model, and the parameter d of all three models (). The respiration rate (Rd) in the first and third models was a negative value (), although the respiration rate should be a positive value. Therefore, the second model without Rd was selected:
Table 2. Estimated parameters of EquationEquation (1)(1)
(1) in the main text. Parameter values of three best models are shown. AIC values of the other combinations of parameters are shown in the Appendix 1 (Table S2)
VPD was not included in this model, indicating that the effect of VPD on the photosynthetic rate was smaller than that of the four other factors (PPFD, Ta, Ts, SWC).
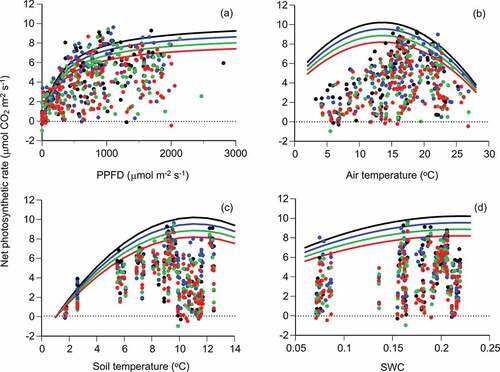
The photosynthetic rates of the four needle ages across diurnal and seasonal measurements were plotted with the environmental factors PPFD, air temperature, soil temperature, and SWC (). Variations in net photosynthetic rates were large at certain values of each environmental factor due to the effects of the three other factors (e.g., the photosynthetic rate decreased in dark conditions even if the three other factors were suitable for photosynthesis).
Figure 4. Relationships of net photosynthetic rates (Pn) of Pinus pumila with four environmental factors. The black, blue, green, and red circles and lines indicate the current and one-, two-, and three-year-old needles, respectively. The four environmental factors are (a) PPFD, (b) air temperature (Ta), (c) soil temperature (Ts), and (d) volumetric SWC. PPFD beside the chamber and air temperature in the chamber at the photosynthetic measurement were used for the analysis. A regression line in each panel was drawn for each needle age using EquationEquation (8)(8)
(8) on the assumption that the three other environmental factors do not limit the photosynthetic rate; that is, the equation in each panel is (a)
(b)
, (c)
, and (d)
. Each regression line indicates the change in the maximum photosynthetic rate for a certain environmental factor.
Regression lines (EquationEquation (8)(8)
(8) ) were drawn for each environmental factor for four needle ages under the assumption that the three other environmental factors do not limit the photosynthetic rate; that is, each regression line indicates the change in the maximum photosynthetic rate for a certain environmental factor (). The photosynthetic rate decreased by 6.6 percent with increasing leaf age for each environmental factor (, ). The net photosynthetic rate had unimodal relationships with air and soil temperatures and SWC, reflecting the existence of optimal values for the three factors (). The Ta•opt, Ts•opt, and optimal SWC were 13.53°C, 11.14°C, and 0.22, respectively (the second model in ; ). Air temperature (Ta) positively correlated with soil temperature (Ts): Ts = 0.563 × Ta + 3.756 (R2 = 0.865, p < .001, n = 119) during DOY 182–300 (1 July–27 October). Ts (11.37°C) estimated by the regression at Ta•opt (13.53°C) was almost equal to Ts•opt (11.14°C).
EquationEquation (8)(8)
(8) tended to underestimate photosynthetic rates for higher values because the slope of the regression of expected photosynthetic rates to observed photosynthetic rates was smaller than one (Appendix 1; Figure S3). However, seasonal and diurnal changes in net photosynthetic rates were well reproduced by the model for each needle age (). Therefore, the photosynthetic rate of P. pumila could be explained by the four environmental factors (PPFD, Ta, Ts, SWC) and needle age.
Figure 5. Comparison between observed values (dots) and expected values (lines) for the seasonal change in daily mean photosynthetic rates of Pinus pumila. The daily mean photosynthetic rate was the mean value of photosynthetic rates at hourly intervals. The panels show (a) current year needles, (b) one-year-old needles, (c) two-year-old needles, and (d) three-year-old needles.
Figure 6. Examples of model fitting (lines) to observed values (dots) of net photosynthetic rates of Pinus pumila on four days in 2018: (a)–(c) 24 July, (d)–(g) 19 August, (h)–(k) 28 September, and (l)–(o) 16 October. The panels show the current and one-, two-, and three-year-old needles, respectively, from left to right.
Discussion
In this study, the in situ photosynthetic rate largely decreased from summer to autumn for each needle age, and the photosynthetic rate was lower for older needles. The seasonal and diurnal changes in P. pumila photosynthesis were related to changes in the air and soil temperatures, SWC, and solar radiation. Solar radiation (or PPFD) decreased from summer to autumn, and it is no doubt that solar radiation greatly influences the diurnal change in the photosynthetic rate of P. pumila (Ishida et al. Citation2001).
Other studies have also reported similar results in terms of air and soil temperatures; that is, the photosynthetic rate changed according to seasonal changes in air and soil temperatures and the photosynthetic rate increased with warming (Babalola, Boersma, and Youngberg Citation1968; Kajimoto Citation1990; Niu et al. Citation2008; Gunderson et al. Citation2010; Wieser et al. Citation2010). Plants usually acclimate to short- and long-term changes in thermal conditions; that is, the maximum photosynthetic rate and optimal temperature for photosynthesis increase in proportion to growth temperature (Gunderson et al. Citation2010; Wieser et al. Citation2010; Sendall et al. Citation2015; Slot and Winter Citation2017). The optimal air temperature for photosynthesis (13.5°C) of P. pumila was similar to the monthly mean air temperature in July (13.1°C) and August (12.6°C) in 2018, indicating the adaptation to the current thermal conditions. The highest photosynthetic rate was observed at an air temperature of 16°C to 20°C in the chamber, which was higher than the optimal air temperature (13.5°C). This may be due to the difference in temperature between the inside and outside of the chamber (i.e., air temperature in the chamber was 4.3°C higher than outside on average).
The optimal soil temperature (11.1°C) was also similar to the monthly mean soil temperature in July (10.4°C) and August (11.3°C). Soil temperature affected the photosynthetic rate of P. pumila probably because of the stomatal control (DeLucia, Day, and Öquist Citation1991). Soil temperature affects stomatal conductance through fine root growth, membrane fluidity, and permeability (Ameglio et al. Citation1990; Carvajal, Cooke, and Clarkson Citation1996; Pregitzer et al. Citation2000). In particular, soil temperature often restricts transpiration below a certain threshold temperature (Mellander, Bishop, and Lundmark Citation2004). In this study, stomatal conductance was always low at a soil temperature below 9°C, and there was a large variation in stomatal conductance at soil temperature above 9°C (Appendix 1; Figure S2c). The soil temperature of 9°C was seasonally about DOY 260 (mid-September; i.e., half a month before the end of the growing season of P. pumila). Although it is not unclear whether 9°C is the threshold soil temperature for the P. pumila, it is possible that soil temperature relates to the end of the growing season of P. pumila by regulating water transportation.
The photosynthetic rate decreased slightly due to a decrease in SWC (i.e., drought stress) in late July and early August when the air temperature and solar radiation were highest and precipitation was lower. Although VPD also increased during this period, VPD was not important for the seasonal and diurnal variations in photosynthetic rates. In this study site, the daily maximum VPD scarcely exceeds 1.5 kPa (Appendix 1; Figure S4); a VPD of 1.5 kPa is not extremely high (cf. Grossiord et al. Citation2020). Takahashi and Miyajima (Citation2008) measured the predawn water potential in the leaves of four dominant species along an elevational gradient from 1,600 to 2,400 m.a.s.l. on Mount Norikura and found that drought stress hardly occurred, irrespective of elevation. Precipitation in this region is greater at higher elevations, which also endure lower air temperatures and shorter insolation durations (Takahashi, Tokumitsu, and Yasue Citation2005). In addition, fog often occurs on summer afternoons at high elevations in central Japan. Such local climatic conditions are unlikely to cause drought stress for P. pumila at the treeline (Takahashi Citation2003). Therefore, the seasonal and diurnal changes in the photosynthetic rate of P. pumila can be explained by the four environmental factors (Ta, Ts, PPFD, SWC) and needle age.
This study showed that diurnal and seasonal variations in the photosynthetic rate of P. pumila could be explained by four environmental factors (Ta, Ts, PPFD, SWC) and needle age. A biochemical process–based model of photosynthesis is often used for the modeling of photosynthesis (Farquhar, Von Caemmerer, and Berry Citation1980; Kattge and Knorr Citation2007; Sharkey et al. Citation2007; Bellasio and Farquhar Citation2019). However, these models are complex, and parameter estimation can be difficult in field studies, especially at high elevations where the measurement of in situ photosynthetic rates can be challenging. We developed an empirical model of the photosynthetic rate of dwarf pine P. pumila that will facilitate evaluations of the effects of climate change on the photosynthetic production of P. pumila at treelines. In fact, shoot elongation in P. pumila is positively correlated with the mean summer temperatures of the previous year (Takahashi Citation2006). It is expected that the increase of air and soil temperatures due to climate change will increase the growth of P. pumila by increasing photosynthetic production. However, the model developed in this study is not sufficient to predict the photosynthetic production of P. pumila under climate change because of the acclimation to long-term change in temperatures. Giving the similarity of Ta•opt and Ts•opt with the monthly mean air and soil temperatures of July and August, it is expected that the increase in air and soil temperatures in summer will reach suboptimum levels for the photosynthesis if Ta•opt and Ts•opt of the model (EquationEquation (8)(8)
(8) ) do not increase in proportion to the increase in summer temperature, which decreases photosynthetic production in summer (Wentz, Neff, and Suding Citation2018). Therefore, the empirical model of the photosynthetic rate in this study cannot be used for the prediction of effects of climate change on the photosynthetic production of P. pumila. Further studies are necessary to examine the temperature dependency of photosynthetic characteristics for the precise prediction of climate change effects on the photosynthetic production of P. pumila.
Supplemental Material
Download Zip (837.4 KB)Disclosure statement
No potential conflict of interest was reported by the authors.
Supplementary material
Supplemental material for this article can be accessed on the publisher’s website.
Additional information
Funding
References
- Ameglio, T., J. Morizet, P. Cruiziat, and M. Martignac. 1990. The effects of root temperature on water flux, potential and root resistance in sunflower. Agronomie 10:331‒340. doi:10.1051/agro:19900407.
- Babalola, O., L. Boersma, and C. T. Youngberg. 1968. Photosynthesis and transpiration of Monterey pine seedlings as a function of soil water suction and soil temperature. Plant Physiology 43:515‒521. doi:10.1104/pp.43.4.515.
- Bellasio, C., and G. D. Farquhar. 2019. A leaf-level biochemical model simulating the introduction of C2 and C4 photosynthesis in C3 rice: Gains, losses and metabolite fluxes. New Phytologist 223:150‒166. doi:10.1111/nph.15787.
- Burnham, K. P., and D. R. Anderson. 2002. Model selection and multimodel inference: A practical information theoretic approach. New York, NY, USA: Springer.
- Carvajal, M., D. T. Cooke, and D. T. Clarkson. 1996. Plasma membrane fluidity and hydraulic conductance in wheat roots: Interactions between root temperature and nitrate or phosphate deprivation. Plant, Cell and Environment 19:1110‒1114. doi:10.1111/j.1365-3040.1996.tb00219.x.
- Cochard, H., R. Martin, P. Gross, and M. B. Bogeat-Triboulot. 2000. Temperature effects on hydraulic conductance and water relations of Quercus robur L. Journal of Experimental Botany 51:1255‒1259. doi:10.1093/jxb/51.348.1255.
- Craine, J. M., J. B. Nippert, E. G. Towne, S. Tucker, S. W. Kembel, A. Skibbe, and K. K. McLauchlan. 2011. Functional consequences of climate change-induced plant species loss in a tallgrass prairie. Oecologia 165:1109‒1117. doi:10.1007/s00442-011-1938-8.
- DeLucia, E. H., T. A. Day, and G. Öquist. 1991. The potential for photoinhibition of Pinus sylvestris L. seedlings exposed to high light and low soil temperature. Journal of Experimental Botany 42:611‒617. doi:10.1093/jxb/42.5.611.
- Farquhar, G. D., S. Von Caemmerer, and J. A. Berry. 1980. A biochemical model of photosynthetic CO2 assimilation in leaves of C3 species. Planta 149:78‒90. doi:10.1007/BF00386231.
- Flanagan, L. B., and K. H. Syed. 2011. Stimulation of both photosynthesis and respiration in response to warmer and drier conditions in a boreal peatland ecosystem. Global Change Biology 17:2271‒2287. doi:10.1111/j.1365-2486.2010.02378.x.
- Foster, J. R., and W. K. Smith. 1991. Stomatal conductance patterns and environment in high elevation phreatophytes of Wyoming. Canadian Journal of Botany 69:647‒655. doi:10.1139/b91-087.
- Francey, R. J., and G. D. Farquhar. 1982. An explanation of 13C/12C variations in tree rings. Nature 297:28‒31. doi:10.1038/297028a0.
- Ganjurjav, H., Q. Gao, W. Zhang, Y. Liang, Y. Li, X. Cao, and L. Danjiu. 2015. Effects of warming on CO2 fluxes in an alpine meadow ecosystem on the central Qinghai–Tibetan Plateau. PLoS One 10:e0132044. doi:10.1371/journal.pone.0132044.
- Granier, A., and N. Bréda. 1996. Modelling canopy conductance and stand transpiration of an oak forest from sap flow measurements. Annales des Sciences Forestières 53:537‒546. doi:10.1051/forest:19960233.
- Grossiord, C., T. N. Buckley, L. A. Cernusak, K. A. Novick, B. Poulter, R. T. W. Siegwolf, J. S. Sperry, and N. G. McDowell. 2020. Plant responses to rising vapor pressure deficit. New Phytologist 226:1550‒1566. doi:10.1111/nph.16485.
- Gunderson, C. A., K. H. O’Hara, C. M. Campion, A. V. Walker, and N. T. Edwards. 2010. Thermal plasticity of photosynthesis: The role of acclimation in forest responses to a warming climate. Global Change Biology 16:2272‒2286.
- Howell, T. A., and D. A. Dusek. 1995. Comparison of vapor-pressure-deficit calculation methods‒southern high plains. Journal of Irrigation Drainage and Engineering 121:191‒198. doi:10.1061/(ASCE)0733-9437(1995)121:2(191).
- Hu, Y., L. Jiang, S. Wang, Z. Zhang, C. Luo, X. Bao, and S. Cui. 2016. The temperature sensitivity of ecosystem respiration to climate change in an alpine meadow on the Tibet plateau: A reciprocal translocation experiment. Agricultural and Forest Meteorology 216:93‒104. doi:10.1016/j.agrformet.2015.10.002.
- Intergovernmental Panel on Climate Change. 2013. Climate change 2013: The physical science basis. In Contribution of working group I to the fifth assessment report of the intergovernmental panel on climate change, ed. T. F. Stocker, D. Qin, G. K. Plattner, M. Tignor, S. K. Allen, J. Boschung, A. Nauels, Y. Xia, V. Bex, and P. M. Midgley, Cambridge, United Kingdom and New York, NY, USA: Cambridge University Press, 1585 pp.
- Ishida, A., T. Nakano, S. Sekikawa, E. Maruta, and T. Masuzawa. 2001. Diurnal changes in needle gas exchange in alpine Pinus pumila during snow-melting and summer seasons. Ecological Research 16:107‒116. doi:10.1046/j.1440-1703.2001.00376.x.
- Jørgensen, R. H., M. Hallinger, S. Ahlgrimm, J. Friemel, J. Kollmann, and H. Meilby. 2015. Growth response to climatic change over 120 years for Alnus viridis and Salix glauca in West Greenland. Journal of Vegetation Science 26:155‒165. doi:10.1111/jvs.12224.
- Kajimoto, T. 1990. Photosynthesis and respiration of Pinus pumila needles in relation to needle age and season. Ecological Research 5:333‒340. doi:10.1007/BF02347008.
- Kajimoto, T. 1993. Shoot dynamics of Pinus pumila in relation to altitudinal and wind exposure gradients on the Kiso mountain range, central Japan. Tree Physiology 13:41‒53. doi:10.1093/treephys/13.1.41.
- Kattge, J., and W. Knorr. 2007. Temperature acclimation in a biochemical model of photosynthesis: A reanalysis of data from 36 species. Plant, Cell & Environment 30:1176‒1190. doi:10.1111/j.1365-3040.2007.01690.x.
- Kellomäki, S., H. Strandman, T. Heinonen, A. Asikainen, A. Venäläinen, and H. Peltola. 2018. Temporal and spatial change in diameter growth of boreal Scots pine, Norway spruce, and birch under recent-generation (CMIP5) global climate model projections for the 21st century. Forests 9:118. doi:10.3390/f9030118.
- King, G. M., F. Gugerli, P. Fonti, and D. C. Frank. 2013. Tree growth response along an elevational gradient: Climate or genetics? Oecologia 173:1587‒1600. doi:10.1007/s00442-013-2696-6.
- Kominami, Y., K. Sasaki, and H. Ohno. 2019. User’s manual for The Agro-Meteorological Grid Square Data, NARO Ver.4. NARO, Tsukuba. 67pp (in Japanese).
- Liu, Q., L. Xie, and F. Li. 2019. Dynamic simulation of the crown net photosynthetic rate for young Larix olgensis Henry trees. Forests 10:321. doi:10.3390/f10040321.
- Major, J. E., and K. H. Johnsen. 1996. Family variation in photosynthesis of 22-year-old black spruce: A test of two models of physiological response to water stress. Canadian Journal of Forest Research 26:1922‒1933. doi:10.1139/x26-217.
- Mellander, P.-E., K. Bishop, and T. Lundmark. 2004. The influence of soil temperature on transpiration: A plot scale manipulation in a young Scots pine stand. Forest Ecology and Management 195:15‒28. doi:10.1016/j.foreco.2004.02.051.
- Miyajima, Y., T. Sato, and K. Takahashi. 2007. Altitudinal changes in vegetation of tree, herb and fern species on Mount Norikura, central Japan. Vegetation Science 24:29‒40.
- Niu, S., Z. Li, J. Xia, Y. Han, M. Wu, and S. Wan. 2008. Climatic warming changes plant photosynthesis and its temperature dependence in a temperate steppe of northern China. Environmental and Experimental Botany 63:91‒101. doi:10.1016/j.envexpbot.2007.10.016.
- Oberbauer, S. F., C. E. Tweedie, J. M. Welker, J. T. Fahnestock, G. H. Henry, P. J. Webber, and G. Starr. 2007. Tundra CO2 fluxes in response to experimental warming across latitudinal and moisture gradients. Ecological Monographs 77:221‒238.
- Ohdo, T., and K. Takahashi. 2020. Plant species richness and community assembly along gradients of elevation and soil nitrogen availability. AoB PLANTS 12:laa014. doi:10.1093/aobpla/plaa014.
- Ohno, H., K. Sasaki, G. Ohara, and K. Nakazono. 2016. Development of grid square air temperature and precipitation data compiled from observed, forecasted, and climatic normal data. Climate in Biosphere 16:71–79. (in Japanese with English title). doi:10.2480/cib.J-16-028.
- Okitsu, S., and K. Ito. 1984. The relation of forest limit to the WI 15 in mountains of Hokkaido. Japanese Journal of Ecology 34:341–46. (in Japanese with English summary).
- Peri, P. L., D. J. Moot, D. L. McNeil, A. C. Varella, and R. J. Lucas. 2002. Modelling net photosynthetic rate of field-grown cocksfoot leaves under different nitrogen, water and temperature regimes. Grass and Forage Science 57:61‒71. doi:10.1046/j.1365-2494.2002.00302.x.
- Pregitzer, K. S., J. S. King, A. J. Burton, and S. E. Brown. 2000. Responses of tree fine roots to temperature. New Phytologist 147:105‒115. doi:10.1046/j.1469-8137.2000.00689.x.
- R Core Team. 2018. R: A language and environment for statistical computing. Vienna, Austria: R Foundation for Statistical Computing. https://www.R-project.org/ (accessed on 1 October 2018).
- Reich, P. B., K. M. Sendall, A. Stefanski, R. L. Rich, S. E. Hobbie, and R. A. Montgomery. 2018. Effects of climate warming on photosynthesis in boreal tree species depend on soil moisture. Nature 562:263‒267. doi:10.1038/s41586-018-0582-4.
- Reich, P. B., M. B. Walters, and D. S. Ellsworth. 1992. Leaf life-span in relation to leaf, plant, and stand characteristics among diverse ecosystems. Ecological Monographs 62:365‒392. doi:10.2307/2937116.
- Reyer, C., P. Lasch-Born, F. Suckow, M. Gutsch, A. Murawski, and T. Pilz. 2014. Projections of regional changes in forest net primary productivity for different tree species in Europe driven by climate change and carbon dioxide. Annals of Forest Science 71:211‒225. doi:10.1007/s13595-013-0306-8.
- Sage, R. F., and D. S. Kubien. 2007. The temperature response of C3 and C4 Photosynthesis. Plant, Cell & Environment 30:1086‒1106. doi:10.1111/j.1365-3040.2007.01682.x.
- Sánchez-Salguero, R., J. J. Camarero, E. Gutiérrez, F. G. Rouco, A. Gazol, G. Sangüesa-Barreda, L. Andreu-Hayles, J. C. Linares, and K. Seftigen. 2017. Assessing forest vulnerability to climate warming using a process-based model of tree growth: Bad prospects for rear-edges. Global Change Biology 23:2705‒2719. doi:10.1111/gcb.13541.
- Sendall, K. M., P. B. Reich, C. Zhao, H. Jihua, X. Wei, A. Stefanski, K. Rice, R. L. Rich, and R. A. Montgomery. 2015. Acclimation of photosynthetic temperature optima of temperate and boreal tree species in response to experimental forest warming. Global Change Biology 21:1342‒1357. doi:10.1111/gcb.12781.
- Sharkey, T. D., C. J. Bernacchi, G. D. Farquhar, and E. L. Singsaas. 2007. Fitting photosynthetic carbon dioxide response curves for C3 leaves. Plant, Cell & Environment 30:1035‒1040. doi:10.1111/j.1365-3040.2007.01710.x.
- Slot, M., and K. Winter. 2017. Photosynthetic acclimation to warming in tropical forest tree seedlings. Journal of Experimental Botany 68:2275‒2284. doi:10.1093/jxb/erx071.
- Suzuki, R., and K. Takahashi. 2020. Effects of leaf age, elevation and light conditions on photosynthesis and leaf traits in saplings of two evergreen conifers, Abies veitchii and A. mariesii. Journal of Plant Ecology 13:460‒469. doi:10.1093/jpe/rtaa034.
- Takahashi, K., and I. Okuhara. 2013. Forecasting the effects of global warming on radial growth of subalpine trees at the upper and lower distribution limits in central Japan. Climatic Change 117:273‒287. doi:10.1007/s10584-012-0547-9.
- Takahashi, K., and S. Yoshida. 2009. How the scrub height of Pinus pumila decreases at the treeline. Ecological Research 24:847‒854. doi:10.1007/s11284-008-0558-1.
- Takahashi, K., and Y. Miyajima. 2008. Variations in stomatal density, stomatal conductance and leaf water potential along an altitudinal gradient in central Japan. Phyton (Horn, Austria) 48:1‒12.
- Takahashi, K., Y. Tokumitsu, and K. Yasue. 2005. Climatic factors affecting the tree-ring width of Betula ermanii at the timberline on Mount Norikura, central Japan. Ecological Research 20:445–51. doi:10.1007/s11284-005-0060-y.
- Takahashi, K. 2003. Diurnal variations in stomatal conductance of Betula ermanii and Pinus pumila at the timberline on Mt. Shogigashira, central Japan. Journal of Phytogeography and Taxonomy 51:159‒164.
- Takahashi, K. 2006. Shoot growth chronology of alpine dwarf pine (Pinus pumila) in relation to shoot size and climatic conditions: A reassessment. Polar Bioscience 19:123‒132.
- Weijers, S., F. Wagner-Cremer, U. Sass-Klaassen, R. Broekman, and J. Rozema. 2013. Reconstructing High Arctic growing season intensity from shoot length growth of a dwarf shrub. The Holocene 23:721‒731. doi:10.1177/0959683612470178.
- Wentz, K. F., J. C. Neff, and K. N. Suding. 2018. Leaf temperatures mediate alpine plant communities’ response to a simulated extended summer. Ecology and Evolution 9:1227–43. doi:10.1002/ece3.4816.
- Wieser, G., W. Oberhuber, L. Walder, D. Spieler, and A. Gruber. 2010. Photosynthetic temperature adaptation of Pinus cembra within the timberline ecotone of the Central Austrian Alps. Annals of Forest Science 67:201‒201. doi:10.1051/forest/2009094.
- Wu, L., H. Su, and J. H. Jiang. 2011. Regional simulations of deep convection and biomass burning over South America: 2. Biomass burning aerosol effects on clouds and precipitation. Journal of Geophysical Research: Atmospheres 116:D17209.
- Zaka, S., E. Frak, B. Julier, F. Gastal, and G. Louarn. 2016. Intraspecific variation in thermal acclimation of photosynthesis across a range of temperatures in a perennial crop. AoB PLANTS 8:lw035. doi:10.1093/aobpla/plw035.
- Zhang, S. B., Z. K. Zhou, H. Hu, K. Xu, N. Yan, and S. Y. Li. 2005. Photosynthetic performances of Quercus pannosa vary with altitude in the Hengduan Mountains, southwest China. Forest Ecology and Management 212:291‒301. doi:10.1016/j.foreco.2005.03.031.
- Zhang, Y., Y. Bergeron, L. Gao, X. Zhao, X. Wang, and I. Drobyshev. 2014. Tree growth and regeneration dynamics at a mountain ecotone on Changbai Mountain, northeastern China: Which factors control species distributions? Écoscience 21:387‒404. doi:10.2980/21-(3-4)-3702.