
ABSTRACT
Curvilinear depressions and chains of asymmetrical to circular pits up to a few meters deep and a few tens of meters wide have been mapped on the upper continental slope beyond the mid-Norwegian shelf. These features are interpreted to represent a continuum of seafloor landforms produced by the grounding of iceberg keels at successive low tides. The features occur along a 50 km long stretch of the upper slope in modern water depths between 400 and 500 m. The average distance between pits varies between about 70 and 175 m, representing one tidal cycle of 12 hr 25 min between successive low tides. This yields average iceberg drift velocities of between 5 and 15 m hr−1. The pits are often asymmetrical, with a downstream surcharge or berm, making it possible to determine the direction of iceberg drift and, therefore, the current direction at the time of ploughmark formation. The c. 300 m thick icebergs producing the ploughmarks are likely to have been sourced mainly from the fast-flowing Norwegian Channel Ice Stream to the south and probably formed during the early part of regional deglaciation of the Norwegian shelf after the Last Glacial Maximum around 20,000 years ago. The icebergs appear to follow a similar northeastward flow direction to that of the present Norwegian Atlantic Current offshore of Norway.
Introduction
Iceberg ploughmarks (sometimes referred to as iceberg scours or furrows), produced when the keels of drifting icebergs contact the sedimentary seafloor, have been observed on many formerly glaciated continental margins around the world (Dowdeswell et al. Citation2016). Some of the first reports were from Arctic continental shelves and were based on data from single-beam echo sounders and side-scan sonar instruments (Carsola Citation1954; Rex Citation1955; Kovacs Citation1972; Belderson and Wilson Citation1973; Syvitski et al. Citation2001). Extensive areas of ploughmarks on the Norwegian shelf were surveyed from seismic and side-scan sonar data by Lien (Citation1983). More recently, iceberg ploughmarks have been imaged using multibeam echo-sounders and using three-dimensional (3D) seismic data from many shelf and upper-slope areas in Arctic and Antarctic waters (e.g., Dowdeswell and Ottesen Citation2013; Gales, Larter, and Leat Citation2016; Lewis et al. Citation2016; Wise et al. Citation2017). The submarine keels of occasional “mega-bergs” have produced ploughmarks to water depths of 800 to 1,200 m (e.g., Kuijpers et al. Citation2008; Arndt and Forwick Citation2016; Jakobsson and O’Regan Citation2016). Ploughmarks produced by icebergs derived from full-glacial ice sheets have been found as far south as 24°N off Florida in the Northern Hemisphere (Hill Citation2016) and as far north as 43°S offshore of New Zealand (Stewart et al. Citation2016) and 47°S on the Patagonian margin in the Southern Hemisphere (Lopez-Martinez et al. Citation2016).
Iceberg ploughmarks can be many tens of kilometers long, up to several kilometers wide, and 30 m deep (e.g., Dowdeswell and Bamber Citation2007; Lopez-Martinez et al. Citation2011; Montelli et al. Citation2018). Some ploughmarks have a comb-like morphology, which indicates that the icebergs forming them had multiple keels (e.g., Batchelor et al. Citation2016). In addition, iceberg ploughmarks often have a consistent broad-scale orientation, although interspersed with loops and other small-scale deviations (e.g., Bjarnadóttir et al. Citation2016; Newton, Huuse, and Brocklehurst Citation2016; Batchelor et al. Citation2020), suggesting that mean drift-tracks are influenced by and therefore record the flow direction of ocean currents (e.g., Montelli et al. Citation2018; Newton, Huuse, and Brocklehurst Citation2018). Intermittent contact between iceberg keels and the sedimentary seafloor is also recorded by the presence of grounding pits instead of continuous ploughmarks (e.g., Bass and Woodworth-Lynas Citation1988; Barrie et al. Citation1992).
Iceberg ploughmarks with an assumed tidal signal have been reported only very rarely, however. Some spiral-formed iceberg ploughmarks on a palaeo-shelf buried about 350 m deep on the mid-Norwegian margin have been identified from a 3D seismic cube; they date from a buried surface relating to deglaciation at the end of Marine Isotope Stage (MIS) 12 about 430,000 years ago (Newton, Huuse, and Brocklehurst Citation2016). The spiral or corkscrew pattern of these ploughmarks was inferred to be a result of icebergs drift under the influence of both tidal and geostrophic currents. This is very similar to the drift tracks of modern icebergs in Antarctic waters (MacAyeal et al. Citation2008). Jakobsson et al. (Citation2011) described regularly spaced ridges on a surface with glacial lineations in Pine Island Bay, West Antarctica. They interpreted these features to have been formed by the trailing edge of mega-icebergs that rhythmically settled into seafloor sediments under the influence of tidal motion. In addition, Bass and Woodworth-Lynas (Citation1988) reported chains of up to eight pits spaced 25–70 m apart on the Labrador Shelf. They proposed the origin of these chains of pits to be a result of an iceberg keel alternately impacting and rotating free of the seabed and did not invoke a tidal mechanism. A morphologically similar series of pits was imaged on the Falklands Plateau by Brown et al. (Citation2017), ascribed to a partially grounded iceberg being driven forward and oscillating up and down driven by ocean swell.
In this article, we examine in detail a number of distinctive iceberg ploughmarks that contain chains of pits set within curvilinear depressions on the mid-Norwegian margin (). The dimensions of these seafloor landforms are surveyed using high-resolution multibeam bathymetry. The chains of pits are then interpreted in the context of tidally influenced processes of formation. The morphology of and distance between pits allows calculation of iceberg drift rates and an assessment of paleocurrent directions during the Late Weichselian glaciation. The sources and timing of iceberg delivery to the Norwegian margin are also considered. High-latitude shelves in both hemispheres, especially when less than 400–500 m deep, commonly exhibit curvilinear and circular depressions distributed in a fairly chaotic pattern formed by the interaction of the keels of drifting icebergs with the seafloor (e.g., Harris and Jollymore Citation1974; Woodworth-Lynas et al. Citation1991; Dowdeswell et al. Citation1993), but chains of regularly spaced pits related to tidal variations are rare.
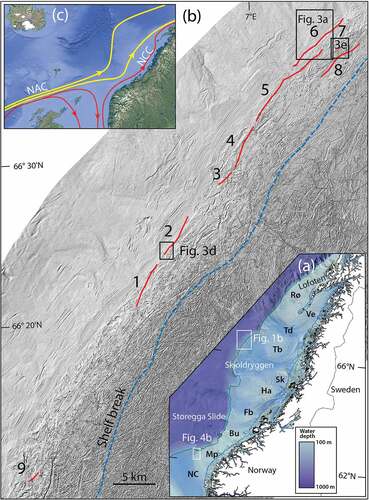
Figure 1. (a) Overview map of the mid-Norwegian shelf and continental slope. NC – Norwegian Channel, Mp – Måløy Plateau, Bu – Buagrunnen, Fb – Frøyabanken, Ha – Haltenbanken, Sk – Sklinnabanken, Tb – Trænabanken, Td – Trænadjupet, Rø – Røstbanken, Ve – Vestfjorden. (b) Overview map of the continental shelf and slope areas north of Skjoldryggen in the northern part of the mid-Norwegian shelf (located in a). Blue stippled line is the shelf edge. Red lines show the mapped tidal influenced iceberg ploughmarks each marked with a black number (). (c) Overview map of the North Atlantic with the modern ocean-surface circulation (Sætre Citation2007). NAC is Norwegian Atlantic Current. NCC is Norwegian Coastal Current. Bathymetric data: ©Kartverket.
The mid-Norwegian shelf and upper slope are very suitable areas for our investigations given that: (i) this is a continental margin that has been strongly influenced by dynamic ice sheets during both the most recent and many earlier Quaternary glaciations (Dahlgren et al. Citation2005; Ottesen, Dowdeswell, and Rise Citation2005; Rise et al. Citation2005; Ottesen et al. Citation2009; Montelli et al. Citation2017); (ii) a comprehensive multibeam echo-sounder dataset at 5 m horizontal resolution exists so that seafloor morphology can be examined in great detail (Bøe et al. Citation2020); (iii) modern water depths on the outer shelf are approximately 400 m in the deeper cross-shelf troughs, and ploughmarks produced by relatively deep-keeled icebergs have been observed on the shelf and adjacent upper continental slope (Lien Citation1983); and (iv) post-glacial Holocene sedimentation in the area has been minor, with iceberg ploughmarks and other glacial landforms often buried by only a thin layer of sediments up to a few meters thick (Rokoengen and Frengstad Citation1999; Morén et al. Citation2018).
Data sources and methods
A high-resolution multibeam echo-sounder dataset imaging 29,700 km2 of the mid-Norwegian continental shelf and upper slope was acquired during the Norwegian MAREANO seabed-mapping program (www.mareano.no, Bøe et al. Citation2020). A part of the dataset was obtained by the Norwegian Hydrographic Service (NHS, Kartverket) and a further portion by commercial companies using various multibeam echo-sounder systems. NHS processed the raw multibeam echo-sounder data including depth conversion, tidal corrections, and spike removal (Jakobsson et al. Citation2016). The various datasets have been gridded at a horizontal cell-size of 5 m and have a vertical resolution of better than 0.15 m. Finally, the data were merged into a large regional dataset.
Detailed visual inspection of the seafloor imagery from the upper slope on the mid-Norwegian margin identified several unusual chains of pits and associated ploughmarks (). The tracks of these ploughmarks have been digitized using ArcMap software along the center-line of ploughmarks or from pit to pit where the ploughmarks are not continuous. Individual pits have also been digitized. Length- and cross-profiles have also been measured along the continuous ploughmarks or regularly spaced pits. The distance between individual pits has been calculated from the length profiles.
Figure 2. Three types of tidally influenced iceberg ploughmarks (IPMs) on the mid-Norwegian upper slope shown in plan-view multibeam images and as depth profiles. (a) Continuous iceberg ploughmark with regularly spaced depressions along the center line of the ploughmark. (b) Seafloor depth profile along the center line of the ploughmark shown in a. (c) Chain of asymmetrical pits. (d) Seafloor depth profile along the chain of asymmetrical pits shown in c. (e) Chain of circular pits. (f) Seafloor depth profile along the chain of circular pits shown in e. The y-axes of panels b, d and f is water depth. Bathymetric data: ©Kartverket.
Although individual iceberg grounding pits may be superficially similar to seafloor pockmarks produced by gas or fluid escape (e.g., Hovland and Judd Citation1988), we distinguished the two on the basis of the following visual criteria (e.g., Brown et al. Citation2017): pits are usually concentrated in association with linear to curvilinear iceberg ploughmarks; they are sometimes found in chains and may be asymmetrical as a result of iceberg drift, whereas pockmarks are usually, although not always, circular; berms are often present around all or part of iceberg pits but are typically absent from pockmarks.
Results: morphology of tidally influenced iceberg ploughmarks
We identify and describe three types of iceberg ploughmarks and associated chains of pits, imaged clearly in our high-resolution multibeam-bathymetric datasets () from the upper slope north of Skjoldryggen on the mid-Norwegian margin (). The three types of landform appear to represent a continuum of decreasing disturbance of the seafloor ().
On the mid-Norwegian upper continental slope, in water depth between 410 and 460 m, nine distinctive chains of linear or curvilinear depressions or pits with lengths between 1 and 8 km have been mapped (), and the dimensions of pits within each chain have been measured (). With one exception, each of the nine linear features contains pits of at least two different forms along its length. In some cases, the elongate depressions are crossed by one or more large iceberg ploughmarks which locally overprint the features we describe (). Three different types of regularly spaced chains of pits have been identified as follows (): (i) continuous curvilinear depressions with regularly spaced pits along the ploughmark center-line; (ii) curvilinear chains of asymmetrical pits; and (iii) curvilinear chains of circular pits. We describe these features and discuss their mechanism of formation.
Table 1. Dimensions of iceberg ploughmarks (IPMs; located in ) and associated pits
Linear to curvilinear ploughmarks with regular along-axis depressions
Description
This first type of feature consists of well-defined and semi-continuous linear to curvilinear depressions with, along their center-lines, regularly spaced pit-like features up to a few meters deep (, ). Six such curvilinear depressions with regularly spaced pits of similar morphology have been observed (), noting that the two longest depressions (IPMs 1 and 5 in ) are subdivided into several segments in . The pits have average depths between 0.9 and 2.2. m (maximum depth 2.8 m) and widths of between about 35 and 50 m. The linear depressions typically have a V-shaped form with sides having angles mainly between 2 and 10°, reaching a maximum of 15°. Berms occur on one or both sides of many of the curvilinear depressions and the pits within them occasionally have small berms (sometimes known as surcharges) at one end, orthogonal to the axis of the depression ().
Figure 3. Examples of multibeam bathymetry (shaded relief images) of the seafloor on the upper mid-Norwegian slope showing tidally influenced iceberg ploughmarks (located in ). (a) IPM 6. The image shows a 4 km-long ploughmark with continuous elements and asymmetrical pits. Inset shows depth profile along the center-line of the ploughmark. (b) Detail of IPM6 showing a quasi-continuous depression with berms or surcharges in front of individual pits in plan and profile. (c) Detail of IPM6 showing individual asymmetrical to circular ploughmarks separated by a smooth seafloor in plan and profile. (d) IPM 2. The image shows a continuous ploughmark with regularly spaced pits along its center-line. Inset shows depth profiles along the axis of the ploughmark (black line) and 50 m offset profile of the unplowed seafloor (stippled line). (e) IPM 7. The image shows continuous and asymmetrical ploughmarks. Inset shows depth profile along the center-line of the ploughmark (black line) and 50 m offset profile of the unplowed seafloor (stippled line). In each panel the x-axis is distance and the y-axis is water depth. Bathymetric data: ©Kartverket.
Interpretation
The linear to curvilinear depressions are interpreted as iceberg ploughmarks (IPMs), produced by the keels of drifting icebergs that have become grounded on the sedimentary seafloor. The regularly spaced pits within the depressions are interpreted to reflect a tidal signal, with the pits formed by increased indentation of the iceberg keels into seafloor sediments at successive low tides; each pit is separated from the next by a distance equal to the amount of iceberg drift between one low tide and the next. In some cases, the regular pattern described above is broken up into segments or chains that are separated by less disturbed seafloor, indicating that the icebergs may be completely ungrounded from time to time (). Such intermittent grounding and ungrounding is likely to be a result of minor undulations in the local seafloor or even variations in tidal range over monthly cycles, extreme swell conditions, or the inverse barometric effect of deep low-pressure areas.
Chains of asymmetrical pits
Description
Morphologically asymmetrical pits occur as chains in which one side of each pit is a simple depression whereas the other has a raised berm or surcharge at its edge (). Sometimes the asymmetrical pits are completely separated from one another, and in other cases they partly merge with the adjacent pit (illustrated on the right and left sides of , respectively). The pits are mainly 1 to 2 m deep (one has been recorded as 5 m in depth) and vary between 30 and 40 m wide (, ).
Interpretation
Chains of asymmetrical pits are interpreted to have formed when iceberg keels start to plow the seafloor on a falling tide, pushing sediments to each side to produce berms. As the iceberg continues to drift on the falling tide, its keel pushes deeper into the sediment until low tide is reached. The iceberg keel eventually lifts off from the seafloor on the rising tide. In this way, a chain of asymmetrical pits is generated with the up-drift side forming a gradually deepening pit-like indentation and the down-drift side being steeper (). Berms or surcharges typically form at the down-drift side of each asymmetrical pit before the iceberg keel detaches from the seafloor on the rising tide. This asymmetry therefore provides a useful indicator of palaeo-current direction, given that iceberg drift is a response mainly to currents rather than wind forcing because about 80–90 percent of a given iceberg is below the sea-surface (Woodworth-Lynas et al. Citation1991).
Chains of circular pits
Description
In a single location on the mid-Norwegian upper slope (), a chain of circular pits, fully separated from one another, has been observed (, ). Within this chain, the average pit depth is 1.6 m; the average pit length and width are 47 and 48 m, reflecting the symmetry of these features.
Interpretation
These typically equidimensional shallow and self-contained pits are interpreted to have been formed where iceberg keels are largely free-floating and only touch the seafloor close to successive low tides as they drift. Hence, iceberg keels impact the seafloor only lightly and for short periods by comparison with the examples illustrated in . This interpretation is supported by the limited development of berms associated with sediment being pushed up by the plowing action of the drifting iceberg keels (). Bass and Woodworth-Lynas (Citation1988) described pit-chains of similar morphology from side-scan sonar images of the Labrador Shelf, which they related to the keel of a single iceberg that rolls and impacts the seafloor intermittently rather than to tidal motion.
Results: dimensions of tidally influenced iceberg ploughmarks
The dimensions of the three types of curvilinear depressions and chains of asymmetrical or circular pits (), which we have interpreted to be a product of intermittent iceberg grounding on the sedimentary seabed under the influence of tidal motion, have been systematically recorded by visual inspection and subsequent digitization of bathymetric data from the mid-Norwegian upper slope (). The features were discovered during regional work for the MAREANO program, which is concerned with mapping the seafloor around Norway (Bøe et al. Citation2020). The apparent rarity of pit-chains, both in our study area and the wider literature, is probably a result of the delicate interplay between iceberg-keel geometry, seafloor morphology, and tidal effects that is required in order for them to form.
We have identified and mapped several tidally influenced ploughmarks on the upper slope beyond the mid-Norwegian shelf (). In this area, the upper continental slope between 410 and 460 m in depth has a gradient of about 0.5°, but its surface is irregular because it is composed of a series of glacigenic debris flows (e.g., Laberg and Vorren Citation1995; King et al. Citation1998; Laberg and Dowdeswell Citation2016), giving the slope a mounded appearance (). Ploughmark dimensions are reported as IPMS 1 to 9 in , which is broken down into measurements relating to ploughmarks of each of the three types illustrated in . The two longest ploughmarks, IPMs 1 and 5, are subdivided into several segments because tidally influenced features are not found along their entire lengths ().
IPMs 1 to 8 are located along an approximately 40 km-long stretch of the upper slope, whereas IPM9 occurs some 20 km farther south (). All of the IPMs are linear or curvilinear features with a SW-NE long-axis orientation and are either continuous pitted ploughmarks or comprise chains of asymmetrical or circular pits along their center-lines (). Examples of bathymetric data showing continuous ploughmarks with regular depressions are illustrated for IPMs 6 and 2 in . An example of a ploughmark with individual asymmetrical pits from IPM 7 is shown in . One segment of IPM6 also shows an area of deepening water where a transition from a ploughmark with continuous depressions to individual asymmetrical pits takes place (). In more detail, the deepest water along the line of the ploughmark has a smooth seafloor, where contact with the iceberg keel has been lost, with individual pits of increasing asymmetry occurring to either side as the water shallows ().
Ploughmarks IPM1, IPM2, IPM3, IPM4, and IPM5 are aligned in almost exactly the same orientation along the upper slope (). It is possible, therefore, that these ploughmarks may have been formed by the keel of the same iceberg. The total length of these five ploughmarks is 36 km (); the spacing of center-line depressions and pits leads to a calculated mean drift velocity of 10 m hr−1 implying that, if this was a single iceberg, it took about 150 days to produce the 36 km-long feature.
Variations in pit spacing: implication for iceberg drift rates
Several factors influence the drift velocity of a plowing iceberg, including ocean-current velocity, water depth, sediment geotechnical properties, and the shape and size of the iceberg keel (noting that icebergs can be multi-keeled with several protuberances at the base; e.g., Batchelor et al. Citation2016). We have measured the distances between successive pits and, from this, have calculated the hourly drift velocity of icebergs along different segments of a number of ploughmarks by dividing the distance between sequential pits by 12 hr 25 min; this represents the time interval between successive low tides. To generate relatively robust velocity values, we have averaged distance values across several pits in a chain; the resulting iceberg drift velocities are given in .
The average velocity for each chain of pits on the upper slope varies between 5.5 and 14.2 m hr−1, which implies that the icebergs drift between 132 and 340 m per day or 4 to 10 km per month. Generally, the drifting velocities of the plowing icebergs appear relatively consistent; for example, IPM 1 varies between 5.5 and 8.1 m hr−1 along its four segments (). On a broad scale, there is some evidence that iceberg drift velocities increase slightly toward the northeast, from 5–8 m hr−1 (IPMs 1, 2, 9) to 7–14 m hr−1 (IPM 3–8), although the sample size is relatively small ().
The drift rates of modern icebergs have been observed using satellite and GPS systems (e.g., Schodlock et al. Citation2006). Modern data show that relatively large icebergs in the Weddell Sea (with keels between 80 and 550 m deep) drift at about 40 m hr−1. Icebergs in the Canadian Arctic north of 67°N have been monitored at about 130 m hr−1, whereas smaller icebergs off Labrador may reach speeds of over 500 m hr−1, although wind may play an increasing part in total drift rates for small bergs. These drift rates are higher than those we calculate from our morphological evidence on the spacing of pits from the mid-Norwegian margin formed during Late Weichselian glaciation. This is to be expected, however, since our data relate to partially grounded icebergs rather than those that are free-floating and can therefore travel greater distances, as in the modern observations.
Discussion: iceberg sources, timing and implications for ocean currents
Sources and timing of iceberg occurrence on the mid-Norwegian margin
The major source of icebergs to the mid-Norwegian shelf and slope is likely to have been fast-flowing ice streams draining from the Late Weichselian Scandinavian Ice Sheet. Ottesen, Dowdeswell, and Rise (Citation2005) have reconstructed the western marine-terminating margin of the ice sheet, identifying fast-flowing ice streams located in cross-shelf troughs and more passive ice on the intervening shallower banks (). The largest ice stream was the Norwegian Channel Ice Stream which terminated at the shelf break in west Norway at 62°N. This ice stream has eroded the Norwegian Channel during the last few glaciations (Sejrup et al. Citation2003; Rise et al. Citation2004; Ottesen et al. Citation2016). Farther north, a number of smaller palaeo-ice streams were present on the mid-Norwegian shelf () (e.g., Ottesen, Dowdeswell, and Rise Citation2005; Montelli et al. Citation2017).
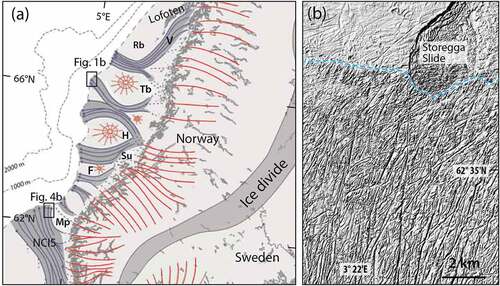
Figure 4. (a) Map of the late Weichselian ice streams draining the Scandinavian Ice Sheet at the LGM (from Ottesen, Dowdeswell, and Rise Citation2005). Purple lines with arrowheads are ice streams in cross-shelf troughs, red circular symbols are slower-moving ice on shallow banks, and red lines represent flow-directions from the ice-sheet interior. NCIS – Norwegian Channel Ice Stream, Mp – Måløy Plateau, F – Frøyabanken, H – Haltenbanken, Su – Suladjupet, Tb – Trænabanken, Rb – Røstbanken, V–Vestfjorden. (b) Multibeam bathymetric image of iceberg ploughmarks in the outer part of the Norwegian Channel (). Note the dominant S-N trend of the ploughmarks. The shelf edge (stippled blue line) is at a water depth of about 440 m. Bathymetric data: ©Kartverket.
Such fast-flowing ice streams operate in Antarctica and Greenland today (e.g., Mouginot et al. Citation2017) and are known as effective agents for the transport of both ice and sediments. Similar Quaternary ice streams, producing large volumes of icebergs as a result of their high velocities, are exemplified by the palaeo-ice stream exiting through Hudson Strait from a huge interior drainage basin of the Laurentide Ice Sheet and delivering armadas of deep-keeled icebergs into the North Atlantic (Bond and Lotti Citation1995; Dowdeswell et al. Citation1995; Metz, Dowdeswell, and Woodworth-Lynas Citation2008).
Relating specifically to the Late Weichselian ice stream draining through the Norwegian Channel, Nygård et al. (Citation2007) calculated the ice flux for the Norwegian Channel Ice Stream between 20 and 19 ka. An estimated ice velocity of 2.7 km yr−1 yielded an ice flux of 135 km3 yr−1. This ice volume would produce very large numbers of icebergs which would initially drift north and then northeastwards following the Norwegian Atlantic Current along the Norwegian margin (). The extensive pattern of iceberg ploughmarks on the seafloor in the outer part of the Norwegian Channel is shown in . The overall direction of ploughmarks in the Norwegian Channel is from S-N, demonstrating that drifting icebergs were produced at the retreating terminus of the Norwegian Channel Ice Stream. The modern water depth at the channel mouth is about 450 m, implying that deep-keeled icebergs could have been generated from this source which is the deepest part of the outer shelf along the entire mid-Norwegian margin. Given that the pits we describe are found in modern water depths of 410 to 450 m, a full- or early-deglacial timing for the production of the parent icebergs suggests keel depths of about 300 m given Last Glacial Maximum (LGM) sea-level depression of about 120 m (e.g., Lambeck et al. Citation2014).
There are few radiocarbon dates for the early phase of deglaciation on the mid-Norwegian shelf apart from the Norwegian Channel area to the south (). Nygård et al. (Citation2007) documented that the last active phase of the Norwegian Channel Ice Stream was between 20 and 19 ka ago. It is likely that many of the icebergs drifting along the mid-Norwegian margin came from the Norwegian Channel Ice Stream during the early-phase of deglaciation of this area. Morén et al. (Citation2018) concluded that the grounding-line of this ice stream began to retreat from the shelf edge about 19,000 years ago and that the inner Skagerrak was ice-free by 17.6 ka. Rokoengen and Frengstad (Citation1999) reported two dates from the outer part of the mid-Norwegian shelf of 15,320 ± 115 and 13,545 ± 85 14C yr BP. These are maximum ages for deglaciation, suggesting that the entire shelf was deglaciated in a few thousand years. Knies et al. (Citation2007) suggested deglaciation from the shelf edge around 18 ka (c. 15,000 14C years) and Vorren and Plassen (Citation2002) dated deglaciation in Andfjorden, north of our study area (), at 14.7 14C yr BP. In addition, the oldest deglacial dates in the coastal areas of mid-Norway are around 17.5 ka ago according to Olsen et al. (Citation2013) and this also suggests the relatively early deglaciation of the mid-Norwegian shelf.
Ocean current directions and iceberg drift rates
The dominant ocean current on the mid-Norwegian margin is the Norwegian Atlantic Current (NAC) which transports warm water from the Gulf of Mexico across the North Atlantic and into the Barents Sea and Arctic Ocean north of Norway (yellow in ). A western branch passes between Iceland and the Faroes, and an eastern branch flows north of the British Islands and through the Faroe-Shetland Channel and into the Norwegian Sea west of Norway (Orvik and Niiler Citation2002). The NAC follows the continental slope west of mid-Norway with an average velocity of 10 to 30 cm s−1 (36 to 108 m hr−1). In addition, the Norwegian Coastal Current (NCC) flows northwards on the inner shelf and along the coastal areas outside mid-Norway and the Lofoten Islands toward the Barents Sea (red line in ) (Sætre Citation2007).
The generally SW-NE orientation of iceberg ploughmarks on the mid-Norwegian margin implies that this was the drift direction at the time icebergs were last present in the region during full-glacial and deglacial times about 20–15,000 years ago. The asymmetry of some grounding pits () confirms that the actual direction of drift was to the northeast and, thus, that the NAC did not reverse under full-glacial conditions (e.g., Montelli et al. Citation2018; Newton, Huuse, and Brocklehurst Citation2018).
The present current speed of the NAC (10 to 30 cm s−1) is equivalent to a velocity of 36 to 108 m hr−1, remembering also that the North Atlantic Meridional Overturning Circulation (NAMOC) has been stronger during much of the last glacial cycle (e.g., Rahmstorf Citation2002; Böhm et al. Citation2015). The modern speed is considerably higher than the drift rate we have calculated for icebergs which is between about 5 and 15 m hr−1 (). This difference is likely to be related to the following factors: (i) slower NAC current speeds during deglacial stages of the Late Weichselian glaciation when iceberg production from the marine-terminating ice sheet was at a maximum; (ii) the retardation of icebergs resulting from partial grounding and plowing of the sedimentary seafloor; and (iii) that icebergs will tend to drift at a slower speed than the prevailing currents due to their mass. Our data cannot be used to distinguish quantitatively between these options, but it is certain that increased friction associated with iceberg grounding and plowing must have played some part in slowing the drift of icebergs as they moved northwards along the Norwegian margin.
Conclusions
In this study, high-resolution multibeam-bathymetric data were used to survey nine iceberg ploughmarks with well-developed chains of regularly spaced pits from the upper continental slope on the mid-Norwegian margin ().
These distinctive iceberg ploughmarks and pits are interpreted to have a clear tidal imprint (). This allows calculation of the drift velocity of the icebergs that formed the ploughmarks.
The features take three forms, although there is a morphological continuum between them: (i) pitted depressions, and chains of distinctive (ii) asymmetrical or (iii) circular pits up to a few meters deep (, ). The distance between such pits is rather regular and varies between 70 and 175 m. This represents the interval between successive low tides, which gives average iceberg drift velocities of between 5 and 15 m hr−1 (). This is slower than the drift rate of free-floating modern icebergs, probably as a result of frictional retardation during ploughmark formation.
The asymmetrical pits often have a downstream surcharge or berm (), making it possible to determine the direction of iceberg drift and, therefore, the current direction at the time of ploughmark formation. Iceberg drift to the northeast during regional deglaciation is similar to the direction of the modern North Atlantic Current.
A large proportion of the ploughmarks on the upper slope of the mid-Norwegian shelf probably originated from deep-keeled icebergs produced by the Norwegian Channel Ice Stream during early deglaciation of the outer shelf around 19,000 years ago ().
Acknowledgments
We thank members of the Norwegian MAREANO program for collection and processing of the multibeam data used in this study (www.kartverket.no). We are grateful to reviewers Andrew Newton and Hans Petter Sejrup for their helpful comments and suggestions. Erik Hårberg drew the figures.
Disclosure statement
No potential conflict of interest was reported by the author(s).
References
- Arndt, J. E., and M. Forwick. 2016. Deep-water iceberg ploughmarks on Hovgaard Ridge, Fram Strait. In Atlas of submarine glacial landforms: Modern, Quaternary and ancient, ed. J. A. Dowdeswell, M. Canals, M. Jakobsson, B. J. Todd, E. K. Dowdeswell, and K. A. Hogan, Vol. 46, 285–86. London, Memoir: Geological Society.
- Barrie, J. V., C. F. M. Lewis, D. R. Parrott, and W. T. Collins. 1992. Submersible observations of an iceberg pit and scour on the Grand Banks of Newfoundland. Geo-Marine Letters 12:1–6. doi:10.1007/BF02092101.
- Bass, D. W., and C. Woodworth-Lynas. 1988. Iceberg crater marks on the sea floor, Labrador Shelf. Marine Geology 79:243–60. doi:10.1016/0025-3227(88)90041-2.
- Batchelor, C. L., J. A. Dowdeswell, E. K. Dowdeswell, and B. J. Todd. 2016. A subglacial landform assemblage on the outer shelf of M’Clure Strait, Canadian Arctic, ploughed by iceberg keels. In Atlas of submarine glacial landforms: Modern, Quaternary and ancient, ed. J. A. Dowdeswell, M. Canals, M. Jakobsson, B. J. Todd, E. K. Dowdeswell, and K. A. Hogan, Vol. 46, 337–40. London: Geological Society.
- Batchelor, C. L., A. Montelli, D. Ottesen, J. Evans, E. K. Dowdeswell, F. D. W. Christie, and J. A. Dowdeswell. 2020. New insights into the formation of submarine glacial landforms from high-resolution geophysical data acquired from Autonomous Underwater Vehicles. Geomorphology 370:107396. doi:10.1016/j.geomorph.2020.107396.
- Belderson, R. H., and J. B. Wilson. 1973. Iceberg plough marks in the vicinity of the Norwegian Trough. Norwegian Journal of Geology 53:323–28.
- Bjarnadóttir, L. R., D. Ottesen, J. A. Dowdeswell, and T. Bugge. 2016. Unusual iceberg ploughmarks on the Norwegian continental shelf. In Atlas of submarine glacial landforms: Modern, Quaternary and ancient, ed. J. A. Dowdeswell, M. Canals, M. Jakobsson, B. J. Todd, E. K. Dowdeswell, and K. A. Hogan, Vol. 46, 283–84. London: Geological Society.
- Bøe, R., L. R. Bjarnadóttir, S. Elvenes, M. Dolan, V. Bellec, T. Thorsnes, A. Lepland, and O. Longva. 2020. Revealing the secrets of Norway´s seafloor – Geological mapping within the MAREANO Programme and in coastal areas. In From continental shelf to slope: Mapping the oceanic realm, ed. K. Asch, H. Kitazato, and H. Vallius, Vol. 505, 13. Geological Society, London, Special Publications. doi:10.1144/SP505-2019-82.
- Böhm, E., J. Lippold, M. Gutjahr, M. Frank, P. Blaser, B. Antz, J. Fohlmeister, N. Frank, M. B. Andersen, and M. Deininger. 2015. Strong and deep Atlantic meridional overturning curculation during the last glacial cycle. Nature 517:73–76. doi:10.1038/nature14059.
- Bond, G. C., and R. Lotti. 1995. Iceberg discharges into the North Atlantic on millennial timescales during the last glaciation. Science 267:1005–10. doi:10.1126/science.267.5200.1005.
- Brown, C. S., A. M. W. Newton, M. Huuse, and F. Buckley. 2017. Iceberg scours, pits, and pockmarks in the North Falklands Basin. Marine Geology 386:140–52. doi:10.1016/j.margeo.2017.03.001.
- Carsola, A. J. 1954. Microrelief on the Arctic sea floor. Bulletin of the American Association of Petroleum Geologists 38:1587–601.
- Dahlgren, K. T., T. O. Vorren, M. S. Stoker, T. Nielsen, A. Nygård, and H. P. Sejrup. 2005. Late Cenozoic prograding wedges on the NW European continental margin: Their formation and relationship to tectonics and climate. Marine and Petroleum Geology 22:1089–110. doi:10.1016/j.marpetgeo.2004.12.008.
- Dowdeswell, J. A., H. Villinger, R. Whittington, and P. Marienfield. 1993. Iceberg scouring in Scoresby Sund and on the East Greenland continental shelf. Marine Geology 111:37–53. doi:10.1016/0025-3227(93)90187-Z.
- Dowdeswell, J. A., M. A. Maslin, J. T. Andrews, and I. N. McCave. 1995. Iceberg production, debris rafting, and the extent and thickness of Heinrich layers (H-1, H-2) in North Atlantic sediments. Geology 23:301–04. doi:10.1130/0091-7613(1995)023<0297.
- Dowdeswell, J. A., and J. L. Bamber. 2007. Keel depths of modern Antarctic icebergs and implications for sea-floor scouring in the geological record. Marine Geology 243:120–31. doi:10.1016/j.margeo.2007.04.008.
- Dowdeswell, J. A., and D. Ottesen. 2013. Buried iceberg ploughmarks in the early Quaternary sediments of the central North Sea: A two-million-year record of glacial influence from 3D seismic data. Marine Geology 344:1–9. doi:10.1016/j.margeo.2013.06.019.
- Dowdeswell, J. A., M. Canals, M. Jakobsson, B. J. Todd, E. K. Dowdeswell, and K. A. Hogan, eds. 2016. Atlas of submarine glacial landforms: Modern, Quaternary and ancient, Vol. 46. London: Geological Society. 612 pp.
- Gales, J. A., R. D. Larter, and P. T. Leat. 2016. Iceberg ploughmarks and associated sediment ridges on the southern Weddell Sea margin. In Atlas of submarine glacial landforms: Modern, Quaternary and ancient, ed. J. A. Dowdeswell, M. Canals, M. Jakobsson, B. J. Todd, E. K. Dowdeswell, and K. A. Hogan, Vol. 46, 289–90. London: Geological Society.
- Harris, I. M., and P. G. Jollymore. 1974. Iceberg furrow marks on the continental shelf northeast of Belle Isle, Newfoundland. Canadian Journal of Earth Sciences 11:43–52. doi:10.1139/e74-004.
- Hill, J. C. 2016. Iceberg ploughmarks on the upper continental slope, South Carolina. In Atlas of submarine glacial landforms: Modern, Quaternary and ancient, ed. J. A. Dowdeswell, M. Canals, M. Jakobsson, B. J. Todd, E. K. Dowdeswell, and K. A. Hogan, Vol. 46, 271–72. London: Geological Society.
- Hovland, M., and A. G. Judd. 1988. Seafloor pockmarks and seepages: Impact on geology, biology and the marine environment. London: Graham and Trotman.
- Jakobsson, M., J. B. Anderson, F. Nitsche, J. A. Dowdeswell, R. Gyllencreutz, N. Kirchner, R. Mohammad, M. O’Regan, R. B. Alley, S. Anandakrishnan, et al. 2011. Geological record of ice shelf break-up and grounding line retreat, Pine Island Bay, West Antarctica. Geology 39:691–94. doi:10.1130/G32153.1.
- Jakobsson, M., and M. O’Regan. 2016. Deep iceberg ploughmarks in the central Arctic Ocean. In Atlas of submarine glacial landforms: Modern, Quaternary and ancient, ed. J. A. Dowdeswell, M. Canals, M. Jakobsson, B. J. Todd, E. K. Dowdeswell, and K. A. Hogan, Vol. 46, 287–88. London: Geological Society.
- Jakobsson, M., R. Gyllencreutz, L. A. Mayer, J. A. Dowdeswell, M. Canals, B. J. Todd, E. K. Dowdeswell, K. A. Hogan, and R. D. Larter. 2016. Mapping submarine glacial landforms using acoustic methods. In Atlas of submarine glacial landforms: Modern, Quaternary and ancient, ed. J. A. Dowdeswell, M. Canals, M. Jakobsson, B. J. Todd, E. K. Dowdeswell, and K. A. Hogan, Vol. 46, 17–40. London: Geological Society.
- King, E. L., H. Haflidason, H. P. Sejrup, and R. Løvlie. 1998. Glacigenic debris flows on the North Sea Trough Mouth Fan during ice stream maxima. Marine Geology 152:217–46. doi:10.1016/S0025-3227(98)00072-3.
- Knies, J. M., C. Vogt, J. Matthiessen, S. Nam, D. Ottesen, L. Rise, T. Bargel, and R. S. Eilertsen. 2007. Re-advance of the Fennoscandian Ice Sheet during Henrich Event 1. Marine Geology 240:1–18. doi:10.1016/j.margeo.2007.01.006.
- Kovacs, A. 1972. Ice scouring marks on the floor of the Arctic shelf. Oil and Gas 70:93–106.
- Kuijpers, A., F. Dalhoff, M. P. Brandt, P. Humbs, T. Schott, and A. Zotova. 2008. Giant iceberg ploughmarks at more than 1 km water depth offshore West Greenland. Marine Geology 246:60–64. doi:10.1016/j.margeo.2007.05.010.
- Laberg, J. S., and T. O. Vorren. 1995. Late Weichselian submarine debris flow deposits on the Bear Island Trough Mouth Fan. Marine Geology 127:45–72. doi:10.1016/0025-3227(95)00055-4.
- Laberg, J. S., and J. A. Dowdeswell. 2016. Glacigenic debris-flow deposits on the Bear Island Trough-Mouth Fan, Barents Sea margin. In Atlas of submarine glacial landforms: Modern, Quaternary and ancient, ed. J. A. Dowdeswell, M. Canals, M. Jakobsson, B. J. Todd, E. K. Dowdeswell, and K. A. Hogan, Vol. 46, 367–68. London: Geological Society.
- Lambeck, K., H. Rouby, A. Purcell, Y. Sun, and M. Sambridge. 2014. Sea level and global ice volumes from the Last Glacial Maximum to the Holocene. Proceedings of the National Academy of Sciences 111:15296–303. doi:10.1073/pnas.1411762111.
- Lewis, C. F. M., B. J. Todd, G. V. Sonnichsen, and T. King. 2016. Iceberg-seabed interaction on northwestern Makkovik Bank, Labrador Shelf, Canada. In Atlas of submarine glacial landforms: Modern, Quaternary and ancient, ed. J. A. Dowdeswell, M. Canals, M. Jakobsson, B. J. Todd, E. K. Dowdeswell, and K. A. Hogan, Vol. 46, 279–80. London, Memoir: Geological Society.
- Lien, R. 1983. Pløyemerker etter isfjell på norsk kontinentalsokkel. IKU Publication 109:147.
- Lopez-Martinez, J., A. Munoz, J. A. Dowdeswell, C. Lines, and J. Acosta. 2011. Relict sea-floor ploughmarks record deep-keeled Antarctic icebergs to 45°S on the Argentine margin. Marine Geology 288:43–48. doi:10.1016/j.margeo.2011.08.002.
- Lopez-Martinez, J., J. Rivera, J. A. Dowdeswell, and J. Acosta. 2016. Giant ploughmarks on the South Patagonian margin produced by Antarctic icebergs. In Atlas of submarine glacial landforms: Modern, Quaternary and ancient, ed. J. A. Dowdeswell, M. Canals, M. Jakobsson, B. J. Todd, E. K. Dowdeswell, and K. A. Hogan, Vol. 46, 273–74. London, Memoir: Geological Society.
- MacAyeal, D. R., M. H. Okal, J. E. Thom, K. M. Brunt, Y. Kim, and A. K. Bliss. 2008. Tabular iceberg collisions within the coastal regime. Journal of Glaciology 54:371–86. doi:10.3189/002214308784886180.
- Metz, J. M., J. A. Dowdeswell, and C. M. T. Woodworth-Lynas. 2008. Sea-floor scour at the mouth of Hudson Strait by deep-keeled icebergs from the Laurentide Ice Sheet. Marine Geology 253:149–59. doi:10.1016/j.margeo.2008.05.004.
- Montelli, A., J. A. Dowdeswell, D. Ottesen, and S. E. Johansen. 2017. Ice-sheet dynamics through the Quaternary on the mid-Norwegian continental margin inferred from 3D seismic data. Marine and Petroleum Geology 80:228–42. doi:10.1016/j.marpetgeo.2016.12.002.
- Montelli, A., J. A. Dowdeswell, D. Ottesen, and S. E. Johansen. 2018. 3D seismic evidence of buried iceberg ploughmarks from the mid-Norwegian continental margin reveals largely persistent North Atlantic Current through the Quaternary. Marine Geology 399:66–83. doi:10.1016/j.margeo.2017.11.016.
- Morén, B. M., H. P. Sejrup, B. Hjelstuen, M. V. Borge, and C. Schäuble. 2018. The last deglaciation of the Norwegian Channel – Geomorphology, stratigraphy and radiocarbon dating. Boreas 47:347–66. doi:10.1111/bor.12272.
- Mouginot, J., E. Rignot, B. Scheuchl, and R. Millan. 2017. Comprehensive annual ice sheet velocity mapping using Landsat-8, Sentinel-1, and RADARSAT-2 data. Remote Sensing 9:364. doi:10.3390/rs9040364.
- Newton, A. M. W., M. Huuse, and S. H. Brocklehurst. 2016. Buried iceberg scours reveal reduced North Atlantic Current during the stage 12 deglacial. Nature Communications 7. doi:10.1038/ncomms10927.
- Newton, A. M. W., M. Huuse, and S. H. Brocklehurst. 2018. A persistent Norwegian Atlantic Current during the Pleistocene glacials. Geophysical Research Letters 45:5599–608. doi:10.1029/2018GL077819.
- Nygård, A., H. P. Sejrup, H. Haflidason, W. A. H. Lekens, C. D. Clark, and G. R. Bigg. 2007. Extreme sediment and ice discharge from marine-based ice streams: New evidence from the North Sea. Geology 35:395–98. doi:10.1130/G23364A.1.
- Olsen, L., H. Sveian, D. Ottesen, and L. Rise. 2013. Quaternary glacial, interglacial and interstadial deposits of Norway and adjacent onshore and offshore areas. In Quaternary Geology of Norway, ed. L. Olsen, O. Fredin, and O. Olesen, Vol. 13, 79–144. Geological Survey of Norway Special Publication.
- Orvik, K. A., and P. Niiler. 2002. Major pathways of Atlantic water in the northern North Atlantic and Nordic Seas toward Arctic. Geophysical Research Letters 29:2-1-2–4. doi:10.1029/2002GL015002.
- Ottesen, D., J. A. Dowdeswell, and L. Rise. 2005. Submarine landforms and the reconstruction of fast-flowing ice streams within a large Quaternary ice sheet: The 2,500 km-long Norwegian-Svalbard margin (57°N to 80°N). Geological Society of America Bulletin 117:1033–50. doi:10.1130/B25577.1.
- Ottesen, D., L. Rise, E. S. Andersen, T. Bugge, and T. Eidvin. 2009. Geological evolution of the Norwegian continental shelf between 61°N and 68°N during the last 3 million years. Norwegian Journal of Geology 89:251–65.
- Ottesen, D., C. R. Stokes, R. Bøe, L. Rise, O. Longva, T. Thorsnes, O. Olesen, T. Bugge, A. Lepland, and O. B. Hestvik. 2016. Landform assemblages and sedimentary processes along the Norwegian Channel Ice Stream. Sedimentary Geology 338:115–37. doi:10.1016/j.sedgeo.2016.01.024.
- Rahmstorf, S. 2002. Ocean circulation and climate during the past 120,000 years. Nature 419:207–14. doi:10.1038/nature01090.
- Rex, R. W. 1955. Microrelief produced by sea ice grounding in the Chukchi Sea near Barrow, Alaska. Arctic 8:177–86. doi:10.14430/arctic3817.
- Rise, L., O. Olesen, K. Rokoengen, D. Ottesen, and F. Riis. 2004. Mid-Pleistocene ice drainage pattern in the Norwegian Channel imaged by 3D seismic. Quaternary Science Reviews 23:2323–35. doi:10.1016/j.quascirev.2004.04.005.
- Rise, L., D. Ottesen, K. Berg, and E. Lundin. 2005. Large-scale development of the mid-Norwegian margin during the last 3 million years. Marine and Petroleum Geology 22:33–44. doi:10.1016/j.marpetgeo.2004.10.010.
- Rokoengen, K., and B. Frengstad. 1999. Radiocarbon and seismic evidence of ice-sheet extent and the last deglaciation on the mid-Norwegian continental shelf. Norwegian Journal of Geology 79:129–32.
- Sætre, R. 2007. The Norwegian Coastal Current: Oceanography and Climate. Trondheim: Tapir Academic Press.
- Schodlock, M. P., H. Hellmer, G. Rohardt, and E. Fahrbach. 2006. Weddell Sea iceberg drift: Five years of observations. Journal of Geophysical Research 111:1–46. doi:10.1029/2004JC002661.
- Sejrup, H. P., E. Larsen, H. Haflidason, I. M. Berstad, B. Hjelstuen, H. Jonsdottir, E. L. King, J. Landvik, O. Longva, A. Nygård, et al. 2003. Configuration, history and impact of the Norwegian Channel Ice Stream. Boreas 32:18–36. doi:10.1080/03009480310001029.
- Stewart, T. J., V. M. Stagpoole, R. A. Wood, and L. Carter. 2016. Ploughmarks and pits on the Chatham Rise: A record of deep-keeled Antarctic icebergs at 43°20ʹS. In Atlas of submarine glacial landforms: Modern, Quaternary and ancient, ed. J. A. Dowdeswell, M. Canals, M. Jakobsson, B. J. Todd, E. K. Dowdeswell, and K. A. Hogan, Vol. 46, 275–76. London, Memoir: Geological Society.
- Syvitski, J. P. M., A. B. Stein, J. T. Andrews, and J. D. Milliman. 2001. Icebergs and the sea floor of the East Greenland (Kangerlussuaq) Continental Margin. Arctic, Antarctic and Alpine Research 1:52–61. doi:10.1080/15230430.2001.12003404.
- Vorren, T. O., and L. Plassen. 2002. Deglaciation and palaeoclimate of the Andfjorden-Vågsfjord area, North Norway. Boreas 31:97–125. doi:10.1080/030094802320129926.
- Wise, M. G., J. A. Dowdeswell, R. D. Larter, and M. Jakobsson. 2017. Iceberg-keel ploughmarks provide evidence for rapid calving and retreat of the West Antarctic Ice Sheet resulting from marine ice-cliff instability. Nature 550:506–10. doi:10.1038/nature24458.
- Woodworth-Lynas, C. M. T., H. W. Josenhans, J. V. Barrie, C. F. M. Lewis, and D. R. Parrott. 1991. The physical processes of seabed disturbance during iceberg grounding and scouring. Continental Shelf Research 11:939–61. doi:10.1016/0278-4343(91)90086-L.