
 ?Mathematical formulae have been encoded as MathML and are displayed in this HTML version using MathJax in order to improve their display. Uncheck the box to turn MathJax off. This feature requires Javascript. Click on a formula to zoom.
ABSTRACT
Dolomites in Arctic Ocean sediments are widely attributed to erosion and transport of sediments from northern Canada and Greenland. Coarse-grained dolomite-rich ice-rafted debris is often linked to iceberg transport, but the origin of fine-grained dolomite is less well constrained. A presumed source is the Mackenzie River. In this article, we fingerprint the minerogenic and isotopic (Nd and Sr) composition of deglacial and Holocene fine-grained sediments (<38 μm) from the shallow Mackenzie Trough. Sediments from an 81.5-m borehole (MTW01) were analyzed. The borehole is composed of a progradational (deltaic), transitional (transgressive), and marine unit (<9.4 cal. ka BP). The average dolomite content (~7 percent) and ɛNd signals (−13.3) are surprisingly constant in the progradational and marine units. The isotopic signature is inherited from the Interior Platform, the major underlying bedrock region of the Mackenzie River mainstream. The transitional unit contains fluctuations in ɛNd (−11.0 and −14.6), reflecting enhanced input from the North American Cordillera and Canadian Shield that are not associated with elevated amounts of dolomite. Additional studies combining minerogenic and detrital ɛNd analyses from sites proximal to the paleo-icestreams draining the Canadian Arctic are required to ascertain the origin of dolomite enrichment in central Arctic Ocean sediments.
Introduction
The composition of terrigenous marine sediments in the central Arctic Ocean reflect interactions between riverine inputs and terrestrial runoff, ocean circulation, sea ice drift, and the dynamics of circum-Arctic ice sheets, which extended across large parts of the continental shelves during past glacial periods (Stein Citation2008; Jakobsson et al. Citation2014; Wegner et al. Citation2015). On many topographic highs within the Arctic Ocean, terrigenous sediments are largely composed of sea ice and iceberg-rafted material (Stein Citation2008), although the contribution from suspended sediments carried in different water masses remains uncertain. The mineral and isotopic (i.e., Nd, Sr, Pb) composition of these sediments can, in some instances, be used to identify their provenance, or source region (e.g., Fagel et al. Citation2014; Maccali, Hillaire-Marcel, and Not Citation2018). This provides a powerful tool for paleoceanographic reconstructions. For example, provenance studies of arctic sediments have been used to reconstruct ice drift patterns during glacial periods (Bischof, Clark, and Vincent Citation1996; Phillips and Grantz Citation2001), interpret the configuration and calving dynamics of continental ice sheets (Darby et al. Citation1989, Citation2002; Spielhagen et al. Citation2004; Stokes et al. Citation2005; Polyak et al. Citation2009; Kaparulina, Strand, and Lunkha Citation2016; Bazhenova, Fagel, and Stein Citation2017; Dong et al. Citation2017), identify the inception of perennial sea ice in the Arctic (Krylov et al. Citation2008; Darby Citation2014), and investigate millennial-scale dynamics in oceanic gateway exchanges (Darby et al. Citation2012).
The clay and heavy mineral composition of surface sediments from some arctic continental shelves (Barents, Kara, Laptev, East Siberian and Alaskan) have been fairly well documented and tied to the geology of the surrounding landmasses (Stein [Citation2008] and references therein). Although no single mineral is uniquely associated to a local region (Stein Citation2008; Darby et al. Citation2011), some minerals and mineral assemblages can be convincingly tied to different areas of the Arctic. For example, the clay mineral smectite is most abundant in the Kara Sea region of the Arctic, due to weathering of the Putorana flood basalts (Vogt and Knies Citation2008). Dolomite in arctic sediments is widely associated with weathering of outcropping Paleozoic dolomites and limestones that extend across the Canadian Arctic Archipelago and exist as far east as Northern Greenland (Krawitz Citation1982; Harrison et al. Citation2011; ), although some ocean bottom outcrops in the Amerasian Basin have also been described (Skolotnev, Fedonkin, and Korniychuk Citation2017). The input of fine and coarse fraction dolomites from this broad area has resulted in Arctic Ocean sediments being considered some of the most dolomite-rich marine sediments worldwide (Darby et al. Citation1989; Stein Citation2008). This is exemplified by the often described and recurrent “pink layers” found in Pleistocene sediment cores from the Amerasian Basin (Clark et al. Citation1980; Stein et al. Citation2010; Bazhenova, Fagel, and Stein Citation2017), which can contain more than 50 wt% of dolomite in the <63 μm size fraction (Dong et al. Citation2017).
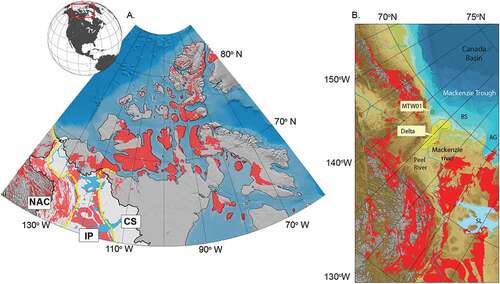
Figure 1. (a) Northern Canada and regions of carbonate bedrock (red). The Mackenzie River drainage area is outlined in black and shaded in opaque white. Yellow dashed lines separate the three major bedrock provinces in the Mackenzie basin. (b) Location of MTW01 in the Mackenzie Trough offshore the Mackenzie River mouth. Carbonate bearing bedrock (dolostones and limestones) in red (Harrison et al. Citation2011). Yellow area is the Mackenzie River Delta. SL = Great Slave Lake. Base map from International Bathymetric Chart of the Arctic Ocean (IBCAO) (Jakobsson et al. Citation2008).
Historically, the dolomite content of central Arctic Ocean sediments was more commonly investigated in the coarser fractions (>63 µm) and used as a proxy for iceberg delivered material calved from the Laurentide and Innuitian ice sheets (Clark et al. Citation1980; Bischof, Clark, and Vincent Citation1996; Phillips and Grantz Citation2001; Spielhagen et al. Citation2004). Although elevated dolomite abundances in Pleistocene sediments from the Amerasian Basin are generally accompanied by an overall increase in the >63 µm fraction, the dominant proportion of dolomite is still found in the <63 μm fraction (Carrol Citation1970; Dalrymple and Maas Citation1987; Darby et al. Citation1989; Vogt Citation1997).
To better discriminate between the sources of dolomite in Arctic Ocean sediments, measurements of radiogenic isotopes (Sr, Nd, and Pb) have been investigated in a number of recent studies (Not and Hillaire-Marcel Citation2012; Hillaire-Marcel et al. Citation2013; Fagel et al. Citation2014; Bazhenova, Fagel, and Stein Citation2017; Maccali, Hillaire-Marcel, and Not Citation2018; Dong et al. Citation2020; Wang et al. Citation2021; Xiao et al. Citation2021; Schwab et al. Citation2021). One focus of these studies is on the mineral and isotopic composition of sediments from the Canadian Beaufort Sea shelf and the wider Canadian Arctic Archipelago. The ability to identify a unique Mackenzie River provenance is of particular importance, because the 4,200-km-long Mackenzie River drains an area of 1.8 × 10⁶ km2 () and delivers the largest annual load of suspended material to the Arctic Ocean of all Arctic rivers (124 × 1012 g/yr; Carson, Jasper, and Conly Citation1998; Holmes et al. Citation2002). The estimated annual contribution of sediment from the Mackenzie River to the Beaufort Sea (after subtracting estimated delta sedimentation) is 65 × 1012 g/yr (Macdonald et al. Citation1998; Rachold et al. Citation2000). Furthermore, the Mackenzie River has long been implicated as an important route for deglacial meltwater outbursts from the retreating Laurentide Ice Sheet (Fisher, Smith, and Andrews Citation2002; Tarasov and Peltier Citation2005; Peltier, Vettoretti, and Stastna Citation2006; Murton et al. Citation2010; Condron and Windsor Citation2012; Keigwin et al. Citation2018; Klotsko, Driscoll, and Keigwin Citation2019; Süfke et al. Citation2022). In this study, mineral and isotopic (Sr and Nd) compositions of fine fraction (<38 μm) sediments are reported from an 81.5-m deglacial to Holocene sediment sequence (MTW01) recovered in the Mackenzie Trough. The aim is to use a source to sink perspective and better constrain the mineralogical and isotopic signature of Mackenzie River sediments and investigate to what degree these changed during deglaciation and the Holocene.
Geological context of the Mackenzie River Basin
The underlying bedrock of the Mackenzie River basin can be divided into three major domains: (1) the folded Proterozoic to Mesozoic sedimentary strata of the North American Cordilleras (NAC), (2) the undeformed Cambrian to Cretaceous sedimentary strata of the Interior Platform (IP), and (3) the Precambrian igneous/metamorphic rocks of the Canadian Shield (CS; ). Prominent carbonate bedrock areas, including dolostones and limestones, are widespread in the Mackenzie River basin and are more pronounced in the NAC and IP (). The Mackenzie River basin was covered by the Laurentide ice sheet during the last glacial period but became gradually ice-free between 18 and 10 ka BP as the Laurentide ice sheet retreated eastwards (Dyke Citation2004; Stokes and Tarasov Citation2010; Dalton et al. Citation2020). Substantial glacial deposits are common all over the Mackenzie basin and constitute an additional source of prospective Arctic Ocean sediments (Millot et al. Citation2003).
Though the major tributaries of the Mackenzie River cross large areas of outcropping dolomitic bedrock (), there exists little data on the actual dolomite content of fine fraction material carried/deposited by the Mackenzie River and how this may have changed through time. The majority of fine fraction mineral studies incorporating sediments from the Mackenzie River or Beaufort Sea either removed the carbonate bearing minerals during pretreatments or did not analyze for or report dolomite contents (). Measurements of modern suspended sediments from the Mackenzie River indicate that detrital carbonates (<500 µm) constitute 5 wt% of the total sediment delivery during fall and winter (1987/1988) and 2.5 wt% during spring and summer (1988) (O’Brien et al. Citation2006). Darby et al. (Citation2011) analyzed the dolomite content in the <45 μm fraction of two samples from the Beaufort Sea using X-ray diffraction (XRD), one sample came from the Amundsen Gulf (8.1 percent dolomite), and one sample from the Mackenzie River delta (14.6 percent dolomite; and ). In a more recent study, the bulk mineralogy of thirty-four surface sediments from across the Canadian Beaufort Shelf reveal a large range in dolomite content from 2.7 to 34.8 wt%, with a clear gradient toward higher concentrations moving east from the Mackenzie Trough toward the Amundsen Gulf (; Gamboa et al. Citation2017).
Table 1. Quantification of dolomite in sediments from the Amerasian Basin.
Table 2. Quantification of dolomite in sediments from the Amerasian Basin.
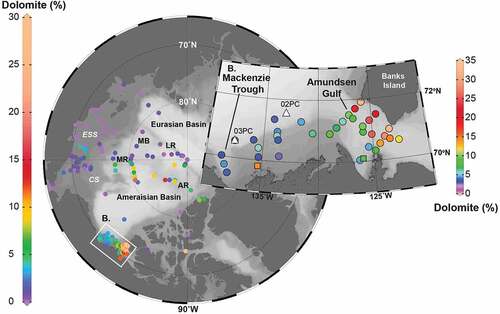
Figure 2. (a) Map of the Arctic Ocean showing sample locations and dolomite abundances reported in sediments from the Amerasian Basin and Canadian Arctic. Data are from Bazhenova, Vogt, and Stein (Citation2012) and Gamboa et al. (Citation2017). (b) Detail of the Canadian Beaufort Sea illustrating the increase in dolomite contents of surface sediments as one moves east toward the Amundsen Gulf. Additional data points from Darby et al. (Citation2011) are shown (squares). Position of sediment cores discussed in the text are indicated with triangles. CS = Chukchi Sea; ESS = East Siberian Sea; MR = Mendeleev Ridge; MB = Makarov Basin; LR = Lomonosov Ridge; AR = Alpha Ridge.
Radiogenic Sr in the dissolved load of Mackenzie River waters and its tributaries is directly related to the age of the bedrock source. Accordingly, low 87Sr/86Sr (0.7074–0.7140) in the river waters draining the IP contrasts with high 87Sr/86Sr (0.7346–0.7517) in the tributaries draining the CS (; Millot et al. Citation2002; Millot et al. Citation2003). The corresponding 87Sr/86Sr for the NAC fraction of Mackenzie River tributaries is 0.7066–0.7580, reflecting the heterogeneous age composition of this mountain range (; Millot et al. Citation2003). Surprisingly stable 87Sr/86Sr ratios (0.7114–0.7115) are recorded in the Mackenzie mainstream along a 2,000-km transect extending from the Slave River south of Great Slave Lake to Tsiigehtchic located slightly upstream from the confluence of the Peel and Mackenzie Rivers (; Millot et al. Citation2003). This stable and low radiogenic signal is explained by low contributions from the CS to the Mackenzie River mainstream due to less intense chemical weathering of the Precambrian bedrock (Millot et al. Citation2003).
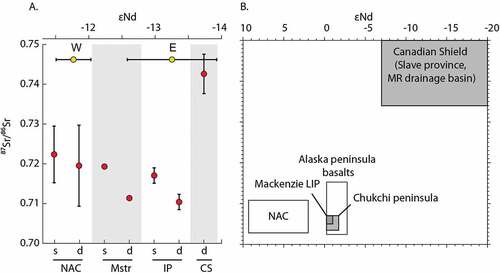
Figure 3. (a) Suspended bulk sediment load (s) and dissolved load (d) 87Sr/86Sr average ratios of main tributaries and minor tributaries from the major bedrock regimes in the Mackenzie River catchment area. ɛNd for western (W), and eastern (E) lakes in the modern Mackenzie River Delta are shown after (Vonk et al. Citation2015). Mstr = Mackenzie River mainstream. (b) Compilation of 87Sr/86Sr and ɛNd of regional bedrock terrains (North American Cordilleras: Francis and Ludden Citation1990; Carignan, Ludden, and Francis Citation1994; Abraham, Francis, and Polvé Citation2001; Slave Province: McCulloch and Wasserburg Citation1978; Cousens Citation2000; Mackenzie LIP: Dupuy et al. Citation1992; Alaska Peninsula basalts: Andronikov and Mukasa Citation2010; Akinin et al. Citation2013; Chukchi Peninsula: Ledneva, Pease, and Sokolov Citation2011).
The suspended bulk load of the IP tributaries shows 87Sr/86Sr that are consistently higher than the dissolved load (between 0.7151 and 0.7204), and the NAC tributaries 87Sr/86Sr values are between 0.7129 and 0.7368 (; Millot et al. Citation2003). The 87Sr/86Sr of the suspended load changes from 0.7199 at Liard River confluence with the Mackenzie River mainstream to 0.7189 at Tsiigehtchic (Millot et al. Citation2003). This observation is explained by estimates that only 5 percent of the <0.125 mm suspended material derives from the more radiogenic CS tributaries (Carson, Jasper, and Conly Citation1998). Carson, Jasper, and Conly (Citation1998) pointed out that the majority (65 percent) of the <0.125 mm suspended load is eroded from the mainstream riverbanks of the Mackenzie and Liard rivers; hence, the Interior Platform is the major provenance source of the suspended load.
Nd isotope measurements from the Mackenzie Basin (bedrock, suspended load, or dissolved load) are less abundant than Sr data. However, ɛNd of lake sediment from the Mackenzie River delta exhibit a west-to-east gradient (; Vonk et al. Citation2015). More radiogenic signals (εNd from −11.2 to −12.0) in the western parts of the delta are attributed to inputs from the NAC via the Peel River while the eastern parts are fed by the Mackenzie River mainstream (IP) and exhibit lower Nd isotope values (εNd from −12.5 to −14.5; ).
Site description and borehole stratigraphy
The 150-km-long Mackenzie Trough crosses the Canadian Beaufort shelf in a south–southeast direction from the modern Mackenzie River delta (). It is believed to be a glacially excavated trough (Shearer Citation1971; Blasco et al. Citation1990) occupied by an ice stream draining the Laurentian ice sheet during the Illinoian/Early Wisconsinan and Late Wisconsinan glaciations (Batchelor, Dowdeswell, and Pietras Citation2013). Consequently, seismic reflection data reveal two major subglacial till units in the Mackenzie Trough constituting up to 500 m of unconsolidated material upon the bedrock surface (Blasco et al. Citation1990; Batchelor, Dowdeswell, and Pietras Citation2013). The topmost seismic unit (MT1: Blasco et al. Citation1990; Sequence 5: Batchelor, Dowdeswell, and Pietras Citation2013) consists of 30 to 200 m of deglacial and Holocene deposits, with the thickest deposits on the landward side of the trough (Blasco et al. Citation1990; Hill et al. Citation1991; Batchelor, Dowdeswell, and Pietras Citation2013).
The 81.5-m borehole (MTW01, 69°20′53″N, 137°59′13″W) was drilled at 45-m water depth in the Mackenzie Trough in 1984 by the Geological Survey of Canada using an anchored drilling barge (). Sections of the borehole (0.3–0.8 m) were recovered every 1 to 3 m and subsequently analyzed with respect to sedimentology and physical properties (Moran, Hill, and Blasco Citation1989). Together with data from a 71-m piezocone penetrometer profile from a nearby (50-m offset) site and a seismic reflection profile crossing the borehole, five lithological units were defined (). Units C–E (29–81 mbsf) consist of sandy silts and are interpreted as a progradational sequence deposited in a deltaic setting when sea level was lowered during the last glacial cycle. Unit B (21–29 mbsf) is deposited unconformably onto Unit C during a transgressive phase and consists of laminated silt and clay, which show signs of deformation near the top of the unit. Near the top of Unit B (21–23 mbsf), planktonic foraminifera and ostracods first appear and indicate the onset of a marine environment (O’Regan et al. Citation2018). Unit A lays unconformably on Unit B and is a homogeneous foraminifer-bearing fine-grained clay deposited after marine inundation at the site (Moran, Hill, and Blasco Citation1989).
Figure 4. Lithostratigraphy of MTW01 (Moran, Hill, and Blasco Citation1989) and radiocarbon dates from O’Regan et al. (Citation2018). Units C–E were deposited in a progradational (deltaic) environment. Unit B was deposited during periods of rising sea level. Unit A was deposited in a marine environment.
Radiocarbon measurements of shell fragments from mollusks and mixed benthic foraminifer from Units A and B provide an estimate on the age of deposition of cal. yr BP for the base of Unit A (20.73–21.09 mbsf) and give a linear sedimentation rate of 2.63 ± 0.05 m ka−1 for Unit A (; Hilton et al. Citation2015; O’Regan et al. Citation2018). Radiocarbon age calibrations on foraminifera and mollusk fragments were performed with Marine13 (Reimer et al. Citation2013) and a ΔR of 335 ± 85 years based on twenty-four living mollusk specimens collected before 1956 from the northwestern Canadian Arctic Archipelago (Coulthard et al. Citation2010). Measurements on particulate organic matter were calibrated using IntCal13 data set (Reimer et al. Citation2013). The topmost sample in Unit B (21.64–21.99 mbsf) provides an age of 9920
cal yr BP and constitutes the oldest absolute date in the MWT01 sequence. Although no absolute dates constrain the age of the progradational sequence, it was initially reported as being younger than ~14 ka yr BP based upon unpublished pollen assemblage data (Blasco et al. Citation1990). Radiocarbon measurements of particulate organic carbon from the >63 μm, which are the youngest form of carbon delivered to the site by the Mackenzie River (Hilton et al. Citation2015), supports this general assertion indicating that it is younger than
cal. yr BP and was most likely deposited after glacial ice retreated from the coast at the end of the Toker Point glaciation (sometime between 22 and 16 cal. ka BP; Murton et al. Citation2007; O’Regan et al. Citation2018). This inferred age is largely consistent with the most recent ice margin chronologies, which show pronounced inland retreat of the Mackenzie ice stream between 14.9 and 14.2 cal. ka BP (Dalton et al. Citation2020). The implication is that the Younger Dryas would have occurred during deposition of sediments in MTW01. However, the lack of absolute dates below 21.64–21.99 mbsf precludes identification of its exact location. Murton et al. (Citation2010) suggested that it might have occurred across the Unit C/B boundary, just prior to marine inundation of the site.
Methods
Core sections from MWT01 are no longer intact, but dried decimeter-scale sections of the samples are stored in plastic bags at the GSC-Atlantic core repository. Subsamples from twenty-three bags were used for analysis of mineral assemblage and radiogenic Sr and Nd. The subsamples had been previously sieved (O’Regan et al. Citation2018), and the retained fine fraction content (<38 µm) was used for this study. Therefore, though we intentionally focused on the fine fraction material, because it is most prone to far-field transport via ocean currents and sea-ice entrainment and transport, we were limited by availability to the <38 µm size fraction.
Mineral assemblage investigations
The twenty-three sieved sediment samples (<38 μm) from MTW01 were homogenized using a synthetic sapphire mortar before being measured in an X’PERT X-ray diffractometer at the Department of Geological Sciences, Stockholm University. The diffractometer was equipped with Cu anode (Kα = 1.541) and a fixed divergence slit (1°/1.52 mm) and data were collected at 3° to 85° 2θ with a step size of 0.016° measuring 0.5 seconds per step. Postprocessing in HighScore 3.0x (PANalytical B.V. Almelo, The Netherlands) included baseline determination and peak search using default settings and subsequent peak identification using the ICSD 3.2 mineral database (Supplementary material 1). The mineral assemblage for each sample was quantified by Rietveld refinement using the free Material Analysis Using Diffraction (MAUD) software (http://maud.radiographema.com) (Supplementary material 2; Luterotti et al. Citation2007) with crystal structures from the Crystallography Open Database (Grazulis et al. Citation2009; http://www.crystallography.net).
In order to produce comparable data sets, the Rietveld refinement process was fully automatized including five iterations for each sample. The statistical significance of each refinement is given by the expected R value (Rexp = theoretically best possible fit) and weighted profile R value (Rwp = the real fit after refinement). Relatively high Rexp (22.3–23.1 percent) values were returned, reflecting the heterogeneous character of the samples (Toby Citation2006). However, the actual Rwp values are 37.3 to 41.1 percent, constituting less than twice () the corresponding Rexp. This indicates a decent fit of the refinement curve (McCusker et al. Citation1999).
Sr and Nd isotopic analysis
Ten of the fine-grained (<38 µm) samples were prepared for 87Sr/86Sr and 143Nd/144Nd analysis. Measuring the isotope composition of marine sediments provides a combined isotope signal partly derived from the detrital component and partly from a secondary component. The latter typically has an isotope composition derived from the water mass from which they were precipitated and usually appear as Fe-Mn hydroxide coatings (e.g., Elderfield Citation1988; Frank Citation2002). These can be extracted by leaching procedures to obtain a pure detrital and/or seawater isotopic signal (e.g., Bayon et al. Citation2002; Gutjahr et al. Citation2007). However, detrital carbonates (e.g., dolomite and calcite) will dissolve using the traditional methods of leaching and can potentially remove an important component of the isotopic signals detrital signature (Hillaire-Marcel et al. Citation2013). In order to gain a representative detrital signal that incorporates the carbonate phases, we analyzed Nd and Sr isotopic compositions of the bulk (<38 μm) sediment samples, bearing in mind that part of the isotopic signal likely has a water mass origin.
For the ten selected samples, 0.1 g of dried sediment, a BCR-2 rock standard, and a procedural blank were pretreated with 0.5 mL 8 N HNO3 and approximately 5 drops of 30 percent H2O2 to oxidize organic material. The samples were then completely digested in a successive treatment using 2 mL concentrated hydrofuran and 20 drops of concentrated HNO3 at 205°C for 72 hours, 5 × 10 drops concentrated HNO3 with intermediate evaporation, and finally 5 mL 6 N hydrochloric acid (HCl) at 205°C for 24 hours. Element separation of Nd and Sr was performed according to Aciego et al. (Citation2009). Iron was eliminated using AG1-X8 200 to 400 mesh (Bio-Rad) and TRU resin B 50 to 155 µm (TrisKem) in an HCl environment. Rare Earth Elements (REEs) were separated from Sr and other cations using an AG1-X8 TRU resin B 50 to 150 µm in a HNO3 environment. Subsequently, Sr was isolated from the matrix using a Sr resin B 50 to 100 µm (TrisKem). The Nd fraction of the REE was isolated using a LN resin C 100 to 150 µm (TrisKem) in an HCl environment. All chemicals were of high-purity quality (Seastar Baseline).
Strontium and Nd isotopes were analyzed at the Swedish Museum of Natural History on a Thermo Scientific TRITON thermal ionization mass spectrometer using total spiking with a mixed 149Sm/150Nd spike. Analytical details for the Sr and Nd isotope determinations are reported in . Total procedural blank for Sr was recorded to 1.9 ng. The 87Sr/86Sr for the BCR-2 standard had a value of 0.705027 ± 0.000015, within the range of the reported normalized value (0.705010 ± 0.000010; Weis et al. Citation2006).
Table 3. Data of εNd, 87Sr/86Sr, and concentrations of Nd and Sr.
Total procedural blank for Nd was recorded to be 0.23 ng. The 143Nd/144Nd for the BCR-2 standard had a value of 0.5126511 ± 0.0000014, close to the reported normalized value (0.512627 ± 0.000012; Weis et al. Citation2006).
Grain size measurements
All twenty-three samples (<38 µm) used for mineral analysis were measured with respect to grain size distribution using a Malvern 3000 laser diffractometer. Grain size analysis was performed to reveal the distribution between clay- and silt-sized particles in the samples in order to support interpretation of changes in 87Sr/86Sr ratios. Calculation of mean grain size for the samples was done using the geometric method of moments (Blott and Pye Citation2001).
Results
Mineral assemblage
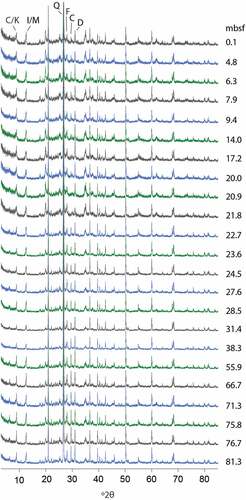
The XRD diffractograms exhibit a homogenous mineral assemblage throughout the MTW01 sediment samples ( and ). Mineral identification revealed the presence of quartz (3.34 Å), feldspars (3.19 Å), calcite (3.03 Å), dolomite (2.88 Å), illite/micas (10.0 Å), and chlorite + kaolinite (7.09 Å; ). Quartz, albite (representative of feldspars), calcite, dolomite, illite (representative of illite/micas), and chamosite (representative of chlorites) were used as the input mineral assemblage for the Rietveld analysis. Representative minerals were chosen based on the most high-ranked suggestions from HighScore processing. However, it is most likely that various minerals contribute to these mineral groups and therefore the output data are presented as feldspars, illite, and chlorite/kaolinite. By default, the identified mineral assemblages sum to 100 percent.
Table 4. Grain size and mineral abundances in MTW01.
Figure 5. Stacked diffractogram from XRD of MTW01 samples. C/K = chlorite + kaolinite; I/M = illite + muscovite; Q = quartz; F = feldspars; C = calcite; D = dolomite. Note that the quartz peak is not presented in its full height.
The downhole quantitative mineralogical variation exhibits a significant drop in quartz and calcite content at the Unit B/Unit A boundary along with a corresponding increase in illite (). Feldspar, chlorite/kaolinite, and dolomite fractions are relatively constant throughout the core (). Dolomite content varies within 4 to 11 wt% () with an average of 7.6 ± 0.6 wt% throughout MTW01. The average dolomite content is 6.5 ± 0.6 wt% and 8.4 ± 0.6 wt% for Units A–B and Units C–E, respectively.
Figure 6. Results from Rietveld refinement (in wt%) of the mineral assemblage in MTW01.
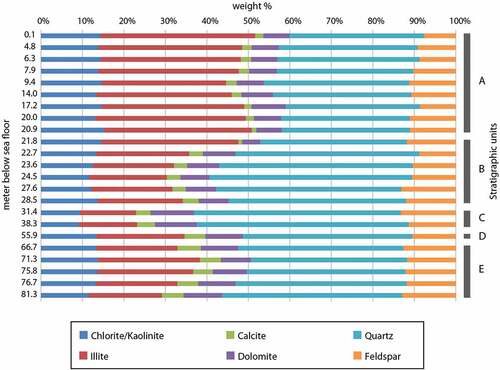
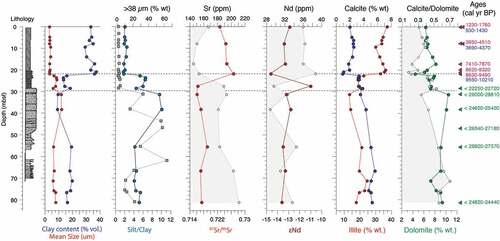
Figure 7. Borehole lithology, key mineral abundances (closed sum percent) and grain size illustrated alongside the Sr and Nd concentrations and isotopic composition. Radiocarbon age ranges (2 sigma) from O’Regan et al. (Citation2018) are shown on the right. Red = dates on mixed benthic foraminifera; blue = mollusk fragments; green = maximum limiting ages from radiocarbon dates on the particulate organic carbon content in the >63 µm size fraction.
Sr and Nd isotopes and concentrations
The 87Sr/86Sr values vary from 0.716068 to 0.719041 in Units C–E but become significantly more radiogenic (0.7244435 to 0.726687) in the top sample from Unit B and throughout Unit A ( and ). Concentrations of Sr vary from 180 to 210 ppm in the progradational unit and from 150 to 170 ppm in the transitional and marine units. The Nd concentration varies from 29 to 39 ppm with a higher concentration (~36–38 ppm) in Unit A ( and ). The ɛNd exhibit a stable downhole pattern with values between −13.6 to −12.8 in both Units C–E and Unit A, whereas notable ɛNd excursions are found in Unit B (−11.0 and −14.6; and ).
Grain size distribution
The >38 µm content of samples from MTW01 was first presented by O’Regan et al. (Citation2018) and was based on sample weights after sieving. This data illustrated the expected coarser nature of the progradational units, followed by a fining in the transitional and Holocene marine sediments (). Analysis of the clay and silt composition of the <38 µm fraction reveals that the clay fraction is 10 to 20 percent in Units B–E and does not increase significantly until the top of Unit B where it then accounts for 30 to 40 percent ( and ). This implies that fine fraction sediments in the transitional unit (Unit B) are much more silt rich than the overlying Holocene marine sediments in Unit A ().
Discussion
Mineral assemblage and dolomite content
The XRD-derived mineral assemblages from MTW01 are consistent with analyses of surface sediments from the modern Mackenzie River delta where quartz, calcite, dolomite, feldspars, chlorite, and illite (order of abundance) are reported (Wagemann, Brunskill, and Graham Citation1977). Suspended material sampled from the river delta had a similar composition but with chlorite and illite being more abundant than feldspars (Wagemann, Brunskill, and Graham Citation1977). A quantitative study of <45 µm sediment from surface sediments of the Beaufort Shelf also indicate 46.2 percent quartz, 14.6 percent dolomite, 13.1 percent illite, 11.2 percent feldspars, 5.5 percent chlorite, 4.7 percent calcite, 2.7 percent smectite, and 2 percent minor accessory minerals (Darby et al. Citation2011). In the Mackenzie Trough, bulk mineral assemblages from a surficial sediment sample included (in descending abundance) quartz, illite, chlorite + kaolinite, dolomite, feldspar, and calcite (Kobayashi et al. Citation2016). Gamboa et al. (Citation2017) reported similar abundance patterns in three bulk surface sediments from the Mackenzie Trough dominated by (in descending order) phyllosilicates, quartz, plagioclase, K-feldspar, and dolomite, with other minerals contributing <1 wt%. General consistency between these different studies suggests that this assemblage is characteristic for the Mackenzie River, which is estimated to supply >95 percent of the sediments found on the Beaufort Shelf (Hill et al. Citation1991).
One important finding from this study is that there is a remarkably consistent dolomite content in the sediments from MTW01. During the Holocene (Unit A), the dolomite content has remained stable at 6.5 ± 0.6 wt% of the <38 µm fraction, with slightly higher abundances during the period of progradation (8.4 ± 0.6 wt%). Compared to other proximal records, our average Holocene dolomite content is slightly higher than the three bulk surface sediments from the Mackenzie Trough reported by Gamboa et al. (Citation2017), which ranged between 3.6 and 4.4 wt%, but this difference could be ascribed to different size classes analyzed. However, our data and those from Gamboa et al. (Citation2017) are much lower than the 14.6 wt% dolomite reported from one station close to the Mackenzie Trough by Darby et al. (Citation2011), which appears as an outlier when compared to regional measurements ().
Two downcore records of XRD-based mineral assemblages exist from the slope of the Canadian Beaufort Sea, a late Holocene record (AMD0214-03PC/TWC; Kutos, Rochon, and Montero-Serrano Citation2021), and a late deglacial/Holocene record (<13 ka; AMD0214-02PC; ; Deschamps, Montero-Serrano, and St-Onge Citation2018; Deschamps et al. Citation2018). In the Late Holocene, the dolomite content in 3PC is <10 wt% (Kutos, Rochon, and Montero-Serrano Citation2021). Kutos, Rochon, and Montero-Serrano (Citation2021) argued that this is a signature of fine-grained material from the Mackenzie River, an argument that agrees well with the dolomite content of sediments from MTW01. In AMD0214-02PC, located further to the east, sediments younger than 10 ka have an average dolomite content of 1.4 ± 2.4 wt% (n = 18), whereas an underlying laminated and ice-rafted debris (IRD) enriched unit deposited between 13 and 10 ka has a mean of 6.8 ± 7.2 wt% (n = 17). Two discrete intervals with peak dolomite contents of 28 and 15 wt% occur in this laminated unit and are dated to ~10.8 and 12.9 cal. ka BP, respectively (Deschamps, Montero-Serrano, and St-Onge Citation2018). This Ca-enriched laminated unit is mapped across the Beaufort slope and appears thickest in front of the Mackenzie Trough (Klotsko, Driscoll, and Keigwin Citation2019), implying that the Mackenzie River is the primary source of this material. Klotsko, Driscoll, and Keigwin (Citation2019) also suggested that discrete Ca-enriched IRD intervals in this regionally identified laminated unit are likely derived from other sources. Specifically, these include inputs from ice stream activity and meltwater emanating from the large Amundsen and possibly Mc’Clure straits to the east. This is consistent with the considerably higher dolomite contents in surface sediments from the Amundsen Gulf and presumably also further east (). Pronounced glacial retreat occurred in Amundsen and Mc’Clure straits during the Bølling–Allerød and early Younger Dryas (Lakeman et al. Citation2018), with the Amundsen Gulf being implicated as key sources of meltwater discharge during the Bølling–Allerød (~14.7–13 ka; Süfke et al. Citation2022).
In bulk sediment (i.e., nonsieved sediment samples), dolomite quantities from the Amerasian Basin have been reported by Darby et al. (Citation1989), Vogt (Citation1997), Stein et al. (Citation2010), Bazhenova (Citation2012), and Zao (Citation2016). Darby et al. (Citation1989) documented dolomite contents of up to 46 percent in five Plio-Pleistocene sediment cores from ridges and abyssal plains in northwestern Amerasian Basin (). Stein et al. (Citation2010) revisited one of these sites and found a similar downcore pattern of dolomite abundance up to 50 percent in the so-called pink layers. Vogt (Citation1997) reported a range of 2 to 20 percent for dolomite abundances in five surficial sediment samples from the Canada Basin with maximum abundances on the Chukchi Plateau (). At the Alaska/Chukchi Sea border, high levels (<35 percent) of dolomite associated with pulses of IRD were found in pre–Last Glacial Maximum (LGM) sediment (<250 µm) and were followed by low and stable (<2 percent) dolomite levels during the LGM (Polyak et al. Citation2009; ). The same core exhibited variations between 0 and 33 percent of dolomite during mid- to late Holocene with an average dolomite content of 4 ± 7 percent (Ortiz et al. Citation2009; ).
The use of clay mineralogy in ocean sediment provenance research is widespread since the late 1960s (e.g., Biscaye Citation1965; Carroll Citation1970; Naidu and Mowatt Citation1983; Viscosy-Shirley et al. Citation2003), and a number of studies have included samples from the Beaufort Shelf (Naidu, Burrell, and Hood Citation1971; Clark et al. Citation1980; Naidu and Mowatt Citation1983), as well as in adjacent areas in the Amerasian Basin (Carrol Citation1970; Darby Citation1975; Naidu, Mowatt, and Creager Citation1982; Moser and Hein Citation1984). However, the dolomite content in the clay-sized fraction is seldom reported, sometimes due to dissolution of carbonates in the pretreatment procedures (e.g., Naidu, Burrell, and Hood Citation1971; Moser and Hein Citation1984; ). Nevertheless, Carrol (Citation1970) reported an average dolomite content of 5 percent in the clay fraction (<2 µm) from seventeen sediment cores recovered in central Canada Basin and on the Alpha Ridge (). Dalrymple and Maas (Citation1987) reported an average of 1 percent dolomite in the clay fraction of two sediment cores from the Alpha Ridge covering the Plio-Pleistocene to Holocene period (). Vogt (Citation1997) reported less than 1 wt% of dolomite content for Chukchi and East Siberian Sea shelf sediments. The <63 μm fraction of sediments from a Mendeleev Ridge sediment core (HLY0503-11MC8) contained a wide range (1–28 percent) of dolomite deposited during the last 250 ka (; Not and Hillaire-Marcel Citation2010). East of the Mendeleev Ridge the same fraction is reported to contain 0 to 53 percent during the Pleistocene with peaks in dolomite found in discrete pink layers (; Dong et al. Citation2017). Fagel et al. (Citation2014) reported between 0 and 10 percent dolomite in the 20 to 63 μm fraction of a sediment cores from the Mendeleyev Ridge. Analysis of separate grain size fractions (<20 µm, 20–63 µm, and >63 µm) from the HLY0503-18MC sediment core recovered in the intra-basin of the Lomonosov Ridge revealed dolomite contents of 0.5 to 6 percent, 2.5 to 15 percent, and 0 to 25 percent, respectively (; Not and Hillaire-Marcel Citation2012).
The relatively constant dolomite content in the <38 μm fraction (6–8 wt%) of the MTW01 borehole agrees relatively well with the low-end estimates of dolomites in the fine fraction studies (<63 μm) from the Amerasian Basin (). In contrast, the elevated (>15–20 wt%) dolomite levels reported in many of these studies, and especially those from the dolomite-rich pink layers (), far exceed the levels in deglacial and Holocene sediments from MTW01 and other proximal records influenced by Mackenzie River runoff.
Though clearly the Mackenzie River is a source of fine fraction dolomite to the Arctic, at the resolution of this study, there is little evidence for intervals of pronounced dolomite delivery during the Holocene and the period of deglaciation captured in the progradational sequence. It remains possible that more dolomite-enriched fine fraction material delivered by the Mackenzie River bypassed MTW01 during the progradational phase. However, the depositional age of this period in the borehole remains poorly constrained. It is likely younger than 22 to 16 ka, being deposited after glacial ice retreated from the region (Murton et al. Citation2007; O’Regan et al. Citation2018), and was originally suggested to be younger than 14 ka based on unpublished pollen data (Blasco et al. Citation1990). Future work is needed to quantify the dolomite content in older and more slowly deposited laminated sediments found toward the seaward end of the Mackenzie Trough, as well as the amount of glacially eroded detrital carbonate delivered by icestream and meltwater activity in the larger glacial troughs to the east (Marigold et al. Citation2015). Historically these have been inferred to be the primary source of coarse-grained (IRD) dolomite found in central Arctic Ocean sediments (Stokes et al. Citation2005), and given the close proximity to large areas of outcropping dolomite (), they are a likely path for the delivery of fine-grained dolomites entrained in meltwater (i.e., Süfke et al. Citation2022).
Nd isotope signature
The Nd isotope signature of MTW01 is relatively constant, with the exception of two measurements from the transitional Unit B (). If the two extreme data points from Unit B (ɛNd = −11.0 and −14.6) are excluded, ɛNd values in MTW01 span between −12.8 and −13.6 with an average of −13.3 ± 0.1 for Units C–E and Unit A (). Neodymium isotope composition in MTW01 () is in close agreement with Mackenzie River suspended sediments (bulk: ɛNd = −14.3; Goldstein et al. Citation1984; and detrital: ɛNd = – 11.6 to −13.9; Vonk et al. Citation2015). Modern detrital Nd surface samples of the Beaufort Shelf are also broadly consistent with the MTW01 isotope composition (; Asahara et al. Citation2012; Vonk et al. Citation2015; Maccelli et al. Citation2018; Schwab et al. Citation2021). However, our ɛNd results are less negative than much of the published surface sediment data from the region (). The compiled surface sediment analyses were performed after removing the carbonate and authigenic (Fe-Mn) fractions, which both have a less negative ɛNd compared to the detrital silicate phase (Asahara et al. Citation2012; Schwab et al. Citation2021). Authigenic Nd phases would primarily be derived from the waters of the Mackenzie River (ɛNd = −12.9 ± 0.3; Zimmerman et al. Citation2009), with a possible contribution from surface waters in the Canada Basin (ɛNd = −6.4 to −8.7; Porcelli et al. Citation2009). Thus, the reported values from MTW01 overestimate the detrital signal and thus the actual detrital ɛNd should be lower.
Figure 8. Clay, illite (white), and calcite (black) content versus the 87Sr/86Sr ratio for the MTW01 sediments.
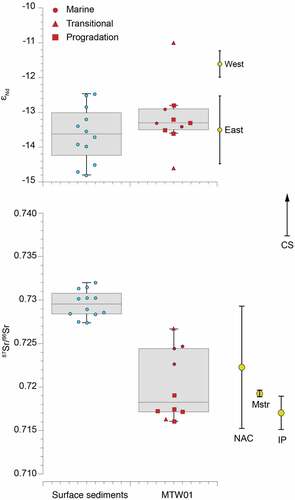
Figure 9. Comparison between MTW01 and surface sediment εNd and 87Sr/86Sr from the Canadian Beaufort Sea (Asahara et al. Citation2012; Vonk et al. Citation2015; Maccali, Hillaire-Marcel, and Not Citation2018; Schwab et al. Citation2021). The box plots show the upper quartile (UQ), lower quartile (LQ), median, and range of data points not deemed as outliers. Outliers were identified as data points whose value was >UQ + 1.5 * IQD or <IQ − 1.5 * IQD, where IQD is the interquartile distance (IQD = UQ − LQ). The raw data are overlain to show the distribution. For MTW01, symbols indicate the depositional setting (progradational, transitional, marine). Annotations indicate the ɛNd values for sediments from lakes in the east and west of the Mackenzie delta and 87Sr/86Sr of suspended sediments in major tributaries of the Mackenzie River (from ).
The relatively invariant ɛNd values in Units A and C–E implies a joint and fairly stable sediment source. A similarity to the Nd isotope composition of the eastern delta lake sediment (−12.5 to −14.5) implies a substantial IP imprint on these units (; Vonk et al. Citation2015). The relatively low ɛNd signals (−13.7 and −14.7) in two detrital surface sediment samples at the river mouth (Asahara et al. Citation2012) are likely also affected by the rivers of Mackenzie mainstream and its IP imprint. This is consistent with a minor contribution to the Mackenzie River mainstream from the east bank tributaries (CS), which are estimated to only account for ~5 percent of the total suspended load today (Carson, Jasper, and Conly Citation1998). The results from this study suggest that the IP remained the dominant source of fine-grained suspended sediments in the Mackenzie River during deglacial progradation and the Holocene. Reported Nd concentration of both modern river sediments (16.09 ppm; Goldstein et al. Citation1984) and Beaufort Shelf surficial detrital sediments (27.2–27.6 ppm; Asahara et al. Citation2012) are lower than the concentrations of Nd in MTW01. However, an equivalent increase in Nd concentration from the deltaic sediments in Units C–E to the marine setting in Unit A is seen in MTW01 (). This trend might reflect authigenic uptake of Nd from seawater.
Sr isotope signature
The average 87Sr/86Sr ratio from Units C–E in this study (0.717206; ) is slightly lower than the modern riverine bulk sediment load at Tsiigehtchic (0.7190; Millot et al. Citation2003). Modern Beaufort Shelf detrital sediment reveal a 87Sr/86Sr signature considerably higher () than Units C–E but is closer to the average 87Sr/86Sr signature (0.724612) in Units A and B (). Our bulk sediment data will be affected by both carbonate and authigenic phases that have a lower 87Sr/86Sr ratio than detrital silicate fractions (Asahara et al. Citation2012; Schwab et al. Citation2021). For example, sediments from MTW01 in Unit A would likely be affected by an authigenic Sr signal that usually resembles the common 87Sr/86Sr ocean water signal of 0.70918 (Henderson et al. Citation1994; Gutjahr et al. Citation2007). Similar to ɛNd, the authigenic and carbonate phases in our samples introduce a substantial offset compared to the pure detrital silicate signal reported for surface sediments (). Overall, the progradational units (C–E) tend to have a signature similar to modern Mackenzie River bulk sediment, whereas the radiogenic Sr signal in the marine unit (A) shifts toward a shelf sediment signature. Furthermore, the strontium concentrations in Units C–E (189–211 ppm) () are in good agreement with reported concentrations for suspended bulk sediment in the main tributaries of the Mackenzie River (169–204 ppm; Millot et al. Citation2003) but are considerably higher than Beaufort Shelf surficial sediment Sr concentrations (113–118 ppm).
Changes in 87Sr/86Sr can arise from variations in source area, grain size, or physical erosion (Tütken et al. Citation2002; Meyer, Davies, and Stuut Citation2011; Ali et al. Citation2015). The ɛNd data suggest a stable sediment provenance through most of the MTW01 sequence, implying that the change in 87Sr/86Sr between the progradational and marine unit may not reflect a provenance change. The more radiogenic 87Sr/86Sr ratios in Unit A are accompanied by a reduction in the Sr concentration, an increase in the fine fraction content, and a clay mineral shift toward increased illite and decreased chlorite concentration (). High relative abundance of 87Sr in clays (i.e., illite) is common as the high Rb concentration produces 87Sr through radioactive decay (Meyer, Davies, and Stuut Citation2011; Ali et al. Citation2015). The 87Sr/86Sr ratio in MTW01 is strongly correlated to the overall increase in clay content of the samples (). Therefore, the higher 87Sr/86Sr ratio in the marine unit and the lower overall Sr concentration likely reflect a relative increase in the clay mineral concentration and composition, compared to the progradational sediments (). Hence, 87Sr/86Sr is not interpreted to reflect a change in sediment provenance, such as a larger contribution from the CS or NAC tributaries in the Holocene. Instead, we suggest that the increase in 87Sr/86Sr in Unit A is a consequence of the fining of sediment, suggesting that coarser material has been trapped in the modern river delta and nearshore area following transgression. Notably, calcite tends to be the major Sr-bearing mineral in Mackenzie River sediments (Millot et al. Citation2003). The general decrease in Sr concentration in Unit A might be explained by the observed decrease in calcite.
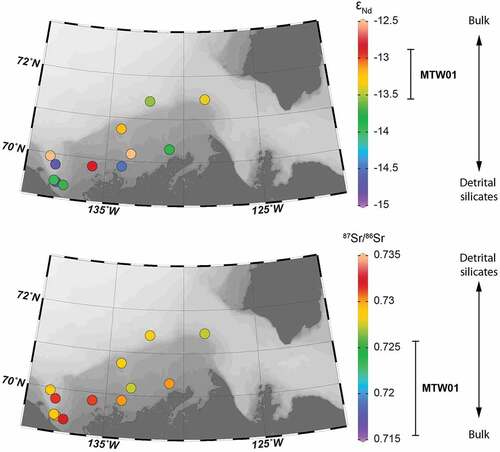
Figure 10. Spatial variations in surface sediment εNd and 87Sr/86Sr in the Canadian Beaufort Sea (Asahara et al. Citation2012; Vonk et al. Citation2015; Maccali, Hillaire-Marcel, and Not Citation2018; Schwab et al. Citation2021). The range of MTW01 sediments is shown on the right, alongside relative changes expected between the authigenic and carbonate phases and the pure detrital silicate signal (taken from tests individual extracted phases reported by Asahara et al. (Citation2012) and Schwab et al. (Citation2021). The lower 87Sr/86Sr ratios and less negative εNd signature of MTW01 sediments can both be partially explained by the influence of authigenic and carbonate phases, which were not removed in our study.
Mineral and isotopic signatures of meltwater events
Unlike 87Sr/86Sr ratios, ɛNd is not sensitive to grain size variations (Eisenhauer et al. Citation1999; Tütken et al. Citation2002) and has therefore been used extensively as a provenance proxy in the Arctic (e.g., Haley et al. Citation2008; Fagel et al. Citation2014; Meinhardt et al. Citation2016; Bazhenova, Fagel, and Stein Citation2017). The relatively constant ɛNd values throughout Units C–E and further upwards in Unit A are interrupted by two extreme ɛNd values in Unit B (). At the base of Unit B (27.6 mblf), an ɛNd value of −11.0 suggests an NAC/IP dominated sediment pulse. The topmost sample of Unit B (21.8 mbsf) is characterized by a low radiogenic Nd signal (εNd = −14.6) and exhibits the lowest concentration of dolomite (and calcite) throughout the MTW01 sequence (). Altogether, this suggests a pulse of sediment with a more CS-dominated imprint ().
These excursions occur at interesting stratigraphic points in the borehole. Although the Unit B/C transition has not been dated (O’Regan et al. Citation2018), Murton et al. (Citation2010) have suggested that this boundary correlates to an erosional surface on the Beaufort Shelf formed during a deglacial meltwater outburst at the onset of the Younger Dryas. The second Nd isotopic excursion occurs at the top of Unit B in a sequence of deformed silty-clay lenses dated to cal. yr BP (; O’Regan et al. Citation2018). It also coincides with a secondary, less extensive glacial meltwater outburst documented and dated by Murton et al. (Citation2010) in the terrestrial stratigraphy of Richards Island and the adjacent coastal plains.
Klotsko, Driscoll, and Keigwin (Citation2019) recently identified three meltwater pulses from the Mackenzie River corridor during delgaciation by combining the regional acoustic stratigraphy and X-ray fluorescence scanning elemental abundances of sediment cores from the Beaufort slope. These events were dated at 14.5 to 13.0 cal. ka BP (during the Bølling–Allerød), 12.94 cal. ka BP. and 11.3 cal. ka BP. The oldest event had two phases and is argued to originate from drainage of regional proglacial lakes. The latter two events were attributed to outbursts from Glacial Lake Aggasiz at the onset of the Younger Dryas and Pre-Boreal Oscillation. Süfke et al. (Citation2022), have further refined the chronology and origin of meltwater events using authigenic and detrital Pb isotopes (208Pb/204Pb, 206Pb/204Pb) in three cores from the Amundsen Gulf and Beaufort Sea slope. They documented a near-continuous input of meltwater-derived sediments from the retreating Laurentide ice sheet starting at the onset of the Bølling–Allerød. This began with an “Amundsen Gulf Event,” followed by two pronounced meltwater pulses during the Younger Dryas (12.0 and 11.2 cal. ka BP) and a minor event around 9.7 cal. ka BP. Presumably, the Amundsen Gulf Event would be associated with relatively large amounts of fine-grained dolomite, however this has not been quantitatively defined but only qualitatively indicated by elevated Ca/Sr ratios in X-ray fluorescence scanning data (Süfke et al. Citation2022). Due to the poor age control, it is not possible to establish whether the Younger Dryas and/or Pre-Boreal Oscillation events are captured and sampled in MTW01. The changes in ɛNd seen in the transitional unit are the only notable changes in the isotopic signature of sediments that could be indicative of meltwater pulses. These events were not associated with elevated inputs of dolomite.
Existing studies on ɛNd in deglacial and Holocene sediments from the Beaufort Sea are limited to the analysis of bulk sediment leachates used to derive the paleo-seawater signal (Deschamps et al. Citation2019; AMD0214-02PC; ). They report highly unradiogenic ɛNd (−11.9 to −16.8) in the deglacial and Early to Middle Holocene that they broadly attribute to sediment provenance and inland weathering changes in the Mackenzie drainage basin. Given uncertainties in age models and lack of XRD-based mineral quantification, it remains unclear whether the discrete pulses of dolomite-enriched sediments recorded in cores from the Beaufort Sea slope (Deschamps, Montero-Serrano, and St-Onge Citation2018) are solely attributed to meltwater emanating from the Amundsen Gulf (i.e., the Amundsen Gulf Event) or whether they reflect outflow via the Mackenzie River. Generally, ɛNd values become less radiogenic (more negative) as one moves east from the Mackenzie Trough across the Amundsen Gulf and Mc’Clure Strait and through the Canadian Arctic Archipelago (CAA) (Dong et al. Citation2020). In studying late Quaternary sediments from the Northwind Ridge, Wang et al. (Citation2021) used the less radiogenic ɛNd and more dolomite-enriched sediments from around Banks Island as a key feature for discriminating between sediment provenance from the Mackenzie River and the western CAA. Additional work on more proximal deglacial and Holocene records is required to test the robustness of this interpretation, which may have great potential for unraveling the provenance of dolomite rich sediments in the central Arctic.
In studying far-field records from the Arctic Ocean, most authors have looked at the modern signature of Mackenzie River sediments or surface sediments on the shelf to fingerprint possible meltwater events (Not and Hillaire-Marcel Citation2012; Hillaire-Marcel et al. Citation2013). A growing body of evidence, including our results from MTW01, highlights the possibility that the mineral and isotopic signature of meltwater pulses will likely differ from a relatively stable and well-defined Mackenzie River baseline signal. This again emphasizes the need to groundtruth mineral and isotopic proxies using records proximal to the major glacial troughs draining the Laurentide ice sheet in the Canadian Arctic.
Conclusions
Results from this study indicate a relatively stable dolomite, ɛNd, and 87Sr/86Sr signature of fine-grained Mackenzie River sediments through the studied deglacial and Holocene sequence.
Dolomite in Holocene marine sediments (Unit A) remained stable at 6.5 ± 0.6 wt% of the <38 µm fraction, with slightly higher abundances during the period of progradation (8.4 ± 0.6 wt%). These are much lower than the dolomite-rich layers found in central Arctic cores and discrete intervals in deglacial records from the Beaufort Sea slope. Consequently, it remains plausible that the origin of these dolomite-rich sediments may be from meltwater or ice streaming activity in the glacial troughs found east of the Mackenzie delta.
The average neodymium isotope composition in MTW01 (ɛNd = −11.0 to −14.6, average ɛNd = −13.2 ± 0.1) is in good agreement with Mackenzie River suspended sediments and modern surface samples of the Beaufort shelf. Two exceptions occur in the transitional unit, deposited immediately after the initial marine transgression at this site. These are not accompanied by increased dolomite content. Although dating of this unit is too uncertain to accurately integrate into regional chronologies of meltwater delivery (Süfke et al. Citation2022), these results do point towards potentially unique detrital ɛNd signatures during meltwater events that could be exploited in future studies.
Distinct increases in 87Sr/86Sr in the marine Holocene sediments are interpreted as a response to decreased grain size resulting from the more distal location of the Mackenzie River mouth after marine transgression. They do not appear to be driven by a notable change in sediment provenance.
Supplemental Material
Download Zip (469.2 KB)Disclosure statement
No potential conflict of interest was reported by the authors.
Supplementary material
Supplemental material for this article can be accessed on the publisher’s website.
Additional information
Funding
Related Research Data
References
- Abraham, A., D. Francis, and M. Polvé. 2001. Recent alkaline basalts as probes of the lithospheric mantle roots of the Northern Canadian Cordillera. Chemical Geology 175 (3–4):361–86. doi:10.1016/S0009-2541(00)00330-2.
- Aciego, S., B. Bourdon, M. Lupker, and M. Lupker. 2009. A new procedure for separating and measuring radiogenic isotopes (U, Th, Pa, Ra, Sr, Nd, Hf) in ice cores. Chemical Geology 266 (3–4):203–13. doi:10.1016/j.chemgeo.2009.06.003.
- Akinin, V.V., A.V. Andronikov, S.B. Mukasa, and E.L. Miller. 2013. Cretaceous lower crust of the continental margins of the northern Pacific: petrological and geochronological data on lower to middle crustal xenoliths. Petrology 21:28–65. https://doi.org/10.1134/S0869591113010013
- Ali, S., E. C. Hathorne, M. Frank, D. Gebregiorgis, K. Stattegger, R. Stumpf, S. Kutterolf, J. E. Johnson, and L. Giosan. 2015. South Asian monsoon history over the past 60 kyr recorded by radiogenic isotopes and clay mineral assemblages in the Andaman Sea. Geochemistry, Geophysics, Geosystems 16 (2):505–21. doi:10.1002/2014GC005586.
- Andronikov, A. V., and S. B. Mukasa. 2010. 40Ar/39Ar eruption ages and geochemical characteristics of Late Tertiary to Quaternary intraplate and arc-related lavas in interior Alaska. Lithos 115:1–14. https://doi.org/10.1016/j.lithos.2009.11.002
- Asahara, Y., F. Takeuchi, K. Nagashima, N. Harada, K. Yamamoto, K. Oguri, and O. Tadai. 2012. Provenance of terrigenous detritus of the surface sediments in the Bering and Chukchi Seas as derived from Sr and Nd isotopes: Implications for recent climate change in the Arctic regions. Deep Sea Research Part II: Topical Studies in Oceanography 61-64:155–71. doi:10.1016/j.dsr2.2011.12.004.
- Batchelor, C. L., J. A. Dowdeswell, and J. T. Pietras. 2013. Seismic stratigraphy, sedimentary architecture and palaeo-glaciology of the Mackenzie Trough: Evidence for two Quaternary ice advances and limited fan development on the western Canadian Beaufort Sea margin. Quaternary Science Reviews 65:73–87. doi:10.1016/j.quascirev.2013.01.021.
- Bayon, G., C. German, R. Boella, J. Milton, R. Taylor, and R. Nesbitt. 2002. An improved method for extracting marine sediment fractions and its application to Sr and Nd isotopic analysis. Chemical Geology 187 (3–4):179–99. doi:10.1016/S0009-2541(01)00416-8.
- Bazhenova, E. 2012. Reconstruction of late Quaternary sedimentary environments at the southern Mendeleev Ridge (Arctic Ocean). PhD Thesis, dissertation, University of Bremen, Bremen.
- Bazhenova, E. A., C. Vogt, and R. Stein. 2012. Results of X-ray diffraction analysis and quantification of mineral phases based on the RockJock quantitative analysis and the full-pattern method QUAX of Arctic Ocean surface sediments. PANGAEA. doi:10.1594/PANGAEA.792555.
- Bazhenova, E., N. Fagel, and R. Stein. 2017. North American origin of “pink–white” layers at the Mendeleev Ridge (Arctic Ocean): New insights from lead and neodymium isotope composition of detrital sediment component. Marine Geology 386:44–55. doi:10.1016/j.margeo.2017.01.010.
- Biscaye, P. F. 1965. Mineralogy and sedimentation of recent deep-sea clay in the Atlantic Ocean and adjacent seas and oceans. Geological Society of America Bulletin 76 (7):803–32. doi:10.1130/0016-7606(1965)76[803:MASORD]2.0.CO;2.
- Bischof, J., D. L. Clark, and J. S. Vincent. 1996. Origin of ice-rafted debris: Pleistocene paleoceanography in the western Arctic Ocean. Paleoceanography 11 (6):743–56. doi:10.1029/96PA02557.
- Blasco, S. M., G. Fortin, P. R. Hill, M. J. O’Connor, and J. Brigham-Grette. 1990. The late Neogene and Quaternary stratigraphy of the Canadian Beaufort continental shelf. In The geology of North America. The Arctic Ocean region, ed. A. Grantz, L. Johnson, and J. F. Sweeney, vol. L, 491–502. Boulder, Colorado: Geological Society of America.
- Blott, S. J., and K. Pye. 2001. GRADISTAT: A grain size distribution and statistics package for the analysis of unconsolidated sediments. Earth Surface Processes and Landforms 26 (11):1237–48. doi:10.1002/esp.261.
- Carignan, J., J. Ludden, and D. Francis. 1994. Isotopic characteristics of mantle sources for Quaternary continental alkaline magmas in the northern Canadian Cordillera. Earth and Planetary Science Letters 128 (3–4):271–86. doi:10.1016/0012-821X(94)90150-3.
- Carrol, D. 1970. Clay minerals in Arctic Ocean sea-floor sediments. Journal of Sedimentary Petrology 40:814–21.
- Carson, M. A., J. N. Jasper, and F. M. Conly. 1998. Magnitude and sources of sediment input to the Mackenzie Delta, Northwest Territories, 1974–94. Arctic 51 (2):116–24. doi:10.14430/arctic1053.
- Clark, D. L., R. R. Whitman, K. A. Morgan, and S. D. Mackey. 1980. Stratigraphy and glacialmarine sediments of the Amerasian Basin, central Arctic Ocean. Geological Society of America, Special Paper 181:57. doi:10.1130/SPE181-p1.
- Condron, A., and P. Winsor. 2012. Meltwater routing and the Younger Dryas. Proceedings of the National Academy of Sciences 109 (49):19928–33. doi:10.1073/pnas.1207381109.
- Cook, H. E., P. D. Johnson, J. C. Matti, and S. I. Zemmel. 1975. Methods of sample preparation and X-ray diffraction data analysis. In Initial reports of the deep sea drilling project, ed. A. G. Kaneps, vol. 28, 999–1007. Washington, DC: United States Government Printing Office.
- Coulthard, R. D., M. F. A. Furze, A. J. Pienkowski, F. Chantel Nixon, and J. H. England. 2010. New marine DR values for Arctic Canada. Quaternary Geochronology 5:419–434. https://doi.org/10.1016/j.quageo.2010.03.002
- Cousens, B. L. 2000. Geochemistry of the Archean Kam Group, Yellowknife Greenstone Belt, Slave Province, Canada. The Journal of Geology 2 (2):181. doi:10.1086/314397.
- Dalrymple, R. W., and O. C. Maas. 1987. Clay mineralogy of late Cenozoic sediments in the CESAR cores, Alpha Ridge, central Arctic Ocean. Canadian Journal of Earth Sciences 24 (8):1562–69. doi:10.1139/e87-152.
- Dalton, A. S., A. Seaman, J. Shaw, R. R. Stea, J. T. Teller, W. B. Thompson, L. H. Thorleifson, D. J. Utting, J. J. Veillette, B. C. Ward, et al. 2020. An updated radiocarbon-based ice margin chronology for the last deglaciation of the North American Ice Sheet Complex. Quaternary Science Reviews 234:106223. doi:10.1016/j.quascirev.2020.106223.
- Darby, D. A. 1975. Kaolinite and other clay minerals in Arctic Ocean sediments. Journal of Sedimentary Petrology 45:272–79.
- Darby, D. A., A. Naidu, T. C. Mowatt, and G. Jones. 1989. Sediment composition and sedimentary processes in the Arctic Ocean. In The Arctic seas, ed. Y. Herman, 657–720. New York: Von Nostrand Reinhold.
- Darby, D. A., J. F. Bischof, R. F. Spielhagen, S. A. Marshall, and S. W. Herman. 2002. Arctic ice export events and their potential impact on global climate during the late Pleistocene. Paleoceanography 17. doi:10.1029/2001PA000639.
- Darby, D. A., W. B. Myers, M. Jakobson, and I. Rigor. 2011. Modern dirty sea ice characteristics and sources: The role of anchor ice. Journal of Geophysical Research 116 (C9):C09008. doi:10.1029/2010JC006675.
- Darby, D. A., J. D. Ortiz, C. E. Grosch, and S. P. Lund. 2012. 1,500-year cycle in the Arctic oscillation identified in Holocene Arctic sea-ice drift. Nature Geoscience 5 (12):897–900. doi:10.1038/ngeo1629.
- Darby, D. A. 2014. Ephemeral formation of perennial sea ice in the Arctic Ocean during the middle Eocene. Nature Geoscience 7 (3):210–13. doi:10.1038/ngeo2068.
- Deschamps, C.-E., G. St-Onge, J.-C. Montero-Serrano, and L. Polyak. 2018. Chronostratigraphy and spatial distribution of magnetic sediments in the Chukchi and Beaufort Seas since the last deglaciation. Boreas 47 (2):544–64. doi:10.1111/bor.12296.
- Deschamps, C.-E., J.-C. Montero-Serrano, and G. St-Onge. 2018. Sediment provenance changes in the Western Arctic Ocean in response to ice rafting, sea level, and oceanic circulation variations since the last deglaciation. Geochemistry, Geophysics, Geosystems 19 (7):2147–65. doi:10.1029/2017gc007411.
- Deschamps, C.-E., J.-C. Montero-Serrano, G. St-Onge, and A. Poirier. 2019. Holocene changes in deep water circulation inferred from authigenic Nd and Hf isotopes in sediment records from the Chukchi-Alaskan and Canadian Beaufort margins. Paleoceanography and Paleoclimatology 34 (7):1038–56. doi:10.1029/2018pa003485.
- Dong, L., Y. Liu, X. Shi, L. Polyak, Y. Huang, X. Fang, J. Liu, J. Zou, K. Wang, F. Sun, et al. 2017. Sedimentary record from the Canada Basin, Arctic Ocean: Implications for late to middle Pleistocene glacial history. Climate of the Past 13 (5):511–31. doi:10.5194/cp-13-511-2017.
- Dong, L., L. Polyak, Y. Liu, X. Shi, J. Zhang, and Y. Huang. 2020. Isotopic fingerprints of ice-rafted debris offer new constraints on Middle to Late Quaternary Arctic circulation and glacial history. Geochemistry, Geophysics, Geosystems 21: e2020GC009019. https://doi.org/10.1029/2020GC009019
- Dupuy, C., A. Michard, J. Dostal, D. Dautel, and W. R. A. Baragar. 1992. Proterozoic flood basalts from the Coppermine River area, Northwest Territories: isotope and trace element geochemistry. Canadian Journal of Earth Sciences 29 (9):1937–43. https://doi.org/10.1139/e92-151
- Dyke, A. S. 2004. An outline of North American deglaciation with emphasis on central and northern Canada. Developments in Quaternary Science 2:373–424. doi:10.1016/S1571-0866(04)80209-4.
- Eccles, D. R., L. M. Heaman, R. W. Luth, and R. A. Creaser. 2004. Petrogenesis of the Late Cretaceous northern Alberta kimberlite province. Lithos 76 (1–4):435–59. doi:10.1016/j.lithos.2004.03.046.
- Eisenhauer, A., H. Meyer, V. Rachold, T. Tütken, B. Wiegand, B. T. Hansen, R. F. Spielhagen, F. Lindemann, and H. Kassens. 1999. Grain size separation and sediment mixing in Arctic Ocean sediments: Evidence from the strontium isotope systematic. Chemical Geology 158 (3–4):173–88. doi:10.1016/S0009-2541(99)00026.
- Elderfield, H. 1988. The oceanic chemistry of the rare-earth elements. Philosophical Transactions of the Royal Society Series A 325:105–06.
- Fagel, N., C. Not, J. Gueibe, N. Mattielli, and E. Bazhenova. 2014. Late Quaternary evolution of sediment provenances in the Central Arctic Ocean: Mineral assemblage, trace element composition and Nd and Pb isotope fingerprints of detrital fraction from the Northern Mendeleev Ridge. Quaternary Science Reviews 92:140–54. doi:10.1016/j.quascirev.2013.12.011.
- Fisher, T. G., D. G. Smith, and J. T. Andrews. 2002. Preboreal oscillation caused by a glacial Lake Agassiz flood. Quaternary Science Reviews 21 (8–9):873–78. doi:10.1016/S0277-3791(01)00148-2.
- Francis, D., and J. Ludden. 1990. The mantle source for olivine nephelinite, basanite, and alkaline olivine basalt at Fort Selkirk, Yukon, Canada. Journal of Petrology 31 (2):371–400. doi:10.1093/petrology/31.2.371.
- Frank, M. 2002. Radiogenic isotopes: Tracers of past ocean circulation and erosional inputs. Reviews of Geophysics 40 (1):1-1-1–38.
- Gamboa, A., J.-C. Montero-Serrano, G. St-Onge, A. Rochon, and P.-A. Desiage. 2017. Mineralogical, geochemical, and magnetic signatures of surface sediments from the Canadian Beaufort Shelf and Amundsen Gulf (Canadian Arctic). Geochemistry, Geophysics, Geosystems 18 (2):488–512. doi:10.1002/2016GC006477.
- Goldstein S. L., R. K. O’Nions, and P. J. Hamilton. 1984. A Sm-Nd isotopic study of atmospheric dusts and particulates from major river systems. Earth and Planetary Science Letters 70:221–236. https://doi.org/10.1016/0012-821X(84)90007-4.
- Grazulis, S., D. Chateigner, R. T. Downs, A. T. Yokochi, M. Quiros, L. Lutterotti, E. Manakova, et al. 2009. Crystallography Open Database - an open-access collection of crystal structures. Journal of Applied Crystallography 42:726–29. doi:10.1107/S0021889809016690
- Griffin, G. M. 1971. Interpretation of X-ray diffraction data. In Procedures in sedimentary petrology, ed. R. E. Carver, 541–72. New York: Wiley-Interscience.
- Gutjahr, M., M. Frank, C. Stirling, V. Klemm, T. van de Flierdt, and A. Halliday. 2007. Reliable extraction of a deepwater trace metal isotope signal from Fe-Mn oxyhydroxide coatings of marine sediments. Chemical Geology 242 (3–4):351–70. doi:10.1016/j.chemgeo.2007.03.021.
- Haley, B. A., M. Frank, R. F. Spielhagen, and J. Fietzke. 2008. Radiogenic isotope record of Arctic Ocean circulation and weathering inputs of the past 15 million years. Paleoceanography 23 (1):A1S13. doi:10.1029/2007PA001486.
- Harrison, J. C., M. R. St-Onge, O. V. Petrov, S. I. Strelnikov, B. G. Lopatin, F. H. Wilson, S. Tella, D. Paul, T. Lynds, S. P. Shokalsky, et al. 2011. Geological map of the Arctic. Geological Survey of Canada. “A” Series Map 2159A. doi:10.4095/287868.
- Henderson, G. M., D. J. Martel, R. K. Onions, and N. J. Shackleton. 1994. Evolution of seawater Sr-87/Sr-86 over the last 400 ka — The absence of glacial–interglacial cycles. Earth and Planetary Science Letters 128 (3–4):643–51. doi:10.1016/0012-821X(94)90176-7.
- Hill, P. H., S. M. Blasco, J. R. Harper, and D. B. Fissel. 1991. Sedimentation on the Canadian Beaufort Shelf. Continental Shelf Research 11 (8–10):821–42. doi:10.1016/0278-4343(91)90081-G.
- Hillaire-Marcel, C., J. Maccali, C. Not, and A. Poirier. 2013. Geochemical and isotopic tracers of Arctic sea ice sources and export with special attention to the Younger Dryas interval. Quaternary Science Reviews 79:184–90. https://doi.org/10.1016/j.quascirev.2013.05.001
- Hilton, R. G., V. Galy, J. Gaillardet, M. Dellinger, C. Bryant, M. O’Regan, D. R. Grocke, H. Coxall, J. Bouchez, and D. Calmels. 2015. Erosion of organic carbon in the Arctic as a geological carbon dioxide sink. Nature 524 (7563):84–87. doi:10.1038/nature14653.
- Holmes, R. M., J. W. McClelland, B. J. Peterson, I. A. Shiklomanov, A. I. Shiklomanov, A. V. Zhulidov, V. V. Gordeev, and N. N. Bobrovitskaya. 2002. A circumpolar perspective on fluvial sediment flux to the Arctic Ocean. Global Biogeochemical Cycles 16 (4):1098. doi:10.1029/2001GB001849.
- Jacobsen, S. B., and G. J. Wasserburg. 1980. Sm-Nd isotopic evolution of chondrites. Earth and Planetary Science Letters 50 (1):139–55. doi:10.1016/0012-821X(80)90125-9.
- Jakobsson, M., R. Macnab, L. Mayer, R. Anderson, M. Edwards, J. Hatzky, H. W. Schenke, and P. Johnson. 2008. An improved bathymetric portrayal of the Arctic Ocean: Implications for ocean modeling and geological, geophysical and oceanographic analyses. Geophysical Research Letters 35 (7):L07602. doi:10.1029/2008GL033520.
- Jakobsson, M., K. Andreassen, L.R. Bjarnadottir, D. Dove, J.A. Dowdeswell, J.H. England, S. Funder, et al. 2014. Arctic Ocean glacial history. Quaternary Science Reviews 92:40–67 https://doi.org/10.1016/j.quascirev.2013.07.033
- Kaparulina, E., K. Strand, and J. P. Lunkha. 2016. Provenance analysis of central Arctic Ocean sediments: Implications for circum-Arctic ice sheet dynamics and ocean circulation during Late Pleistocene. Quaternary Science Reviews 147:210–20. doi:10.1016/j.quascirev.2015.09.017.
- Keigwin, L. D., S. Klotsko, N. Zhao, B. Reilly, L. Giosan, and N. W. Driscoll. 2018. Deglacial floods in the Beaufort Sea preceded Younger Dryas cooling. Nature Geoscience 11 (8):599–604. doi:10.1038/s41561-018-0169-6.
- Klotsko, S., N. Driscoll, and L. Keigwin. 2019. Multiple meltwater discharge and ice rafting events recorded in the deglacial sediments along the Beaufort Margin, Arctic Ocean. Quaternary Science Reviews 203:185–208. doi:10.1016/j.quascirev.2018.11.014.
- Kobayashi, D., M. Yamamoto, T. Irino, Y. Park, S. Nam, N. Harada, K. Nagashima, K. Chikita, and S. Saitoh. 2016. Distribution of detrital minerals and sediment color in western Arctic Ocean and northern Bering Sea sediments: Changes in the provenance of western Arctic Ocean sediments since the last glacial period. Polar Science 10 (4):519–31. doi:10.1016/j.polar.2016.07.005.
- Krawitz, J.-H., 1982. The <2 µm fraction of some high Arctic glacial and glacial-marine sediments. In Arctic geology and geophysics: Proceedings of the third international symposium on Arctic geology, ed. A. F. Embry and H. R. Balkwill, 297–307. Calgary: Canadian Society of Petroleum Geologists.
- Krylov, A.A., I. A. Andreeva, C. Vogt, J. Backman, V.V. Krupskaya, G.E. Grikurov, K. Moran, and H. Shoji. 2008. A shift in heavy and clay mineral provenance indicates a middle Miocene onset of a perennial sea ice cover in the Arctic Ocean. Paleoceanography 23:A1S06. https://doi.org/10.1029/2007PA001497
- Kutos, O., A. Rochon, and J.-C. Montero-Serrano. 2021. Evolution of palaeo-sea-surface conditions and sediment dynamics over the last 2700 years on the Mackenzie Slope, Beaufort Sea (Canadian Arctic). Boreas 50 (3):893–914. doi:10.1111/bor.12513.
- Lakeman, T. R., A. J. Pienkowski, F. C. Nixon, M. F. A. Furze, S. Blasco, J. T. Andrews, and E. L. King. 2018. Collapse of a marine-based ice stream during the early Younger Dryas chronozone, western Canadian Arctic. Geology 46 (3):211–14. doi:10.1130/g39665.1.
- Ledneva, G. V., V. L. Pease, and S. D. Sokolov. 2011. Permo-Triassic hypabyssal mafic intrusions and associated tholeiitic basalts of the Kolyuchinskaya Bay, Chukotka (NE Russia): Links to the Siberian LIP. Journal of Asian Earth Sciences 40 (3):737–45. doi:10.1016/j.jseaes.2010.11.007.
- Lutterotti, L., M. Bortolotti, G. Ischia, I. Lonardelli, and H.-R. Wenk. 2007. Rietveld texture analysis from diffraction images. Zeitschrift Kristallographie Supplement 26:125–30.
- Maccali, J., C. Hillaire-Marcel, and C. Not. 2018. Radiogenic isotope (Nd, Pb, Sr) signatures of surface and sea ice-transported sediments from the Arctic Ocean under the present interglacial conditions. Polar Research 37 (1):1442982. doi:10.1080/17518369.2018.1442982.
- Macdonald, R. W., S. M. Solomon, R. E. Cranston, H. E. Welch, M. B. Yunker, and C. Gobeil. 1998. A sediment and organic carbon budget for the Canadian Beaufort Shelf. Marine Geology 144 (4):255–73. doi:10.1016/S0025-3227(97)00106-0.
- Margold, M., C. R. Stokes, and C. D. Clark. 2015. Ice streams in the Laurentide Ice Sheet: Identification, characteristics and comparison to modern ice sheets. Earth-Science Reviews 143:117–46. doi:10.1016/j.earscirev.2015.01.011.
- McCulloch, M. T., and G. J. Wasserburg. 1978. Sm-Nd and Rb-Sr chronology of continental crust formation. Science 200 (4345):1003–11. doi:10.1126/science.200.4345.1003.
- McCusker, L. B., R. B. von Dreele, D. E. Cox, D. Louër, and P. Scardie. 1999. Rietveld refinement guidelines. Journal of Applied Crystallography 32 (1):36–50. doi:10.1107/S0021889898009856.
- Meinhardt, A.-K., K. Pahnke, P. Böning, B. Schnetger, and H.-J. Brumsack. 2016. Climate change and response in bottom water circulation and sediment provenance in the central Arctic Ocean since the Last Glacial. Chemical Geology 427:98–108. doi:10.1016/j.chemgeo.2016.02.019.
- Meyer, I., G. R. Davies, and J.-B. W. Stuut. 2011. Grain size control on Sr-Nd isotope provenance studies and impact on paleoclimate reconstructions: An example from deep-sea sediments offshore NW Africa. Geochemistry, Geophysics, Geosystems 12:Q03005. doi:10.1029/2010GC003355.
- Millot, R., J. Gaillardet, B. Dupré, and C. J. Allègre. 2002. The global control of silicate weathering rates and the coupling with physical erosion: New insights from rivers of the Canadian Shield. Earth and Planetary Science Letters 196 (1–2):83–98. doi:10.1016/S0012-821X(01)00599-4.
- Millot, R., J. Gaillardet, B. Dupré, and C. J. Allègre. 2003. Northern latitude chemical weathering rates: Clues from the Mackenzie River Basin, Canada. Geochimica et Cosmochimica Acta 67 (7):1305–29. doi:10.1016/S0016-7037(02)01207-3.
- Moran, K., P. Hill, and S. Blasco. 1989. Interpretation of piezocone penetrometer profiles in sediment from the Mackenzie Trough, Canadian Beaufort Sea. Journal of Sedimentary Petrology 59 (1):88–97.
- Moser, F. C., and R. H. Hein. 1984. Distribution of clay minerals in the suspended and bottom sediments from the Northern Bering Sea shelf area, Alaska. U.S. Geological Survey Bulletin 1624:1–19.
- Murton, J. B., M. Frechen, and D. Maddy. 2007. Luminescence dating of mid- to Late Wisconsinan aeolian sand as a constraint on the last advance of the Laurentide Ice Sheet across the Tuktoyaktuk Coastlands, western Arctic Canada. Canadian Journal of Earth Sciences 44:857–69. https://doi.org/10.1139/e07-015
- Murton, J., M. Bateman, S. Dallimore, J. Teller, and Z. Yang. 2010. Identification of Younger Dryas outburst flood path from Lake Agassiz to the Arctic Ocean. Nature 464 (7289):740–43. doi:10.1038/nature08954.
- Naidu, A. S., D. C. Burrell, and D. W. Hood. 1971. Clay mineral composition and geologic significance of some Beaufort Sea sediments. Journal of Sedimentary Petrology 41 (3):691–94.
- Naidu, A. S., T. Mowatt, and J. Creager. 1982. Clay mineral dispersal patterns in the north Bering and Chukchi Seas. Marine Geology 47 (1–2):1–15. doi:10.1016/0025-3227(82)90016-0.
- Naidu, A. S., and T. Mowatt. 1983. Sources and dispersal patterns of clay minerals in surface sediments from the continental-shelf areas off Alaska. Geological Society of America Bulletin 94 (7):841–54. doi:10.1130/0016-7606(1983)94<841:SADPOC>2.0.CO;2.
- Not, C., and C. Hillaire-Marcel. 2010. Time constraints from 230Th and 231Pa data in late Quaternary, low sedimentation rate sequences from the Arctic Ocean: An example from the northern Mendeleev Ridge. Quaternary Science Reviews 29 (25/26):3665–75. doi:10.1016/j.quascirev.2010.06.042.
- Not, C., and C. Hillaire-Marcel. 2012. Enhanced sea-ice export from the Arctic during the Younger Dryas. Nature Communications 3 (1):647. doi:10.1038/ncomms1658.
- O’Brien, M., R. Macdonald, H. Melling, and K. Iseki. 2006. Particle fluxes and geochemistry on the Canadian Beaufort Shelf: Implications for sediment transport and deposition. Continental Shelf Research 2641–81. doi:10.1016/j.csr.2005.09.007.
- O’Regan, M., S. Blasco, H. Coxall, and R. Hill. 2018. Radiocarbon constraints on the deglacial and Holocene stratigraphy of the upper Mackenzie Trough, Canadian Beaufort Sea. Boreas 47 (4):1102–17. doi:10.1111/bor.12335.
- Ortiz, J. D., L. Polyak, J. M. Grebmeier, D. Darby, D. D. Eberl, S. Naidu, and D. Nof. 2009. Provenance of Holocene sediment on the Chukchi-Alaskan margin based on combined diffuse spectral reflectance and quantitative X-ray diffraction analysis. Global and Planetary Change 68 (1–2):73–84. doi:10.1016/j.gloplacha.2009.03.020.
- Peltier, W. R., G. Vettoretti, and M. Stastna. 2006. Atlantic meridional overturning and climate response to Arctic Ocean freshening. Geophysical Research Letters 33 (6):L06713. doi:10.1029/2005GL025251.
- Phillips, R. L., and A. Grantz. 2001. Regional variations in provenance and abundance of ice-rafted clasts in Arctic Ocean sediments: Implications for the configuration of late Quaternary oceanic and atmospheric circulation in the Arctic. Marine Geology 172 (1–2):91–115. doi:10.1016/S0025-3227(00)00101-8.
- Piercey, S. J., J. K. Mortensen, and R. A. Creaser. 2003. Neodymium isotope geochemistry of felsic volcanic and intrusive rocks from the Yukon-Tanana Terrane in the Finlayson Lake Region, Yukon, Canada. Canadian Journal of Earth Sciences 40 (1):77. doi:10.1139/e02-094.
- Polyak, L., J. Bischof, J. D. Ortiz, D. A. Darby, J. E. Channell, C. Xuan, D. S. Kaufman, et al. 2009. Late Quaternary stratigraphy and sedimentation patterns in the western Arctic Ocean. Global Planetary Change. 68(1–2):5–17. https://doi.org/10.1016/j.gloplacha.2009.03.014
- Porcelli, D., P. S. Andersson, M. Baskaran, M. Frank, G. Björk, and L. Semiletov. 2009. The distribution of neodymium isotopes in Arctic Ocean basins. Geochimica et Cosmochimica Acta 73 (9):2645–59. https://doi.org/10.1016/j.gca.2008.11.046
- Rachold, V., M. Grigoriev, F. Are, S. Solomon, E. Reimnitz, H. Kassens, and M. Antonow. 2000. Coastal erosion vs riverine sediment discharge in the Arctic Shelf seas. International Journal of Earth Sciences 89 (3):450–60. doi:10.1007/s005310000113.
- Reimer, P. J., E. Bard, A. Bayliss, J. W. Beck, P. G. Blackwell, C. Bronk Ramsey, C. E. Buck, H. Cheng, R. L. Edwards, M. Friedrich, et al. 2013. IntCal13 and Marine13 radiocarbon age calibration curves 0–50,000 years cal BP. Radiocarbon 55 (4):1869–87. doi:10.2458/azu_js_rc.55.16947.
- Schwab, M. S., J. D. Rickli, R. W. Macdonald, H. R. Harvey, N. Haghipour, and T. I. Eglinton. 2021. Detrital neodymium and (radio)carbon as complementary sedimentary bedfellows? The Western Arctic Ocean as a testbed. Geochimica et Cosmochimica Acta 315:101–26. doi:10.1016/j.gca.2021.08.019.
- Shearer, J. M. 1971. Preliminary reports of shallow seismic reflection profiles from the west side of Mackenzie Bay, Beaufort Sea. Report of Activities. Part B, Geological Survey of Canada, Paper 71-1, 131–38.
- Skolotnev, S. G., M. A. Fedonkin, and A. V. Korniychuk. 2017. New data on the geological structure of the southwestern Mendeleev Rise, Arctic Ocean. Doklady Earth Sciences 476 (1):1001–06. Original Russian Text ©. doi:10.1134/S1028334X17090173.
- Spielhagen, R.F., K.-H. Baumann, H. Erlenkeuser, N.R. Nowaczyk, N. Nørgaard-Pedersen, C. Vogt, and D. Weiel. 2004. Arctic Ocean deep-sea record of northern Eurasian ice sheet history. Quaternary Science Reviews 23:1455–83. doi:10.1016/j.quascirev.2003.12.015.
- Stein, R. 2008. Proxies used for palaeoenvironmental reconstructions in the Arctic Ocean. In Developments in marine geology volume 2, Arctic Ocean sediments: Processes, proxies, and paleoenvironment, ed. R. Stein, 133–243. Amsterdam: Elsevier. doi:10.1016/S1572-5480(08)00004-3.
- Stein, R., J. Matthießen, F. Niessen, A. Krylov, S. Nam, and E. Bazhenova. 2010. Towards a better (litho-) stratigraphy and reconstruction of Quaternary paleoenvironment in the Amerasian Basin (Arctic Ocean). Polarforschung 79 (2):97–121. doi:10.10013/epic.34884.d001.
- Stokes, C., C. D. Clark, D. A. Darby, and D. Hodgson. 2005. Late Pleistocene ice export events into the Arctic Ocean from the M’Clure Strait ice stream, Canadian Arctic Archipelago. Global and Planetary Change 49 (3–4):139–62. doi:10.1016/j.gloplacha.2005.06.001.
- Stokes, C., and L. Tarasov. 2010. Ice streaming in the Laurentide Ice Sheet: A first comparison between data-calibrated numerical model output and geological evidence. Geophysical Research Letters:37. doi:10.1029/2009GL040990.
- Süfke, F., M. Gutjahr, L. D. Keigwin, B. T. Reilly, L. Giosan, and J. Lippold. 2022. Arctic drainage of Laurentide Ice Sheet meltwater throughout the past 14,700 years. Communications Earth & Environment 3 (1):98. doi:10.1038/s43247-022-00428-3.
- Tarasov, L., and W. R. Peltier. 2005. Arctic freshwater forcing of the Younger Dryas cold reversal. Nature 435 (7042):662–65. doi:10.1038/nature03617.
- Toby, B. H. 2006. R factors in Rietveld analysis: How good is good enough? Powder Diffraction 21 (1):67–70. https://doi.org/10.1154/1.2179804
- Tütken, T., A. Eisenhauer, B. Wiegand, and B. T. Hansen. 2002. Glacial–interglacial cycles in Sr and Nd isotopic composition of Arctic marine sediments triggered by the Svalbard/Barents Sea ice sheet. Marine Geology 182 (3–4): 351–72. doi:10.1016/S0025-3227(01)00248-1.
- Viscosi-Shirley, C., K. Mammone, N. Pisias, and J. Dymond. 2003. Clay mineralogy and multi-element chemistry of surface sediments on the Siberian-Arctic shelf: Implications for sediment provenance and grain size sorting. Continental Shelf Research 231175–200. doi:10.1016/S0278-4343(03)00091-8.
- Vogt, C. 1997. Regional and temporal variations of mineral assemblages in Arctic Ocean sediments as climatic indicator during glacial/interglacial changes. Reports on Polar Research 251:309.
- Vogt, C., and J. Knies. 2008. Sediment dynamics in the Eurasian Arctic Ocean during the last deglaciation — The clay mineral group smectite perspective. Marine Geology 250 (2008):211–22. doi:10.1016/j.margeo.2008.01.006.
- Vonk, J. E., L. Giosan, J. Blusztajn, D. Montlucon, E. Graf Pannatier, C. McIntyre, L. Wacker, R. W. MacDonald, M. B. Yunker, and T. I. Eglinton. 2015. Spatial variations in geochemical characteristics of the modern Mackenzie Delta sedimentary system. Geochimica et Cosmochimica Acta 171100–20. doi:10.1016/j.gca.2015.08.005.
- Wagemann, R., G. J. Brunskill, and B. W. Graham. 1977. Composition and reactivity of some river sediments from the Mackenzie Valley, N.W.T., Canada. Environmental Geology 1:349–58.
- Wang, R., L. Polyak, W. Zhang, X. Y, L. Ye, L. Dong, Y. Liu, W. Wang, and B. Diekmann. 2021. Glacial-interglacial sedimentation and paleocirculation at the Northwind Ridge, western Arctic Ocean. Quaternary Science Reviews 258:106882. doi:10.1016/j.quascirev.2021.106882.
- Wegner, C., K. E. Bennett, A. de Vernal, M. Forwick, M. Fritz, M. Heikkilä, M. Lacka, H. Lantuit, M. Laska, M. Moskalik, et al. 2015. Variability in transport of terrigenous material on the shelves and the deep Arctic Ocean during the Holocene. Polar Research 34:24964. doi:10.3402/polar.v34.24964.
- Weis, D., B. Kieffer, C. Maerschalk, J. Barling, J. de Jong, G. A. Williams, D. Hanano, W. Pretorius, N. Mattielli, S. Scoates, et al. 2006. High-precision isotopic characterization of USGS reference materials by TIMS and MC-ICP-MS. Geochemistry Geophysics Geosystems 7:Q08006. doi:10.1029/2006GC001283.
- Xiao, W., L. Polyak, R. Wang, C. Not, L. Dong, Y. Liu, T. Ma, and T. Zhang. 2021. A sedimentary record from the Makarov Basin, Arctic Ocean, reveals changing middle to Late Pleistocene glaciation patterns. Quaternary Science Reviews 270:107176. doi:10.1016/j.quascirev.2021.107176.
- Zimmermann, B. E., D. Porcelli, M. Frank, P. S. Andersson, M. Baskaran, D. Lee, and A. N. Halliday. 2009. Hafnium isotopes in Arctic Ocean water. Geochimica et Cosmochimica Acta 73 (11):3218–33. https://doi.org/10.1016/j.gca.2009.02.028
- Zou, H. 2016. An X-ray diffraction approach: Bulk mineral assemblages as provenance indicator of sediments from the Arctic Ocean. PhD Thesis, diss, University of Bremen, Bremen.