
ABSTRACT
Arctic permafrost soils store substantial reserves of organic matter (OM) from which microbial transformation contributes significantly to greenhouse gas emissions of CH4 and CO2. However, many younger sediments exposed by glacier retreat and sea level change in fjord landscapes lack significant organic carbon resources, so their capacity to promote greenhouse gas emissions is unclear. We therefore studied the effects of increased temperatures (4°C and 21°C) and OM on rates of Fe(III) reduction, CO2 production, and methanogenesis in three different Holocene sedimentary units from a single site within the former marine limit of Adventdalen, Svalbard. Higher temperature and OM addition generally stimulated CH4 production and CO2 production and an increase in Bacteria and Archaea abundance in all units, whereas an equal stimulation of Fe(II) production by OM amendment and an increase in temperature to 21°C was only observed in a diamicton. We observed an accumulation of Fe(II) in beach and delta deposits as well but saw no stimulating effect of additional OM or increased temperature. Interestingly, we observed a small but significant production of CH4 in all units despite the presence of large reservoirs of Fe(III), sulfate, and nitrate, indicating either the availability of substrates that are primarily used by methanogens or a tight physical coupling between fermentation and methanogenesis by direct electron transfer. Our study clearly illustrates a significant challenge that comes with the large heterogeneity on a narrow spatial scale that one encounters when studying soils that have complex histories.
Introduction
Permafrost soils hold major reservoirs of organic matter (OM; e.g., Schuur et al. Citation2008, Citation2015; Tarnocai et al. Citation2009; Ping et al. Citation2015; Schostag et al. Citation2015) with at least 1,672 to 1,700 petagrams (Pg; 1 Pg = 1 billion metric tons) of OM in the northern circumpolar permafrost zone alone (Schuur et al. Citation2008; Elberling et al. Citation2013). This almost equals the amount of OM stored in all non-permafrost soils globally (Waldrop et al. Citation2010). As a large OM reservoir, permafrost soils therefore play an important role in the global carbon cycle, and their stability is a risk related to climate change (Khvorostyanov et al. Citation2008; Frank-Fahle et al. Citation2014). Global climate models predict a significant increase in air temperature in the Arctic of up to 7°C to 8°C over land by the end of this century (e.g., Solomon et al. Citation2007). Consequently, the capacity for permafrost to store OM will be reduced by thaw and the onset of enhanced microbial activity, resulting in greater emissions of carbon as greenhouse gases (Bischoff et al. Citation2013). However, not all active layer and permafrost sediments are rich in organic carbon because of their sometimes unfavorable conditions for its production and preservation. These sites include glacial forefields and areas with glacio-marine/deltaic sediments that have formed downstream of retreating glaciers and ice sheets, in many cases in-filling fjord valleys prior to their uplift and transformation into terrestrial permafrost. Examples of the latter are found along the coast of West Spitsbergen, the location of the present study (Cable et al. 2017; Gilbert et al. Citation2018). Here there is uncertainty in the composition and magnitude of soil carbon emissions, and it is unclear whether wetter summers and increased thaw (Førland et al. Citation2011) will negatively influence soil carbon storage and increase emissions.
As air and ground temperatures increase, the active layer thickens, which has been observed in Greenland (Elberling et al. Citation2013), Russia (Streletskiy et al. Citation2015), Canada (Bischoff et al. Citation2013), and Svalbard (Boike et al. 2009) at rates of up to 1 cm yr−1. The subsequent deepening of the active layer into the permafrost liberates new OM and nutrients to active layer microbial communities (Waldrop et al. Citation2010). It has also been suggested that higher temperatures in combination with increasing access to bioavailable OM trigger an irreversible process of thawing, leading to deep soil respiration, powered by self-sustaining heat due to increased microbial metabolic activity (Khvorostyanov et al. Citation2008; Tarnocai et al. Citation2009) and thus greater CO2 and CH4 fluxes (Schuur et al. Citation2008; Tveit et al. Citation2013; Frank-Fahle et al. Citation2014; Knoblauch et al. Citation2018). The mobilization of the OM stocks will also enable the export of organic matter and nutrients into downstream environments, especially if hydrological conditions, such as an increase in precipitation, allow it (Frey and McClelland Citation2009; Hessen et al. Citation2010). Recent research therefore identifies permafrost thaw and rainfall as the two main reasons for increased export of macronutrients and organic matter to coastal areas (Frey and McClelland Citation2009). Though this has been shown for various macronutrients and dissolved OM (Keller, Blum, and Kling Citation2007, Citation2010; Reyes and Lougheed Citation2015), the mobilization of Fe and its effect on adjacent ecosystems also needs to be elucidated (Nixon et al. Citation2017). This lack of research focus is likely due to the traditional perception of permafrost environments as greenhouse gas hotspots (Ganzert et al. Citation2007) with an overshadowing focus on CH4 due to its strong greenhouse gas potency (Walter et al. Citation2006; Mackelprang et al. Citation2016). Fe(III) reduction, however, could in fact be a more significant process in active layer and permafrost environments (Mackelprang et al. Citation2016). Fe(III) reduction, leading to high concentrations of labile Fe(II) and, through adsorption of OM and P, has particular relevance to the downstream fertilization of coastal and marine environments (Hodson, Mumford, and Lister Citation2004; Whaley, Leinen, and Whilden Citation2009; Nixon et al. Citation2017). To this end, Svalbard serves as an excellent location for determining the dynamics and importance of Fe(III) reduction in the abundant deposits of glacial and periglacial sediments that are low in OM. Recent groundwater research on the alluvial fans of Svalbard supports the assertion that such sediments have the capacity to increase the flux of Fe into adjacent streams by 40 percent (Hodson, Nowak, and Christiansen Citation2015) due to a metabolically active microbial community within them.
In the light of this, in the present study we examined glacial and periglacial sediments with different histories of formation that were found in such a system and
determined the potential for iron mobilization in response to Fe(II) production,
established rates of CH4 and CO2 formation,
established an inventory of the microbial communities in sedimentary units, and
detected changes in total microbial population size by determining 16S rRNA gene copy numbers
as a function of increased temperature and enhanced organic matter availability. This was achieved through a combination of geochemical analyses of the soil, microcosm incubations, and 16S rRNA gene-based molecular investigations. Combining these measurements, we obtained quantitative data on the three different units, potential as sources of Fe(II) and greenhouse gases due to increasing temperature and the availability of fresh OM.
Materials and methods
Sampling site
Sediment was collected in August 2015 at an erosion surface of a gulley incised into sediments deposited below the former marine limit (62 m.a.s.l.) at the mouth of Bolterdalen, central Spitsbergen (78°10.36′N, 15°56.83′E; ). Bolterdalen is a north–south-oriented tributary valley to the main valley Adventdalen. Meltwater from the glaciers Scott Turnerbreen and Rieperbreen drains through Bolterdalen and talus deposits cover the valley sides. The climate is polar tundra (Humlum, Instanes, and Sollid Citation2003) with a mean annual air temperature of −4.6°C and a mean annual precipitation of 181 mm (1981–2010) at Svalbard Airport, 8 m.a.s.l., 10 km westwards (Førland et al. Citation2011). The permafrost is continuous with a thickness in coastal areas of ~100 m (Liestøl Citation1977) and has an active layer thickness of ~0.8 m (Christiansen et al. Citation2010).
Figure 1. Adventdalen and the sampling site in Bolterdalen (www.toposvalbard.npolar.no).
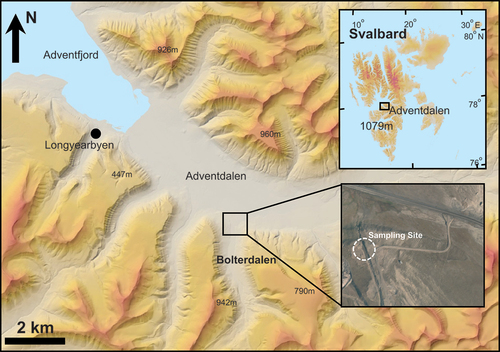
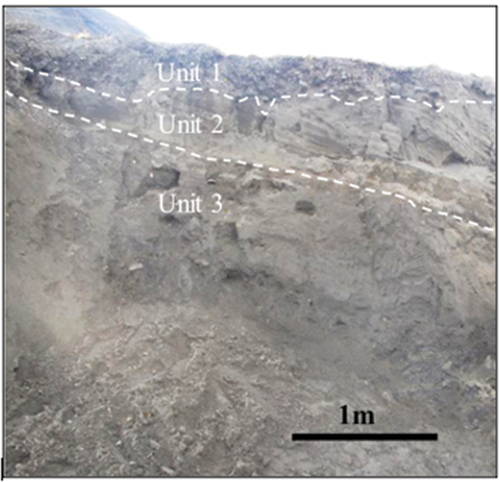
Locally, the sampling location is known as the “Whalebone Site” due to the exposure of a whalebone in the sediments. The Holocene history and sedimentary facies of this outcrop have been described in detail by Lønne (Citation2005) because of the representativeness of the site for the valley infill sediments found within the region (Gilbert et al. Citation2018). In brief, the sediments were deposited during a period of glacier advance in Bolterdalen in the Early Holocene (~9.8–9.6 ka BP; Lønne Citation2005). Unit 1 (equivalent to Unit 4 in Lønne Citation2005) is a diamicton consisting of former glaciofluvial and delta deposits, which has been subglacially entrained during glacier advance and deposited as a submarine deformation till. Unit 2 (equivalent to the upper part of Unit 3 in Lønne Citation2005) is a sandy, laminated beach facies formed as wave-influenced foreset beds during delta progradation into the Early Holocene Adventfjorden. Unit 3 (equivalent to the lower part of Unit 3 in Lønne Citation2005) is of marine origin and is a muddy delta facies, alternating between laminated beds, mudflows, and gravelly debris flows, developed as a foreset at a more distal position of the progradation than Unit 2. Unit 3 is rich in shells such as Mya truncata, which form local hotspots of Fe-oxyhydroxides as indicated by the presence of Fe(OOH) deposits in the vicinity of the shells. A whalebone is also redeposited in this unit after being subglacially transported from the former beach. All three units are easily distinguishable in the field by color (). The thermal characteristics of the sedimentary units are complicated by their exposure following recent gully incision. This commenced after diversion of the watercourse upstream at some point in time after 1991, resulting in rapid gulley incision thereafter. As a result, Unit 1 is typical of the active layer in the area, and Units 2 and 3 have been transformed into the active layer following recent permafrost thaw.
Figure 2. Detail of the section sampled for the study, showing three discrete sedimentary units.
Sample collection and storage
Sediment samples were collected on 28 August 2015 from a vertical profile exposed along the east-facing gulley slope. First, the profile was cleaned by removing the outermost 3 to 5 cm of sediment. Material from each unit was then collected in separate sterile polypropylene sampling bags using a flame-sterilized trowel to minimize contamination. Samples were stored for two days at 4°C before being transported by plane to Aarhus University, Denmark. Upon arrival, a subsample of each unit was transferred to a −20°C freezer, where it was stored for molecular work. The rest of the sample was stored at 4°C in the dark and used for biogeochemical studies.
Sediment characterization
A subsample (50 g) of each unit was air-dried for 24 hours prior to analysis and then gently crushed by hand in a mortar. The aggregate-free samples were then sieved through a 2-mm mesh. A subsample of 25 g was ground on a Disc Mill RS 200 equipped with a wolfram–carbide mortar (Retsch GmbH, Haan, Germany) for 1 minute at 920 rpm. The ground fraction <125 μm was analyzed on an elemental analyzer (Thermo Elemental Analyzer, Flash EA 1112 HT, Thermo Fisher Scientific) for both total and organic carbon and nitrogen, and C/N ratios were determined according to manufacturer’s instructions.
The remaining sieved material (25 g) was repeatedly treated with 6 percent H2O2 to oxidize all organic matter and then dried for 24 hours at 110°C following standard procedures described in Nørnberg and Dalsgaard (Citation2009). Treated samples were then suspended in 300 mL 0.002 M Na4P2O7 and separated into three fractions by sieving: <63, <250, and >250 μm. The fractions were prepared for particle size analysis and processed on a HELOS laser diffraction sensor equipped with a QUIXEL dispersion unit (Sympatec GmbH, Clausthal-Zellerfeld, Germany) following a protocol described in Nørnberg and Dalsgaard (Citation2009). Raw data were visualized on the WINDOX 5 software package (Sympatec GmbH, Clausthal-Zellerfeld, Germany).
The water content was determined gravimetrically in triplicates. Ten grams of sediment from each unit was transferred to preweighed vessels and dried at 110°C for 24 hours before being reweighed. The water content was calculated as percentage difference between dried and nondried sediment mass (Nørnberg and Dalsgaard Citation2009).
Sulfate and nitrate were measured by ion chromatography on a Dionex IC 3000 system (Dionex, Sunnyvale, CA).
To determine pH of the samples, 5 g of sediment (triplicates of each unit) was weighed out into vials and mixed with 5 mL of Milli-Q water (to determine actual pH) or 1 M potassium chloride (KCl; to determine potential pH). Samples were stirred over a period of 30 minutes and then left to settle for 30 minutes (Bárcena, Yde, and Finster Citation2010). This procedure was repeated four times. The pH measurements were conducted using a SevenCompact S220 pH meter.
Microcosm incubations
To track the processes of Fe(III) reduction and CH4 and CO2 production, slurries were prepared by mixing 50 g of sediment and 50 mL of Milli-Q water in 120 mL serum bottles together with a Teflon-coated magnetic bar. Bottles were flushed with nitrogen (N2) to ensure incubation under anoxic conditions. Each bottle was sealed with a rubber stopper and a crimp cap (20 mm, open center). A thick needle (2.10 × 80 mm, 14 g) was inserted through the rubber stopper and a stopcock (three-way, male, with a lock) connected for the purpose of sampling. Triplicates of each unit were incubated in the dark under two different temperature conditions: at 4°C and 21°C. An additional incubation was run at 4°C with OM amendment. We are aware that the 21°C incubations are unrealistic with respect to in situ conditions. Nevertheless, we included these studies to investigate the potential of the studied processes as well as their sensitivity to increased temperatures. We chose 21°C because at this temperature both the mesophilic and psychrotrophic fractions of the microbial community are supposed to be active. For the incubations with addition of OM, dry beech leaves were crushed in a mortar and autoclaved. One gram of dry leaf material was added to each bottle before being sealed. We carried out OM amendment studies to evaluate the quality of the indigenous organic matter. Beech leaves were chosen for OM amendment because in our view, they represent a realistic carbon source to address our research questions. The slurries were stagnant in between samplings and only stirred during sampling of slurry and gas samples with syringes.
Fe(II), Fe(III), CH4, and CO2 measurements
Sampling was conducted approximately every third day (including initial measurements immediately after serum bottles were sealed). To ensure consistency of the collected subsamples, the bottles were put on a magnetic stirring plate (1,200 rpm, Heidolph MR Hei-Standard) while sampling. A 1 mL syringe was filled with oxygen-free N2 and injected into the bottle through the stopcock. A subsample was taken out and approximately 0.1 g (precise amount determined gravimetrically) of the slurry was added to 0.9 mL of hydrochloric acid (HCl) in a 1.5 mL Eppendorf tube (for Fe(II) and Fe(III) measurements) and vortexed briefly. Fe was extracted over a period of 24 hours with 1 M HCl (Braunschweig et al. Citation2012). Quantification of Fe was carried out using the FerroZine assay as described in Braunschweig et al. (Citation2012). After centrifuging the samples at 13,400 rpm for 2 minutes (Eppendorf MiniSpin), 3 to 5 μL of the acidified sample was mixed with FerroZine solution to a final volume of 300 μL in a microtiter plate (96-well, F, Sarstedt, Germany). Absorbance was measured on a plate reader (FLUOstar Omega) at 562 nm.
For Fe(III) measurements, an aliquot (100 μL) of the acidified sample was added to 900 μL of 1 M hydroxylamine hydrochloride (HONH2·HCl) in an Eppendorf tube and mixed at 1,000 rpm for 15 minutes at room temperature (Eppendorf Thermomixer 5437) to reduce total Fe(III) to Fe(II). An aliquot (3–5 μL) was mixed with the FerroZine solution and absorbance was measured as described above. Fe(III) was calculated as the difference between total extractable Fe and Fe(II).
The iron reduction rate was estimated by fitting Fe(II) concentration data to three linear models (one for each unit) using the lm function in R v4.0.5 (R Core Team Citation2021). Differences in rates between the three treatments in each unit were tested using the emtrends and pairs functions from the emmeans package v1.5.5–1 (Lenth Citation2021). Comparisons where p < .05 were considered significantly different rates.
CH4 measurements were performed on a gas chromatograph (SRI 310 GC internal air compressor; oven temperature: 50°C; detector temperature: 155°C; carrier gas: helium) equipped with a flame ionization detector. Slurry in serum bottles was stirred on a magnetic plate and 500 μL of headspace sample was injected into the gas chromatograph with an airtight syringe. CO2 production was measured in the same way via a thermal conductivity detector with an oven temperature of 150°C, a detector temperature of 155°C, and using helium as a carrier gas at the end of the incubation period. The total amount of CO2 that was produced during the incubation was determined by accounting for CO2, bicarbonate, and carbonate in the slurry assuming equilibrium between the gas phase and the slurry and accounting for pH.
DNA extraction
DNA was extracted from both original material (subsamples of each unit stored at −20°C) and the slurry incubations (extract from the slurry after 30 days of microcosm incubation were only used for quantitative real-time polymerase chain reaction [qPCR]), using a PowerSoil DNA Isolation kit (Mo Bio Laboratories, Inc.) following the manufacturer’s protocol. To maximize DNA yield, 1 g of sediment/slurry material was added to the PowerBead tubes in the first step as opposed to 0.25 g as suggested by the manufacturer’s protocol. The DNA yield was quantified using a Qubit 2.0 HS fluorometer (Thermo Fisher Scientific) immediately after DNA extraction following the manufacturer’s protocol. DNA extracts were then frozen at −20°C for further downstream analyses.
DNA sequencing
DNA sequencing was performed on DNA extracts on an Illumina MiSeq system following a modified version of the manufacturer’s protocol for 16S rRNA gene amplicon preparation (Illumina, Inc.). An initial PCR run with primers Bac341F (5′−3′) (CCTACGGGNGGCWGCAG) and Bac805R (5′−3′) (GACTACHVGGGTATCTAATCC) (Klindworth et al. Citation2013) was performed on a Veriti Thermal Cycler (Applied Biosystems). The reaction mixture was as follows: DNA (2 μL), 2× KAPA HiFi HotStart ReadyMix (Kapa Biosystems; 12.5 μL), dH2O (8 μL), bovine serum albumin (1.5 μL), Primer F (0.5 μL), and Primer R (0.5 μL). The PCR reaction conditions included (1) initial denaturation for 3 minutes at 95°C; (2) 20 cycles of amplification (denaturation for 30 seconds at 95°C, annealing for 30 seconds at 50°C, and elongation for 30 seconds at 72°C), and (3) elongation for 5 minutes at 72°C. PCR products were then purified using AMPure XP Beads (Beckman Coulter Inc.; 25 μL PCR product to 30 μL beads) in a 96-well 0.8 mL MIDI plate (Thermo Fisher Scientific) placed on a magnetic stand-96 (Thermo Fisher Scientific). Purified products were eluted in 50 μL 10 mM Tris-HCl, pH: 8.5. A second PCR was performed on purified products with adapter primers Bac341F and Bac805R. The reaction mixture of DNA (2.5 μL), primer R (5 L), primer F (5 μL), 2× KAPA HiFi HotStart ReadyMix (12.5 μL) was run for ten cycles under the same conditions as above. PCR products were purified and eluted again (25 μL PCR product to 20 μL beads). Agarose gel electrophoresis (30 min, 120 V) was performed to confirm the success of the previous two PCR runs. The final PCR was performed with specific Nextera XT Index primers (Illumina, Inc.): DNA (2.5 μL), Nextera XT Index primer 1 (N7xx; 2.5 L), Nextera XT Index primer 2 (S5xx; 2.5 μL), 2× KAPA HiFi HotStart ReadyMix (12.5 μL), dH2O (5 μL). The PCR machine was set to the described conditions for eight cycles. PCR products were then run on the MiSeq following the manufacturer’s protocol for 16S Metagenomic Sequencing Library preparation.
qPCR assay
qPCR assay was performed on all samples to enumerate 16S rRNA gene copies. For this purpose, two separate assays were conducted, one targeting Bacteria and one targeting Archaea. The assays were performed according to a protocol described in Nielsen et al. (Citation2014) on a LightCycler 480 System (Roche, Germany). The combination of primers to target bacterial 16S rRNA genes was Bac908F (5′−3′) (AACTCAAAKGAATTGACGGG) and Bac1075R (5′−3′) (CACGAGCTGACGACARCC) (Starnawski et al. Citation2017). The archaeal 16S rRNA genes were targeted with the primers Arch915F (5′−3′) (AATTGGCGGGGGAGCAC) and Arch1059R (5′−3′) (GCCATGCACCWCCTCT) (Starnawski et al. Citation2017).
Bioinformatics analysis of 16S rRNA gene sequencing
Primers were trimmed from the ends of the forward and reverse reads using cutadapt v1.15 (Martin Citation2011). Sequences were then processed into amplicon sequence variants and merged, chimeras were removed, and then classified using dada2 v1.12.1 (Callahan et al. Citation2016). The Silva database v132 was used for classification (Quast et al. Citation2013). Bar plots were plotted using the phyloseq package v1.28.0 (McMurdie and Holmes Citation2013). Bray-Curtis distances were calculated using the distance function in the phyloseq package v1.28.0 (McMurdie and Holmes Citation2013). Genera capable of Fe(III) respiration or Fe(II) oxidation were identified using the FAPROTAX database v1.1 (Louca, Parfrey, and Doebeli Citation2016). The FAPROTAX database was updated to recognize the genus Paenibacillus as capable of iron respiration in line with recent research (Loyaux-Lawniczak, Vuilleumier, and Geoffroy Citation2019).
16S rRNA gene sequencing data have been submitted to NCBI and are available under BioProject accession number PRJNA813740.
Statistical analyses
All statistical analyses were performed using SPSS v22 (IBM Analytics). Data were tested for normality and statistical significance was tested using Mann-Whitney U, Kruskal-Wallis, and one-tailed t tests. These were scored significant at p < .05.
Results
The three units differed greatly in their physical and chemical properties (). The water content was low across all units, in the range of 8 to 18 percent. Actual pH was close to neutral in all three units, with Unit 1 being the only facies with pH below 7 (almost one pH unit lower than the other two). A difference between actual and potential pH of approximately one unit was observed in all units, indicating a low base saturation of the soils (Bárcena, Finster, and Yde Citation2011).
Table 1. Main sedimentological characteristics of the three sedimentological units.
The nitrate concentrations found in undiluted samples of Unit 1 (18.18 mM) and Unit 2 (4.56 mM) were extremely high. Because of the high in situ concentrations in Units 1 and 2, the start concentrations of nitrate in the slurries were about 1,300 and 560 µM, respectively, and only 10 µM in Unit 3. Also, the sulfate concentrations were extremely high in undiluted soil samples of the Unit 2 (45.9 mM) and Unit 3 (32.2 mM; ). In the slurries, after addition of 50 mL of water, the sulfate concentrations were approximately 0.4, 5.6, and 1.5 mM, respectively.
The phase distribution of Fe varied greatly with depth. In the uppermost Unit 1, a large fraction (72.2 percent) of the total Fe was in a ferric form (Fe(III)), whereas the other two units showed a more balanced Fe distribution between ferric and ferrous (Fe(II)). The particle size distribution defined the sediment type as loam for both Unit 1 and Unit 2 and as silt loam for Unit 3 (Groenendyk et al. Citation2015). Unit 1 showed the lowest value for both organic and inorganic C/N ratios in comparison to the other units.
Fe(III) reduction, methane production, and CO2 production
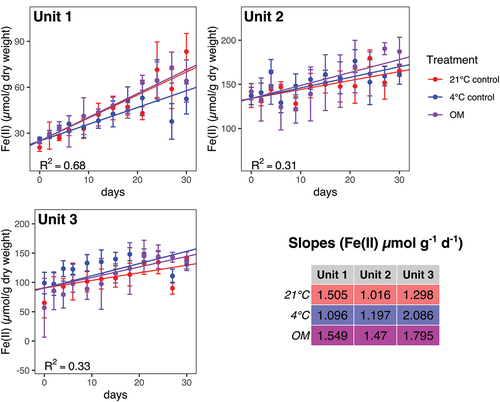
The rates (see table in ) were significantly different for Unit 1, where the 4°C treatment resulted in a significantly slower Fe(II) production rate than the other two treatments. The concentration of Fe(II) also increased in Units 2 and 3. However, they were not affected by the treatment, because no significant differences were found.
Figure 3. Fe(II) concentration data and linear models for iron reduction rates for incubations from three geological units with three treatments; 21°C (red circles), 4°C (blue circles), and 4°C with OM amendment (magenta circles). Points show mean values (n = 3 for each point), with error bars showing a single standard deviation. The rates (slopes) were significantly different for Unit 1, where the 4°C treatment resulted in a significantly slower rate than the other two treatments. No other rates were significantly different from one another for a given unit. Note that the linear model is based on the entire data set, not just the mean values displayed here.
Methanogenesis was found in all units (), although at much lower rates in comparison to Fe(II) production, as evident by the vast differences in production rates between Fe(II) and CH4, which were severalfold lower (, ). The amounts of CH4 produced were in the nanomole range in all three units. The greatest production rates were observed in Unit 2 across all treatments; this unit has the lowest content of organic matter with the highest C/N ratio and thus the poorest type of organic matter of the three units. Methanogenesis was stimulated significantly by both OM amendment and higher temperature in all three units (). The most pronounced difference compared to the 4°C treatment was observed in Unit 1 (fourfold increase for OM and sixfold increase for 21°C).
Table 2. Production rates (µmol g−1 dw d−1) of CO2 from incubation experiment 2.
Table 3. 16S rDNA gene copy number of Bacteria and Archaea per gram of sediment dry weight quantified after thirty days of incubation under three conditions, 4°C, 4°C with addition of organic matter, and 21°C, in the three units: Unit 1 (diamicton), Unit 2 (beach), Unit 3 (delta).
Table 4. The ratio between amount of CO2 determined from Fe(II) production rates assuming that Fe(III) reduction was exclusively heterotrophic and CO2 production determined from CO2 measurements in the headspace of the slurries vessel.
Figure 4. CH4 production under three conditions (magenta circle: 4°C with addition of organic matter, blue circles: 4°C, red circles: 21°C) in the three units: (a) Unit 1 (diamicton), (b) Unit 2 (beach), (c) Unit 3 (delta). Each data point is a mean, calculated from triplicates. Concentration is shown in nanomoles per gram dry weight.
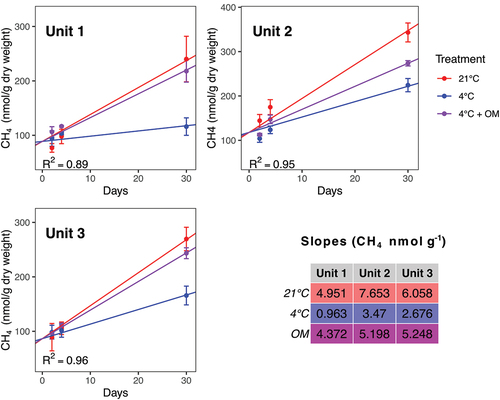
In Units 1 and 3, the methane production rates determined at 4°C were significantly lower than the rates determined at 4°C with organic matter amendment and rates determined at 21°C (p < .0001). The rates determined at 21°C and at 4°C with organic matter amendment were not significantly different from each other. In Unit 2 all methane production rates were significantly different from each other (p < .006).
The total amount of CO2 that was produced over the course of thirty days was determined at the end of the incubation from the amount of CO2 measured in the gas phase (). It revealed great differences between the units, as well as across the different treatments. The largest amount of CO2 was measured in Unit 2 for all treatments, followed by Unit 1 and Unit 3. CO2 production in Unit 1 exceeded CO2 production in Unit 3 in the 4°C and the 21°C incubations, whereas CO2 production in Unit 3 exceeded CO2 production in Unit 1 in the 4°C + organic matter amended treatment. Both OM amendment and 21°C treatments stimulated CO2 production in all units compared to the 4°C slurries. Within-unit comparison revealed that the addition of fresh organic matter had a more pronounced effect on CO2 production than raising the temperature from 4°C to 21°C in all units.
Numbers of bacteria and archaea cells determined by qPCR
An increase in abundance (although not significant) of Bacteria was observed in 4°C + OM treatment and the 21°C treatment in Unit 1 () and the OM amendment had a significant effect on bacterial abundance in both Unit 2 and Unit 3 (p = .033 and .040, respectively) in comparison to the 4°C treatment without OM amendment after thirty days of incubation. The statistical significance of the effect of a temperature rise to 21°C on bacterial and archaeal abundance could not be evaluated for Unit 2 and Unit 3 because they were based on a single data point due to the low efficiency of the qPCR run for these samples resulting from difficulties during the DNA extraction. No significant change in abundance of archaeal 16S rRNA genes was observed after thirty days of incubation. The bacterial population was significantly greater in Unit 1 (p = .031), whereas there was no significant difference in size of both populations in Unit 3 after thirty days of incubation. Organic matter amendment had the strongest effect on the increase of the bacterial population in Units 2 and 3, whereas there was no significant effect in Unit 1. An increase in temperature had very little effect over a period of thirty days. The only effect on the size of the archaeal community was observed in Unit 2 after organic matter amendment.
Microbial community diversity
The microbial community within the three units was determined by next-generation Illumina sequencing. A mean of 50,583 reads per sample was obtained; triplicates showed a very high degree of similarity and were hence pooled. Units 2 and 3 were more similar to each other (Bray-Curtis 0.917) than they were to Unit 1 (Bray-Curtis distances of 0.997 and 0.982, respectively). A distance of 0 indicates identical composition, and a distance of 1 indicates completely dissimilar samples.
The most abundant phylum across all samples was Proteobacteria (), accounting for 15 to 62 percent of all sequences. Unit 2 and Unit 3 consistently exhibited a higher number of reads than Unit 1 across treatments.
Figure 5. Taxonomic assignment of relative abundance of bacterial 16S rRNA gene sequences at the phylum level of the three units (1 = diamicton, 2 = beach, 3 = delta). “Others” combines minor phyla never exceeding 5 percent of any sample.
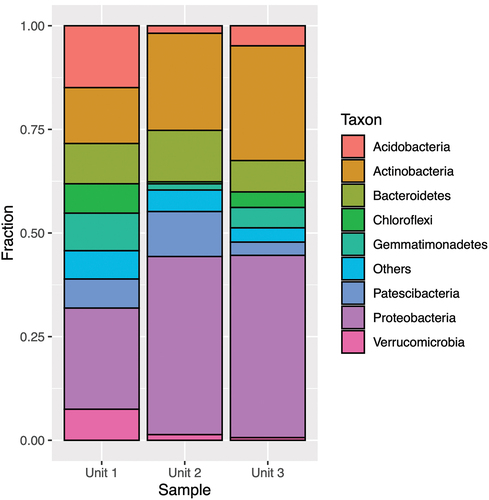
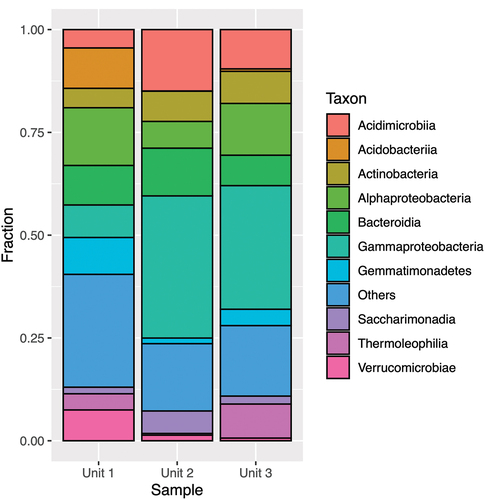
In Unit 1, the second most abundant phylum was Acidobacteria (13–15 percent), and for Unit 2 and Unit 3 the second most abundant phylum was Actinobacteria (10–28 percent). The class structure () showed pronounced dominance of Alphaproteobacteria for Unit 1 (5–14 percent) and Gammaproteobacteria for Unit 2 and Unit 3 (30–57 percent).
Figure 6. Taxonomic assignment of relative abundance of bacterial 16S rRNA gene sequences at the class level of the three units (1 = diamicton, 2 = beach, or 3 = delta). “Others” combines minor classes never exceeding 5 percent of any sample.
Bacterial taxa with iron cycling potential
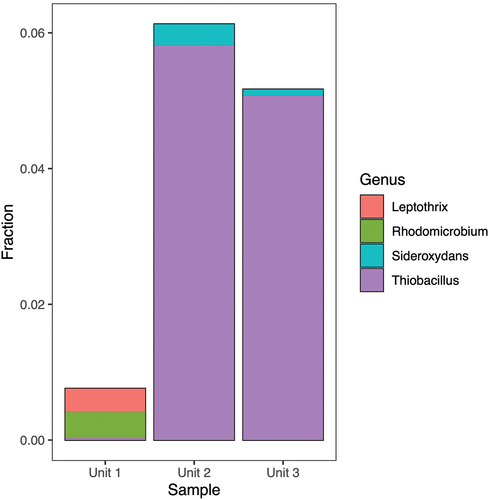
In all three units 16S rRNA gene sequences were found that are highly similar to 16S rRNA gene sequences of taxa that can either reduce Fe(III) () or oxidize Fe(II) (). There is some overlap in the genera within these two functional groups. For example, Geobacter is typically considered an Fe(III)-reducing bacterium but is listed in the FAPROTAX database as a potential Fe(II) oxidizer due to a single report of Fe(II) oxidation coupled to nitrate reduction by Geobacter metallireducens (Hedrich, Schlomann, and Johnson Citation2011). The most abundant iron-cycling genus in Units 2 and 3 was Thiobacillus, species of which have been identified both as Fe(II) oxidizers and Fe(III) reducers (Kappler et al. 2005). Taxa with a, Fe(III) reduction potential account for 0.2 to 0.5 percent in Unit 1 material, 7 to 8 percent in Unit 2 material, and 5 to 7 percent in material from Unit 3. 16S rRNA gene sequences that are affiliated to taxa with an Fe(II) oxidizing potential account for 0.7 to 3 percent of the sequences in Unit 1, 7 to 10 percent in material from Unit 2, and 5 to 7 percent in Unit 3 material. In all units we found 16S rRNA sequences affiliated with representatives of acidophilic heterotrophic iron reducers of the genera Acidophilum (Coupland and Johnson Citation2008) and Acidocaldus (Johnson et al. Citation2006). The composition of the iron cycling community was distinctively different in Unit 1 compared to Units 2 and 3. The iron cycling community of Unit 1 was dominated by the genera Geobacter and Desulfosporosinus, whereas the iron cycling community of Units 2 and 3 was dominated by the genera Thiobacillus, Sideroxydans, and Rhodoferax.
Figure 7. Fractional abundance of potential Fe(III)-reducing bacterial genera identified using 16S rRNA gene sequencing.
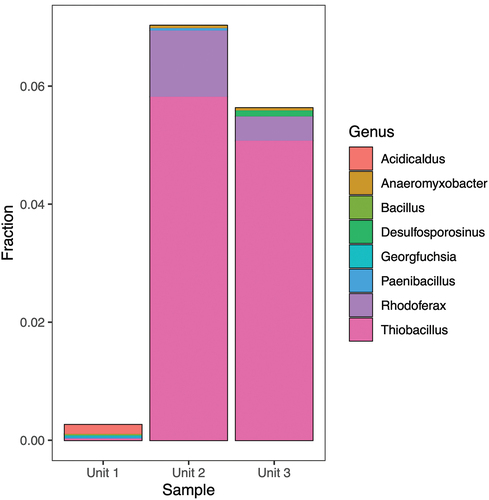
Figure 8. Fractional abundance of potential Fe(II)-oxidizing bacterial genera identified using 16S rRNA gene sequencing.
Discussion
Spatial variability at the sampling site
Active layer and permafrost sediments are characterized by subzero temperatures over prolonged periods, nutrient scarcity, lack of electron acceptors (which was not the case in our samples; see ), and slow decomposition rates (Ganzert et al. Citation2007; Vincent et al. Citation2009; Heikoop et al. Citation2015; Walz et al. Citation2017; Holm et al. Citation2020). In such environments, OM turnover rates are slow due to the interplay of various environmental parameters, including moisture, temperature, and oxygen availability, as well as soil forming factors such as parent material/origin and OM quality (Alves et al. Citation2013; Walz et al. Citation2017). These factors, however, vary significantly in both lateral and vertical directions (Newman et al. Citation2015), resulting in differences between the sedimentological units of the present study (). For example, we found that nutrient limitation increased with depth. The correlation between depth and nutrient concentration for permafrost environments, however, is rarely straightforward and depends heavily on factors such as cryoturbation and sediment type (Newman et al. Citation2015). Because the three units can all be traced back to different origins and age of deposition (Lønne Citation2005), this might explain most of the heterogeneity along the vertical gradient. Some parameters (such as pH) remained relatively uniform across all three units and within a similar range (Inglese et al. Citation2017) or slightly higher (Frank-Fahle et al. Citation2014) than those reported for arctic permafrost soils, whereas others varied considerably in an inconsistent pattern (such as the organic matter content). The high SO42− concentrations measured in our study (~0.5–6 mM in the slurries) are in line with previous reports for permafrost soils in Adventdalen (3.2 mM: Hansen et al. Citation2007) and consistent with SO42− concentrations of local river water (Yde et al. Citation2008; Rutter et al. Citation2011). The SO42− concentrations exhibited a vertical gradient (Herndon et al. Citation2015), consistent with sulfate-rich submarine permafrost sediments (Koch, Knoblauch, and Wagner Citation2009; Winkel et al. Citation2018). NO3− concentrations were extremely high in Units 1 and 2 compared to nitrate concentration reported in other permafrost studies (Giblin et al. Citation1991; Voigt et al. Citation2017; Fouché et al. Citation2020). Due to the very low water content of the sediments (see ), it is unlikely that nitrate was produced by nitrification at the sampling site. We assume that it was produced at an earlier stage when the sediments were deposited. A possible source is uric acid, which is highly concentrated in bird excrements and can be degraded by microorganism that are equally present in the excrements under the concomitant release of ammonium (e.g., Rouf and Lomprey Citation1968; Hafez, Abdel-Rahman, and Naguib Citation2017). Ammonium can then be converted into nitrate by nitrifiers. This process is plausible but would require oxygen and a sufficiently high water content. However, we cannot offer a mechanism that preserves nitrate and prevents it from biological (e.g., denitrification) or physical (washout) removal. Alternatively, the high nitrate concentrations could be the result of late-season NO3− enrichment in local river water if not restricted to the site and mobilized by rainfall events (Yde et al. Citation2008; Rutter et al. Citation2011).
As previously established, total extractable Fe closely follows the mineral content of sediments, where deeper and more mineral-rich permafrost facies exhibit the highest concentrations (Lipson et al. Citation2013). The chemical speciation of Fe is also likely driven by microbial processes that run along redox gradients: Fe(II) concentrations in permafrost sediments are greatest at depth, whereas Fe(III) is dominant in the “older” active layer of Unit 1 (e.g., Herndon et al. Citation2015). Furthermore, a strong trend of reduced Fe(II) availability with increasing sediment deposition age has been observed in arctic permafrost (Lipson et al. Citation2013). Both findings are supported by the results observed in the present study. Total extractable Fe increased with depth (Unit 3), but the percentage of Fe(III) was the highest in the uppermost, organic-rich unit and decreased with depth ().
Our data also suggest that each unit represents a distinct microbial habitat defined by its sedimentological history and reflected in its different microbial community composition (). Despite their very different origins, the microbial communities of Units 2 and 3 are much more similar than the community of Unit 1. This pattern also coincides with differences and similarities in pH and sulfate and iron content, whereas it is not reflected in the organic C and N content. This indicates that at the study sites it is neither the origin of the material nor the content of the organic matter and its composition that determine the structure of the microbial community. An important factor of consideration would also be the long-term effects of shifts in sediment state—for example, between active layer, transition zone, and permafrost—which could inevitably affect microbial activity and community composition and result from the gulley incision at the site since 1991. Similar artifacts are associated with active layer failure sites (e.g., Pautler et al. Citation2010).
Overall, our study adds to the growing evidence that permafrost environments are rich in microbial diversity (Chu et al. Citation2010; Wilhelm et al. Citation2011), comparable to that of temperate environments (Vishnivetskaya et al. Citation2014), and with community compositions that reflect their sedimentological history (Yergeau et al. Citation2010; Gittel et al. Citation2014; Holm et al. Citation2020). However, the abundance of 16S rRNA gene copy number observed in the three units was found to be lower (ten- to twentyfold for Bacteria; two- to fourfold for Archaea) than reported for arctic permafrost in previous studies (Wilhelm et al. Citation2011; Yergeau et al. Citation2010; Yang et al. Citation2017). Nonetheless, a consistent but unexplained correlation with depth was identified for both domains. Unit 1 exhibited the highest 16S rRNA gene copy number, with differences in the order of magnitude in comparison to the deeper units. This is in line with other studies (Yergeau et al. Citation2010; Frank-Fahle et al. Citation2014) that have reported differences as large as 100 to 1,000 times in 16S rRNA gene copy numbers between shallow and deeper units. The lower gene abundance and the trend observed can be attributed to both varying origin of the units, which influences sediment type and characteristics, and nutrient limitation at greater depths.
Microbial community composition
As reflected by 16S rRNA gene analysis, Bacteria showed a high degree of diversity, with over thirteen phyla represented. Our data therefore support the assertion that phyla such as Proteobacteria, Actinobacteria, and Acidobacteria are dominant in permafrost environments (Hansen et al. Citation2007; Wilhelm et al. Citation2011; Frank-Fahle et al. Citation2014; Koyama et al. Citation2014; Inglese et al. Citation2017). The most prominent shifts in community structure between units at the phyla level were observed for Proteobacteria, Actinobacteria, and Acidobacteria (). The increase in relative abundance of Proteobacteria in nutrient-depleted lower facies (Unit 2 and Unit 3) was unusual, given that previous studies report a correlation between C and N availability and the phylum’s abundance (Ganzert, Bajerski, and Wagner Citation2014). The high abundance of Acidobacteria in Unit 1 and its subsequent decline in deeper units can be attributed to the slightly more acidic conditions in Unit 1, considered preferential for the phylum (Ganzert, Bajerski, and Wagner Citation2014). At the class level, the most marked shift was the switch from Alphaproteobacteria prevalence in Unit 1 to Gammaproteobacteria in Unit 2 and Unit 3. However, because no significant differences were noted between Unit 2 and Unit 3 at both phylum and class levels, it can be speculated that the observed shifts are largely attributed to unit origin, rather than depth or nutrient availability. This underlines the heterogeneous nature of the sedimentary environment, which is also reflected in the significant differences in microbial activity across the three units.
Limited information exists regarding the abundance and distribution of microorganisms associated with Fe cycling in Arctic environments (Lipson et al. Citation2010; Emmerson et al. Citation2015; Nixon et al. Citation2017). At a finer taxonomical scale, genera known to contain strains associated with Fe reduction/oxidation were found in all units. These included genera reported to be responsible for a large fraction of the Fe reduction in previous studies such as Geobacter and Rhodoferax (Yde et al. Citation2010; Nixon et al. Citation2017). Genera typically associated with a different metabolism, but also potentially contributing to Fe reduction, were also detected, such as Desulfosporosinus (Nixon et al. Citation2017); Pelobacteraceae (Lonergan et al. Citation1996); Anaeromyxobacter, Paenibacillus (Petrie et al. Citation2003), Acidobacteria (Coupland and Johnson 2007), and Pelosinus (Shelobolina et al. Citation2007). The attribution of physiological traits based on 16S rRNA is also problematic when it comes to iron cycling because no clear link between phylogeny and iron metabolism (neither reduction nor oxidation) has yet been established (Kappler et al. Citation2021). The variation in abundance of Fe-reducing genera between treatments did not exhibit any significant trends, but their distribution varied by unit: Geobacter was only observed in Unit 1 (0.1–3 percent), Paenibacillus was found primarily in Unit 2 (0.18 percent), and Desulfosporosinus was found in Unit 3.
The remaining part of the Fe cycle in permafrost, namely, Fe oxidation, has received even less attention, and information is scarce. We detected 16S rRNA gene sequences related to members of the genus Gallionella, a genus associated with lithoautotrophic Fe oxidation (Emmerson et al. Citation2015), in Unit 2, albeit at low abundances (0.01–0.3 percent). 16S rRNA gene sequences related to members of the genus Thiobacillus, of which some are associated with acidic Fe oxidation (Skidmore et al. Citation2005), were also detected and exhibited strong variation by unit. The abundance of Thiobacillus was relatively high (4–7 percent) in both Units 2 and 3 across all treatments and markedly lower in Unit 1 (<0.2 percent).
Microbial activity inferred from slurry incubations
The general microbial activity monitored through production rates of Fe(II), CH4, and CO2 was highly unit specific and did not exhibit strong trends with depth. The unit specificity of the microbial processes in the present study might reflect unit origin rather than age. An important aspect is competition for substrates between dominant microbial groups. For example, anaerobic OM degradation in permafrost occurs mainly through the sequential use of electron acceptors such as NO3−, Fe(III), and SO42−, which is then followed by methanogenesis (Mackelprang et al. Citation2016). These processes are thermodynamically controlled and could either inhibit or retard one another due to competition for common substrates (Achtnich et al. Citation1995). Our findings reveal considerably higher rates of Fe(III) reduction in comparison to other tracked processes. However, the much less energetically favorable process of methanogenesis ran alongside Fe(III) reduction in all units, albeit at much lower rates. This might be explained by the unit-specific Fe biogeochemistry at the site. Minerals such as ferrihydrite serve as highly favorable terminal electron acceptors for Fe reduction, thus inhibiting methanogenesis (Herndon et al. Citation2015). Conversely, crystalline minerals (such as magnetite and hematite) are much less favorable for Fe reducers and may even stimulate methanogenesis by serving as a conduit for electron transfer (Rotaru et al. Citation2018). Fe found in soils, however, is often in the form of the less soluble crystalline forms than Fe(III) hydroxide, which may slow down or even prevent iron reduction depending on the type of Fe(III) phase (Stolz and Oremland Citation2011; Kappler et al. Citation2021). Other studies have observed a stimulation of Fe(III) reduction when Fe is in the form of a coating of amorphous Fe(III) oxyhydroxide on clay, but its availability is dependent on the particular sediment type (Lovley and Philips 1987).
Temperature and availability of organic matter are both crucial factors regulating microbial activity (Wagner et al. Citation2007; Mateos-Rivera et al. Citation2016). The expected outcome of the incubation experiments of samples exposed to either higher temperature (21°C) or addition of OM was to observe an increase in production rates of Fe(II), CH4, and CO2. We observed a significant but equally strong stimulation of Fe(II) production with increased temperature (21°C) and OM (4°C) amendment compared to the 4°C incubation only for Unit 1. These results are in contrast to reports by Meier et al. (Citation2005) and Weber et al. (Citation2010), who observed a temperature dependency of Fe(III) reduction. We were not able to decipher the mechanisms behind the observed Fe(II) production. We have expected that an increase in temperature or the addition of OM would stimulate biological Fe(III) reduction, which was not the case. We are not familiar with chemical or physical mechanisms that could explain our results. The average rates of Fe production recorded in this study (0.82–2.64 µmol Fe(II) g−1 dw d−1) are in the lower range of rates reported by others in microcosm experiments with permafrost and subglacial samples from elsewhere. The amount of Fe(II) produced across all treatments and samples in a day in this study equals that produced in an hour from subglacial sediments from Greenland (1.0–2.2 μM Fe(II) mL−1 h−1) and Antarctica (0.8–1.6 μM Fe(II) mL−1 h−1; Nixon et al. Citation2017). It is important to note, however, that both studies utilized enrichment incubations, whereas our samples were only activated by the addition of water.
When we assume that Fe(II) production is mainly driven by heterotrophic iron reduction and compare the amount of CO2 that was produced by iron reducers over the thirty days of incubation to the total amount of CO2 that was determined based on headspace CO2 measurements‚ 1.5 to 5 times more CO2 should have been produced than what we can account for in all samples incubated at 4°C as well as in samples from Units 1 and 2 incubated at 21oC. In the other samples, the ratio between the calculated amount of CO2 produced by iron reduction and the amount of the CO2 determined by direct measurements ranged between about 20 percent in the 4°C + OM incubations of Unit 2 and 90 percent in the 4°C + OM incubation of Unit 3 ().
Due to lack of experimental evidence, we can currently only speculate about what caused this discrepancy and could come up with four testable hypotheses: Firstly, there could be flaws in our experimental design that would lead to this outcome. Secondly, a significant fraction of the iron reduction could be driven by inorganic electron donors such as hydrogen or H2S, thus producing Fe(II) but no CO2. In addition, lithotrophic iron reducers could be autotrophic, thus further reducing the amount of CO2, in agreement with our observation. Thirdly, fermenters could use Fe(III) as an electron sink and thereby would get rid of surplus electrons at reduced CO2 release. Fourthly, CO2 could be partly removed by precipitation with Fe(II), leading to the formation of siderite (FeCO3). Concerning hypothesis 1: We cannot rule out flaws but would expect them to produce consistent overestimations of CO2 production coupled to iron reduction, which is not the case. Concerning hypothesis 2: This would agree with the observation that the amendment with OM shifts the ratio compared to the ratio in the unamended 4°C incubations. The most likely inorganic electron donor in our incubation would be hydrogen that would be released as the product of primary or secondary fermentations (e.g., Cabrol et al. Citation2017). Though hydrogen could play a role in our system, we do not expect it to account for an up to fivefold stimulation, as observed in some of our samples. Concerning hypothesis 3: Fermenters could use Fe(III) as an electron sink to achieve redox balance (e.g., List et al. Citation2019) and thereby produce Fe(II) without concomitant CO2 release. This is consistent with the observation that OM amendment shifts the ratio. Concerning hypothesis 4: Removal of CO2 by precipitation as siderite could also explain what we have observed in some of our slurries. Recently, Mortimer and Coleman (Citation1997) reported siderite formation in Geobacter metallireducens cultures that were grown in standard medium with acetate as the electron donor and FeOOH as the electron acceptor. Based on their observations, the authors suggested that microbial iron reduction may explain the formation of early diagenetic marine siderites, which was previously attributed to a combination of several abiotic process in the presence of meteoric water. A detailed analysis of the iron phase in our incubation is required to solve the puzzle. Nevertheless, siderite formation could be of great interest in iron-rich permafrost regions because it may buffer against extensive CO2 release because of permafrost melt and associated microbiological degradation of organic matter. Thus, iron cycling in permafrost regions may buffer against increasing CO2 release not only by stimulating primary productivity of adjacent aquatic (freshwater and marine) environments but also by chemically reducing CO2 emissions through precipitation of CO2 in the form of FeCO3. This could be an important and hitherto overlooked mechanism in iron-rich permafrost soils and therefore deserves more detailed investigation to obtain a more comprehensive understanding of the mechanisms that regulate CO2 emissions from melting permafrost.
Our findings partly agree with previous reports that warming increases the rate of soil organic matter decomposition, but the process is ultimately limited by substrate availability, rather than temperature (Hopkins et al. Citation2014), because we only observed a significant stimulation of Fe(II) production in Unit 1. Interestingly, in this unit we saw no difference in stimulation by increasing the temperature to 21°C or by adding OM and keeping the temperature at 4°C. Apparently, an increase in temperature stimulates processes that are involved in the degradation of more recalcitrant organic matter, whereas amendment of the microcosm with fresh organic matter stimulates Fe(III) reduction to the same extend as an increase in temperature. Though the mechanisms are different, the outcome is the same. The fact that we only saw a significant stimulation of Fe(II) production in Unit 1 clearly shows that permafrost soils are heterogeneous on a very small space scale and it is highly problematic to generalize results obtained on a small scale to a larger scale.
Because an increase in average temperature in permafrost regions to 21°C is not realistic in the foreseeable future, the availability of labile OM may have a greater impact than temperature on microbial uptake and catabolic capacity in permafrost sediments (Yang et al. Citation2017). The strong response of Fe(III) reduction to OM additions, however, is in contrast to what others have reported. Wild et al. (Citation2014) concluded that addition of organic carbon to N-limited soils had little effect on microbial activity in deeper permafrost facies. In contrast to Fe(II) production, we observed a significant stimulating effect of increasing temperature as well as OM amendment in all units. Interestingly, the greatest CO2 production rates were seen in Units 2 and 3. A temperature increase to 21°C generally stimulated CO2 production rates in all units; however, amendment with OM resulted in the greatest stimulation despite the lower temperature. Thus, the quality of the organic matter seems to be more important than the temperature.
The observed increase in CO2 (to which Fe(III) reduction also contributes) due to OM amendment and warming was in agreement with published studies (Hopkins et al. Citation2014; Walz et al. Citation2017). There was a strong response to warming in the organic-rich Unit 1 but the effect of OM on microbial activity was dominant in the organic-poor Unit 2 and Unit 3. Similar to the Fe(II) production rates, however, the rates of CO2 production (0.05–2.4 µmol g−1 dw d−1) were much lower than the rates observed from Alaskan peat soils (1.22 µmol CO2 g−1 h−1; Lipson et al. Citation2010), further emphasizing the vast differences in microbial responses in organic-rich versus organic-poor soils.
The impact of OM amendment on methanogenesis was therefore almost equal in magnitude to the observed increase due to elevated temperature. However, total CH4 produced in these facies remained relatively low across all treatments and samples after thirty days of incubation (115–343 nmol g−1 dw). Again, the observed daily rates of CH4 production in our study (0.81–7.37 nmol g−1 dw d−1) were almost equal to hourly production rates from organic-rich Siberian permafrost (0.5–12.5 nmol g−1 h−1; Ganzert et al. Citation2007) and so the site seems unlikely to support significant rates of methane emissions under the current conditions. A longer-term perspective on the future accumulation of OM in these sedimentary environments is therefore important. Methane production at rates measured in the different incubations were between about 130 and 1,050 times lower than the CO2 production rates, indicating that at the studied sites CO2 is the most prominent greenhouse gas, even though CH4 has a twenty-eight times higher warming potential in a 100-year time frame than CO2. As studies by Knoblauch et al. (Citation2018) and Holm et al. (Citation2020) have shown, the dominance by CO2 as the most important greenhouse gas may only be the case in short incubations lasting for a month or less. They and others (referenced in Knoblauch et al. Citation2018) could show that in incubations lasting for periods of one year or more this relation was inverted and methanogenesis dominated as a source of greenhouse gas over heterotrophic processes releasing CO2. This clearly shows that the length of the incubation time needs to be considered when it comes to the experimental design and the conclusions that can be drawn. Though short incubations may be useful to study the immediate response of the microbial population, long-term incubations provide a more realistic picture when it comes to long-term projections. Long-term incubations should, however, also account for seasonality to be realistic. In case of permafrost and in the active layer in particular, this means that the simulation of alternating periods of freezing and thawing should be included.
Summary and conclusions
The origin (diamicton, beach, or delta) and not depth determined the size of the microbial community and its composition, as well as the OM content, the C/N ratio, and the microbial activity.
Quality rather than quantity of organic matter appears to determine the level of activity independent of the process under investigation.
All three units hold a large reservoir of iron that can be mobilized to support primary production in adjacent aquatic ecosystems.
Fe(III) reduction is taking place in all units. The causes of the response (biological or chemical) of Fe(III) reduction to increasing temperature or amendment with fresh OM could not be identified.
In contrast to many other permafrost studies, in this study methanogenic Archaea were active immediately after incubation start. Methanogenesis took place in parallel to Fe(III) reduction in all units, indicating the presence of an easy-to-activate methanogenic community as well as the presence of appropriate and noncompetitive substrates.
The possible role of siderite formation as a sink for CO2 in iron-rich permafrost soils should be considered and investigated. This process may also influence the runoff of Fe and thereby influence the primary productivity of adjacent freshwater and/or marine regions.
Author contributions
The study was conceived by AH, JY, and KF. The experiments were carried out by IK. PN helped with the soil analysis. IM and AMR helped with the sequence analysis. The article was written by IK and KF with input from JY, AH, IM, EJ, and ENB.
Acknowledgments
We thank Anne Stentebjerg, Karina Bomholt Oest, Britta Poulsen, and Susanne Nielsen for their very competent assistance in the laboratory. We acknowledge the detailed and careful work of two reviewers. Their contribution is highly appreciated because it helped to improve the quality of our article significantly.
Disclosure statement
No potential conflict of interest was reported by the authors.
Additional information
Funding
References
- Achtnich, C., F. Bak, and R. Conrad. 1995. Competition for electron donors among nitrate reducers, ferric iron reducers, sulfate reducers, and methanogens in anoxic paddy soil. Biology and Fertility of Soils 19 (1):65–72. doi:10.1007/bf00336349.
- Alves, R. J. E., W. Wanek, A. Zappe, A. Richter, M. M. Svenning, C. Schleper, and T. Urich. 2013. Nitrification rates in Arctic soils are associated with functionally distinct populations of ammonia-oxidizing archaea. The ISME Journal 7:1620–31. doi:10.1038/ismej.2013.35.
- Bárcena, T. G., J. C. Yde, and K. W. Finster. 2010. Methane flux and high-affinity methanotrophic diversity along the chronosequence of a receding glacier in Greenland. Annals of Glaciology 51 (56):23–31. doi:10.3189/172756411795932001.
- Bárcena, T. G., K. W. Finster, and J. C. Yde. 2011. Spatial patterns of soil development, methane oxidation, and methanotrophic diversity along a receding glacier forefield, southeast Greenland. Arctic, Antarctic, and Alpine Research 43 (2):178–88. doi:10.1657/1938-4246-43.2.178.
- Bischoff, J., K. Mangelsdorf, A. Gattinger, M. Schloter, A. N. Kurchatova, U. Herzschuh, and D. Wagner. 2013. Response of methanogenic archaea to late Pleistocene and Holocene climate changes in the Siberian Arctic. Global Biogeochemical Cycles 27 (2):305–17. doi:10.1029/2011gb004238.
- Boike, J. 2009. SPARC and disappearing permafrost—A story from Bayelva in Svalbard. Svalbard 25 Science Forum.
- Braunschweig, J., J. Bosch, K. Heister, C. Kuebeck, and R. U. Meckenstock. 2012. Reevaluation of colorimetric iron determination methods commonly used in geomicrobiology. Journal of Microbiological Methods 89 (1):41–48. doi:10.1016/j.mimet.2012.01.021.
- Cabrol, L., A. Marone, E. Tapia-Venegas, J.-P. Steyer, G. Ruiz-Filippi, and E. Trably. 2017. Microbial ecology of fermentative hydrogen producing bioprocesses: Useful insights for driving the ecosystem function. FEMS Microbiology Reviews 41:158–81. doi:10.1093/femsre/fuw043.
- Callahan, B. J., P. J. McMurdie, M. J. Rosen, A. W. Han, A. J. A. Johnson, and S. P. Holmes. 2016. DADA2: High-resolution sample inference from Illumina amplicon data. Nature Methods 13:581–83. doi:10.1038/nmeth.3869.
- Christiansen, H. H., B. Etzelmüller, K. Isaksen, H. Juliussen, H. Farbrot, O. Humlum, M. Johansson, T. Ingeman-Nielsen, L. Kristensen, and J. Hjort. 2010. The thermal state of permafrost in the Nordic area during the International Polar Year 2007–2009. Permafrost and Periglacial Processes 21 (2):156–81. doi:10.1002/ppp.687.
- Chu, H., N. Fierer, C. L. Lauber, J. Caporaso, R. Knight, and P. Grogan. 2010. Soil bacterial diversity in the Arctic is not fundamentally different from that found in other biomes. Environmental Microbiology 12:2998–3006. doi:10.1111/j.1462-2920.2010.02277.x.
- Coupland, K., and D. B. Johnson. 2008. Evidence that the potential for dissimilatory ferric iron reduction is widespread among acidophilic heterotrophic bacteria. FEMS Microbiology Letters 279:30–35. doi:10.1111/j.1574-6968.2007.00998.x.
- Elberling, B., A. Michelsen, C. Schädel, E. A. G. Schuur, H. H. Christiansen, L. Berg, M. P. Tamstorf, and C. Sigsgaard. 2013. Long-term CO2 production following permafrost thaw. Nature Climate Change 3 (10):890–94. doi:10.1038/nclimate1955.
- Emmerson, D., J. J. Scott, J. Benes, W. B. Bowden, and F. E. Löffler. 2015. Microbial iron oxidation in the Arctic tundra and its implications for biogeochemical cycling. Applied and Environmental Microbiology 81 (23):8066–75. doi:10.1128/AEM.02832-15.
- Førland, E. J., R. Benestad, I. Hanssen-Bauer, J. E. Haugen, and T. E. Skaugen. 2011. Temperature and precipitation development at Svalbard 1900–2100. Advances in Meteorology 2011:893790. doi:10.1155/2011/893790.
- Fouché, J., C. T. Christiansen, M. J. Lafrenière, P. Grogan, and S. F. Lamoureux. 2020. Canadian permafrost stores large pools of ammonium and optically distinct dissolved organic matter. Nature Communications 11:4500. doi:10.1038/s41467-020-18331-w.
- Frank-Fahle, B. A., É. Yergeau, C. W. Greer, H. Lantuit, D. Wagner, and J. H. Badger. 2014. Microbial functional potential and community composition in permafrost-affected soils of the NW Canadian Arctic. PLoS One 9 (1):e84761. doi:10.1371/journal.pone.0084761.
- Frey, K. E., and J. W. McClelland. 2009. Impacts of permafrost degradation on Arctic river biogeochemistry. Hydrological Processes 23 (1):169–82. doi:10.1002/hyp.7196.
- Ganzert, L., G. Jurgens, U. Münster, and D. Wagner. 2007. Methanogenic communities in permafrost-affected soils of the Laptev Sea coast, Siberian Arctic, characterized by 16S rRNA gene fingerprints. FEMS Microbiology Ecology 59:476–88. doi:10.1111/j.1574-6941.2006.00205.x.
- Ganzert, L., F. Bajerski, and D. Wagner. 2014. Bacterial community composition and diversity of five different permafrost-affected soils of Northeast Greenland. FEMS Microbiology Ecology 89 (2):426–41. doi:10.1111/1574-6941.12352.
- Giblin, A. E., K. J. Nadelhoffer, G. R. Shaver, J. A. Laundre, and A. J. McKerrow. 1991. Biogeochemical diversity along a riverside toposequence in Arctic Alaska. Ecological Monographs 61 (4):415–35. doi:10.2307/2937049.
- Gilbert, G. L., H. B. O’Neill, W. Nemec, C. Thiel, H. H. Christiansen, and J. P. Buylaert 2018. Late Quaternary sedimentation and permafrost development in a Svalbard fjord‐valley, Norwegian high Arctic. Sedimentology 65 (7):2531–58. doi:10.1111/sed.12476.
- Gittel, A., J. Bárta, I. Kohoutova, J. Schnecker, B. Wild, P. Čapek, C. Kaiser, et al. 2014. Site- and horizon-specific patterns of microbial community structure and enzyme activities in permafrost-affected soils of Greenland. Frontiers in Microbiology 5:541. doi:10.3389/fmicb.2014.00541.
- Groenendyk, D. G., T. P. A. Ferré, K. R. Thorp, and A. K. Rice. 2015. Hydrologic-process-based soil texture classifications for improved visualization of landscape function. PLoS ONE 10 (6):e0131299. doi:10.1371/journal.pone.0131299.
- Hafez, R. M., T. M. Abdel-Rahman, and R. M. Naguib. 2017. Uric acid in plants and microorganisms: Biological applications and genetics – A review. Journal of Advanced Research 8:475–86. doi:10.1016/j.jare.2017.05.003.
- Hansen, A. A., R. A. Herbert, K. Mikkelsen, L. L. Jensen, T. Kristoffersen, J. M. Tiedje, B. A. Lomstein, and K. W. Finster. 2007. Viability, diversity and composition of the bacterial community in a high Arctic permafrost soil from Spitsbergen, northern Norway. Environmental Microbiology 9 (1):2870–84. doi:10.1111/j.1462-2920.2007.01403.x.
- Hedrich, S., M. Schlomann, and D. B. Johnson. 2011. The iron-oxidizing proteobacteria. Microbiology 157:1551–64. doi:10.1099/mic.0.045344-0.
- Heikoop, J. M., H. M. Throckmorton, B. D. Newman, G. B. Perkins, C. M. Iversen, T. R. Chowdhury, and V. Romanovsky, et al. 2015. Isotopic identification of soil and permafrost nitrate sources in an Arctic tundra ecosystem. Journal of Geophysical Research: Biogeosciences 120:1000–17. doi:10.1002/2014JG002883.
- Herndon, E. M., Z. Yang, J. Bargar, N. Janot, T. Z. Regier, D. E. Graham, S. D. Wullschleger, B. Gu, and L. Liang. 2015. Geochemical drivers of organic matter decomposition in Arctic tundra soils. Biogeochemistry 126 (3):397–414. doi:10.1007/s10533-015-0165-5.
- Hessen, D. O., J. Carroll, B. Kjeldstad, A. A. Koroso, L. H. Pettersson, D. Pozdnyakov, and K. Sørensen. 2010. Input of organic carbon as determinant of nutrient fluxes, light climate and productivity in the Ob and Yenisey estuaries. Estuarine, Coastal and Shelf Science 88 (1):53–62. doi:10.1016/j.ecss.2010.03.006.
- Hodson, A., P. Mumford, and D. Lister. 2004. Suspended sediment and phosphorus in proglacial rivers: Bioavailability and potential impacts upon the P status of ice-marginal receiving waters. Hydrological Processes 18 (13):2409–22. doi:10.1002/hyp.1471.
- Hodson, A., A. Nowak, and H. Christiansen. 2015. Glacial and periglacial floodplain sediments regulate hydrologic transfer of reactive iron to a high Arctic fjord. Hydrological Processes 30 (8):1219–29. doi:10.1002/hyp.10701.
- Holm, S., J. Walz, F. Horn, S. Yang, M. N. Grigoriev, D. Wagner, C. Knoblauch, and S. Liebner. 2020. Methanogenic response to long-term permafrost thaw is determined by paleoenvironment. FEMS Microbiology Ecology 96 (3):fiaa021. doi:10.1093/femsec/fiaa021.
- Hopkins, F. M., T. R. Filley, G. Gleixner, M. Lange, S. M. Top, and S. E. Trumbore. 2014. Increased belowground carbon inputs and warming promote loss of soil organic carbon through complementary microbial responses. Soil Biology and Biochemistry 76:57–69. doi:10.1016/j.soilbio.2014.04.028.
- Humlum, O., A. Instanes, and J. L. Sollid. 2003. Permafrost in Svalbard: A review of research history, climatic background and engineering challenges. Polar Research 22 (2):191–215. doi:10.3402/polar.v22i2.6455.
- Inglese, C. N., C. T. Christiansen, D. Lamhonwah, K. Moniz, S. N. Montross, and S. Lamoureux. 2017. Examination of soil microbial communities after permafrost thaw subsequent to an active layer detachment in the High Arctic. Arctic, Antarctic, and Alpine Research 49 (3):455–72. doi:10.1657/AAAR0016-066.
- Johnson, D. B., B. Stallwood, S. Kimura, and K. B. Hallberg. 2006. Isolation and characterization of Acidicaldus organivorus, gen. nov., sp. nov.: A novel sulfur-oxidizing, ferric iron-reducing thermo-acidophilic heterotrophic Proteobacterium. Archives of Microbiology 185 (3):212–21. doi:10.1007/s00203-006-0087-7.
- Kappler, A. 2005. Geomicrobiological cycling of iron. Reviews in Mineralogy and Geochemistry 59 (1):85–108. doi:10.2138/rmg.2005.59.5.
- Kappler, A., C. Bryce, M. Mansor, U. Luede, J. M. Byrne, and E. D. Swanner. 2021. An evolving view on biogeochemical cycling of iron. Nature Reviews Microbiology 19 (6):360–74. doi:10.1038/s41579-020-00502-7.
- Keller, K., J. D. Blum, and G. W. Kling. 2007. Geochemistry of soils and streams on surfaces of varying ages in Arctic Alaska. Arctic, Antarctic, and Alpine Research 39 (1):84–98. doi:10.1657/1523-0430(2007)39[84:GOSASO]2.0.CO;2.
- Keller, K., J. D. Blum, and G. W. Kling. 2010. Stream geochemistry as an indicator of increasing permafrost thaw depth in an Arctic watershed. Chemical Geology 273:76–81. doi:10.1016/j.chemgeo.2010.02.013.
- Khvorostyanov, D. V., P. Ciais, G. Krinner, and S. A. Zimov. 2008. Vulnerability of east Siberia’s frozen carbon stores to future warming. Geophysical Research Letters 35:L10703. doi:10.1029/2008GL033639.
- Klindworth, A., E. Pruesse, T. Schweer, J. Peplies, C. Quast, H. Horn, and F. O. Glöckner. 2013. Evaluation of general 16S ribosomal RNA gene PCR primers for classical and next-generation sequencing-based diversity studies. Nucleic Acids Research 41:1, e1. doi:10.1093/nar/gks808.
- Knoblauch, C., C. Beer, S. Liebner, M. N. Grigoriev, and E.-M. Pfeiffer. 2018. Methane production as key to the greenhouse gas budget of thawing permafrost. Nature Climate Change 8:309–12. doi:10.1038/s41558-018-0095-z.
- Koch, K., C. Knoblauch, and D. Wagner. 2009. Methanogenic community composition and anaerobic carbon turnover in submarine permafrost sediments of the Siberian Laptev Sea. Environmental Microbiology 11 (3):657–68. doi:10.1111/j.1462-2920.2008.01836.x.
- Koyama, A., M. D. Wallenstein, R. T. Simpson, and J. C. Moore. 2014. Soil bacterial community composition altered by increased nutrient availability in Arctic tundra soils. Frontiers in Microbiology 5:516. doi:10.3389/fmicb.2014.00516.
- Lenth, R. V. 2021. Emmeans: Estimated marginal means, aka least-squares means. R package version 1.5.5-1. https://CRAN.R-project.org/package=emmeans
- Liestøl, O. 1977. Pingos, springs, and permafrost in Spitsbergen. Norsk Polarinstitutt, Årbok 1975:7–29.
- Lipson, D. A., M. Jha, T. K. Raab, and W. C. Oechel. 2010. Reduction of iron (III) and humic substances plays a major role in anaerobic respiration in an Arctic peat soil. Journal of Geophysical Research 115:G4. doi:10.1029/2009jg001147.
- Lipson, D. A., T. K. Raab, D. Goria, and J. Zlamal. 2013. The contribution of Fe(III) and humic acid reduction to ecosystem respiration in drained thaw lake basins of the Arctic Coastal Plain. Global Biogeochemical Cycles 27:1–11. doi:10.1002/gbc.20038.
- List, C., Z. Hosseini, K. Lederballe Meibom, V. Hatzimanikatis, and R. Bernier-Latmani. 2019. Impact of iron reduction on the metabolism of Clostridium acetobutylicum. Environmental Microbiology 21:3548–63. doi:10.1111/1462-2920.14640.
- Lonergan, D. J., H. L. Jenter, J. D. Coates, E. J. P. Phillips, T. M. Schmidt, and D. R. Lovley. 1996. Phylogenetic analysis of dissimilatory Fe(III)-reducing bacteria. Journal of Bacteriology 178 (8):2402–08. doi:10.1128/jb.178.8.2402-2408.1996.
- Lønne, I. 2005. Faint traces of high Arctic glaciations: An early Holocene ice-front fluctuation in Bolterdalen, Svalbard. Boreas 34 (3):308–23. doi:10.1111/j.1502-3885.2005.tb01103.x.
- Louca, S., L. W. Parfrey, and M. Doebeli. 2016. Decoupling function and taxonomy in the global ocean microbiome. Science 353:1272–77. doi:10.1126/science.aaf4507.
- Lovley, D. R., and E. J. P. Phillips. 1987. Competitive mechanisms for inhibition of sulfate reduction and methane production in the zone of ferric iron reduction in sediments. Applied and Environmental Microbiology 53 (11):2636–41. doi:10.1128/aem.53.11.2636-2641.1987.
- Loyaux-Lawniczak, S., S. Vuilleumier, and V. A. Geoffroy. 2019. Efficient reduction of iron oxides by paenibacillus spp. strains isolated from tropical soils. Geomicrobiology Journal 36:423–32. doi:10.1080/01490451.2019.1566415.
- Mackelprang, R., S. R. Saleska, C. S. Jacobsen, J. K. Jansson, and N. Tas. 2016. Permafrost meta-omics and climate change. Annual Review of Earth and Planetary Sciences 44:439–62. doi:10.1146/annurev-earth-060614-105126.
- Martin, M. 2011. Cutadapt removes adapter sequences from high-throughput sequencing reads. EMBnet.journal 17 (1):10–12. http://journal.embnet.org/index.php/embnetjournal/article/view/200/458.
- Mateos-Rivera, A., J. C. Yde, B. Wilson, K. W. Finster, L. J. Reigstad, L. Øvreås, and R. Margesin. 2016. The effect of temperature change on the microbial diversity and community structure along the chronosequence of the sub-Arctic glacier forefield of Styggedalsbreen (Norway). FEMS Microbiology Ecology 92 (4):fiw038. doi:10.1093/femsec/fiw038.
- McMurdie, P. J., and S. Holmes. 2013. phyloseq: An R package for reproducible interactive analysis and graphics of microbiome census data. PLoS One 8:e61217. doi:10.1371/journal.pone.0061217.
- Meier, J., R. Costa, K. Smalla, B. Boehrer, and K. Wendt-Potthoff. 2005. Temperature dependence of Fe(III) and sulfate reduction rates and its effect on growth and composition of bacterial enrichments from an acidic pit lake neutralization experiment. Geobiology 3 (4):261–74. doi:10.1111/j.1472-4669.2006.00065.x.
- Mortimer, R. J. G., and M. L. Coleman. 1997. Microbial influence on the oxygen isotopic composition of diagenetic siderite. Geochimica et Cosmochimica Acta 61:1705–11. doi:10.1016/S0016-7037(97)00027-6.
- Newman, B. D., H. M. Throckmorton, D. E. Graham, B. Gu, S. S. Hubbard, and L. Liang, Y. Wu, et al. 2015. Microtopographic and depth controls on active layer chemistry in Arctic polygonal ground. Geophysical Research Letters 42:1808–17. doi:10.1002/2014GL062804.
- Nielsen, M. B., K. U. Kjeldsen, M. A. Lever, and K. Ingvorsen. 2014. Survival of prokaryotes in a polluted waste dump during remediation by alkaline hydrolysis. Ecotoxicology 23:404–18. doi:10.1007/s10646-014-1205-y.
- Nixon, S. L., P. J. Telling, J. L. Wadham, and C. S. Cockell. 2017. Viable cold- tolerant iron-reducing microorganisms in geographically diverse subglacial environments. Biogeosciences 14:1445–55. doi:10.5194/bg-14-1445-2017.
- Nørnberg, P., and K. Dalsgaard. 2009. Compendium to soil and water analyses. Aarhus: University of Aarhus.
- Pautler, B. G., A. J. Simpson, D. J. Mcnally, S. F. Lamoureux, and M. J. Simpson. 2010. Arctic permafrost active layer detachments stimulate microbial activity and degradation of soil organic matter. Environmental Science & Technology 44:4076–82. doi:10.1021/es903685j.
- Petrie, L., N. N. North, S. L. Dollhopf, D. L. Balkwill, and J. E. Kostka. 2003. Enumeration and characterization of iron(III)-reducing microbial communities from acidic subsurface sediments contaminated with uranium(VI). Applied and Environmental Microbiology 69 (12):7467–79. doi:10.1128/AEM.69.12.7467-7479.2003.
- Ping, C. L., J. D. Jastrow, M. T. Jorgenson, G. J. Michaelson, and Y. L. Shur. 2015. Permafrost soils and carbon cycling. Soil 1:147–71. doi:10.5194/soil-1-147-2015.
- Quast, C., E. Pruesse, P. Yilmaz, J. Gerken, T. Schweer, P. Yarza, J. Peplies, and F. O. Glöckner. 2013. The SILVA ribosomal RNA gene database project: Improved data processing and web-based tools. Nucleic Acids Research 41:D590–6. doi:10.1093/nar/gks1219.
- R Core Team. 2021. R: A language and environment for statistical computing. Vienna, Austria: R Foundation for Statistical Computing. https://www.R-project.org/.
- Reyes, F. R., and V. L. Lougheed. 2015. Rapid nutrient release from permafrost thaw in Arctic aquatic ecosystems. Arctic, Antarctic, and Alpine Research 47 (1):35–48. doi:10.1657/AAAR0013-099.
- Rotaru, A.-E., F. Calabrese, H. Stryhanyuk, F. Musat, P. M. Shrestha, H. S. Weber, O. L. O. Snoeyenbos-West, P. O. J. Hal, H. H. Richnow, and N. Musat, et al. 2018. Conductive particles enablesyntrophic acetate oxidation between Geobacter and Methanosarcina from coastal sediments. mBio 9:e00226–18. doi:10.1128/mBio.00226-18.
- Rouf, M. A., and R. F. Lomprey Jr. 1968. Degradation of uric acid by certain aerobic bacteria. Journal of Bacteriology 96:617–22. doi:10.1128/JB.96.3.617-622.1968.
- Rutter, N., A. Hodson, T. Irvine-Fynn, and M. K. Solås. 2011. Hydrology and hydrochemistry of a deglaciating high-Arctic catchment, Svalbard. Journal of Hydrology 410 (1–2):39–50. doi:10.1016/j.jhydrol.2011.09.001.
- Schostag, M., M. Stibal, C. S. Jacobsen, J. Bælum, N. Taş, and B. Elberling. 2015. Distinct summer and winter bacterial communities in the active layer of Svalbard permafrost revealed by DNA- and RNA-based analyses. Frontiers in Microbiology: 6. doi:10.3389/fmicb.2015.00399.
- Schuur, E. A. G., J. Bockheim, J. G. Canadell, E. Euskirchen, C. B. Field, S. V. Goryachkin, S. Hagemann, P. Kuhry, P. M. Lafleur, and H. Lee. 2008. Vulnerability of Permafrost carbon to climate change: Implications for the global carbon cycle. BioScience 58 (8):701. doi:10.1641/b580807.
- Schuur, E. A. G., A. McGuire, C. Schädel, G. Grosse, J. W. Harden, D. J. Hayes, G. Hugelius, C. D. Koven, P. Kuhry, and D. M. Lawrence. 2015. Climate change and the permafrost carbon feedback. Nature 520:171–79. doi:10.1038/nature14338.
- Shelobolina, E. S., K. P. Nevin, J. D. Blakeney-Hayward, C. V. Johnsen, T. W. Plaia, P. Krader, T. Woodard, et al. 2007. Geobacter pickeringii sp. nov., Geobacter argillaceus sp. nov. and Pelosinus fermentans gen. nov., sp. nov., isolated from subsurface kaolin lenses. International Journal of Systematic and Evolutionary Microbiology 57 (1):126–35. doi:10.1099/ijs.0.64221-0.
- Skidmore, M., S. P. Anderson, M. Sharp, J. Foght, and B. D. Lanoil. 2005. Comparison of microbial community compositions of two subglacial environments reveals a possible role for microbes in chemical weathering processes. Applied and Environmental Microbiology 71 (11):6986–97. doi:10.1128/AEM.71.11.6986–6997.2005.
- Solomon, S., D. Qin, M. Manning, M. Marquis, K. Averyt, and M. Tignor, 2007: Climate change 2007: The physical science basis. Contribution of working group I to the fourth assessment report of the intergovernmental panel on climate change. Cambridge: Cambridge University Press.
- Starnawski, P., T. Bataillon, T. J. G. Ettema, L. M. Jochum, L. Schreiber, X. Chen, M. A. Lever, et al. 2017. Microbial community assembly and evolution in subseafloor sediment. Proceedings of the National Academy of Sciences 114 (11):2940–45. doi:10.1073/pnas.1614190114.
- Stolz, J. F., and R. S. Oremland. 2011. Microbial metal and metalloid metabolism: Advances and applications. Washington, DC: American Society for Microbiology.
- Streletskiy, D. A., A. B. Sherstiukov, O. W. Frauenfeld, and F. E. Nelson. 2015. Changes in the 1963–2013 shallow ground thermal regime in Russian permafrost regions. Environmental Research Letters 10. doi:10.1088/1748-9326/10/12/125005.
- Tarnocai, C., J. G. Canadell, E. A. G. Schuur, P. Kuhry, G. Mazhitova, and S. Zimov. 2009. Soil organic carbon pools in the northern circumpolar permafrost region. Global Biogeochemical Cycles 23:2. doi:10.1029/2008gb003327.
- Tveit, A., R. Schwacke, M. M. Svenning, and T. Urich. 2013. Organic carbon transformations in high-Arctic peat soils: Key functions and microorganisms. The ISME Journal 7 (2):299–311. doi:10.1038/ismej.2012.99.
- Vincent, W. F., L. G. Whyte, C. Lovejoy, C. W. Greer, I. Laurion, C. A. Suttle, J. Corbeil, and D. R. Mueller. 2009. Arctic microbial ecosystems and impacts of extreme warming during the International Polar Year. Polar Science 3:171–80. doi:10.1016/j.polar.2009.05.004.
- Vishnivetskaya, T. A., A. C. Layton, M. C. Y. Lau, A. Chauhan, K. R. Cheng, and A. J. Meyers. 2014. Commercial DNA extraction kits impact observed microbial community composition in permafrost samples. FEMS Microbiology Ecology 84:217–30. doi:10.1111/1574-6941.12219.
- Voigt, C., M. E. Marushchak, R. E. Lamprecht, M. Jakowicz- Korczynski, A. Lindgren, M. Mastepanov, L. Granlund, T. R. Christensen, T. Tahvanainen, P. J. Martikainen, and C. Baisi. 2017. Increased nitrous oxide emissions from Arctic peatlands after permafrost thaw. Proceedings of the National Academy of Sciences 114 (24):6238–43. doi:10.1073/pnas.1702902114.
- Wagner, D., A. Gattinger, A. Embacher, E.-M. Pfeiffer, M. Schloter, and A. Lipski. 2007. Methanogenic activity and biomass in Holocene permafrost deposits of the Lena Delta, Siberian Arctic and its implication for the global methane budget. Global Change Biology 13 (5):1089–99. doi:10.1111/j.1365-2486.2007.01331.x.
- Waldrop, M. P., K. P. Wickland, R. White III, A. A. Berhe, J. W. Harden, and V. E. Romanovsky. 2010. Molecular investigations into a globally important carbon pool: Permafrost-protected carbon in Alaskan soils. Global Change Biology 16 (9):2543–54. doi:10.1111/j.1365-2486.2009.02141.x.
- Walter, K. M., S. A. Zimov, J. P. Chanton, D. Verbyla, and F. S. Chapin III. 2006. Methane bubbling from Siberian thaw lakes as a positive feedback to climate warming. Nature 443:71–75. doi:10.1038/nature05040.
- Walz, J., C. Knoblauch, L. Böhmne, and E.-M. Pfeiffer. 2017. Regulation of soil organic matter decomposition in permafrost-affected Siberian tundra soils - Impact of oxygen availability, freezing and thawing, temperature, and labile organic matter. Soil Biology and Biochemistry 110:34–43. doi:10.1016/j.soilbio.2017.03.001.
- Weber, F.-A., A. F. Hofacker, A. Voegelin, and R. Kretzschmar. 2010. Temperature dependence and coupling of iron and arsenic reduction and release during flooding of a contaminated soil. Environmental Science & Technology 44 (1):116–22. doi:10.1021/es902100h.
- Whaley, D., M. Leinen, and K. Whilden. 2009. Ocean iron fertilization: Recent results, estimates of potential, and economic considerations. IOP Conference Series: Earth and Environmental Science 6 (16):162011. doi:10.1088/1755-1307/6/6/162011.
- Wild, B., J. Schnecker, R. J. E. Alves, P. Barsukov, J. Bárta, P. Čapek, and N. Gentsch, et al. 2014. Input of easily available organic C and N stimulates microbial decomposition of soil organic matter in Arctic permafrost soil. Soil Biology and Biochemistry 75:143–51. doi:10.1016/j.soilbio.2014.04.014.
- Wilhelm, R. C., T. D. Niederberger, C. Greer, and L. G. Whyte. 2011. Microbial diversity of active layer and permafrost in an acidic wetland from the Canadian High Arctic. Canadian Journal of Microbiology 57 (4):303–15. doi:10.1139/W11-004.
- Winkel, M., J. Mitzcherling, P. P. Overduin, F. Horn, M. Winterfeld, R. Rijkers, M. N. Grigoriev, C. Knoblauch, K. Mangelsdorf, D. Wagner, and S. Liebner. 2018. Anaerobic methanotrophic communities thrive in deep submarine permafrost. Scientific Reports 8:1291. doi:10.1038/s41598-018-19505-9.
- Yang, Z., S. Yang, J. D. Van Nostrand, J. Zhou, W. Fang, Q. Qi, and Y. Liu et al. 2017. Microbial community and functional gene changes in Arctic tundra soils in a microcosm warming experiment. Frontiers in Microbiology 8:1741. doi:10.3389/fmicb.2017.01741.
- Yde, J. C., M. Riger-Kusk, H. H. Christensen, N. T. Knudsen, and O. Humlum. 2008. Hydrochemical characteristics of bulk meltwater from an entire ablation season, Longyearbreen, Svalbard. Journal of Glaciology 54 (185):259–72. doi:10.3189/002214308784886234.
- Yde, J. C., K. W. Finster, R. Raiswell, J. P. Steffensen, J. Heinemeier, and J. Olsen. 2010. Basal ice microbiology at the margin of the Greenland ice sheet. Annals of Glaciology 51:71–79. doi:10.3189/172756411795931976.
- Yergeau, E., H. Hogues, L. G. Whyte, and C. W. Greer. 2010. The functional potential of high Arctic permafrost revealed by metagenomic sequencing, qPCR and microarray analyses. The ISME Journal 4:1206–14. doi:10.1038/ismej.2010.4.