
ABSTRACT
The snowbed habitats represent a relevant component of the alpine tundra biome, developing in areas characterized by a long-lasting snow cover. Such areas are particularly sensitive to climate changes, because small variations in air temperature, rain, and snowfall may considerably affect the pedoclimate and plant phenology, which control the soil C and N cycling. Therefore, it is fundamental to identify the most sensitive abiotic and biotic variables affecting soil nutrient cycling. This work was performed at seven permanent snowbed sites belonging to Salicetum herbaceae vegetation community in the northwestern Italian Alps, at elevations between 2,686 and 2,840 m.a.s.l. During a four-year study, we investigated climate, pedoclimate, floristic composition, phenology, and soil C and N dynamics. We found that lower soil water content and earlier melt-out day decreased soil N-NH4+, N-NO3−, dissolved organic carbon (DOC), dissolved organic nitrogen (DON), total dissolved nitrogen (TDN), microbial nitrogen (Nmicr), microbial carbon (Cmicr), and C:Nmicr ratio. The progression of the phenological stages of Salix herbacea reduced soil N-NH4+ and increased DOC. Our results showed that the snow melt-out day, soil temperature, soil water content, and plant phenological stages were the most important factors affecting soil biogeochemical cycles, and they should be taken into account when assessing the effects of climate change in alpine tundra ecosystems, in the framework of long-term ecological research.
Introduction
The presence of a substantial and long-lasting snow cover holds a prominent relevance for the ecology of a large part of the Earth’s biomes, especially at high latitude and in mountain regions; in particular, 63 percent of the land masses in the Northern Hemisphere are at least temporarily covered by snow (Hammond, Saavadra, and Kampf Citation2018). In fact, the seasonal snowpack depth, duration, and melt-out control the onset and duration of the growing season in cold regions (e.g., Cooper, Dullinger, and Semenchuk Citation2011; Freppaz et al. Citation2018), mitigate negative soil temperature, and affect microbial activity (e.g., Mikan, Schimel, and Doyle Citation2002; Freppaz et al. Citation2018). In addition, it affects soil nutrient cycling (e.g., Hiltbrunner, Schwikowski, and Körner Citation2005; Filippa et al. Citation2010), soil gas fluxes (e.g., Filippa et al. Citation2009; P. D. Brooks et al. Citation2011), pedogenesis (e.g., Holtmeier and Broll Citation1992), and other soil properties (e.g., Hiller et al. Citation2005; Pintaldi et al. Citation2016; Freppaz et al. Citation2018), along with plant composition (Carbognani, Tomaselli, and Petraglia Citation2014).
Snowbed plant communities represent a relevant component of the alpine tundra biome (Björk and Molau Citation2007), developing in small areas where winter snow accumulates with great thickness, mainly due to topographical factors and wind redistribution (e.g., Gjaerevoll Citation1956; Billings and Bliss Citation1959; Johnson and Billings Citation1962). Snowbeds have a dense vegetation cover, and one of the most relevant species is the dwarf shrub Salix herbacea L. (Quaglia et al. Citation2020), which, despite the small size of the aerial parts, can develop an impressive and extremely ramified root system, showing also pronounced longevity (Wijk Citation1986). These habitats, located above the treeline, are characterized by specific environmental properties, such as a limited growing season, extended periods with air temperatures below freezing, and prolonged snow-covered soils (Edwards, Scalenghe, and Freppaz Citation2007; Knowles, Blanken, and Williams Citation2015). Thus, snow represents a key ecological factor in mountains due to its capability to shape the spatial patterns of soil properties and alpine vegetation (Braun-Blanquet Citation1932; Gjaerevoll Citation1956; Bliss Citation1963; Scott and Billings Citation1964; Freppaz et al. Citation2018). However, the predicted increase in temperature (IPCC Citation2021) makes seasonally snow-covered regions, such as the Alps, particularly sensitive to climate change (Cebon et al. Citation1998; Beniston Citation2006), because small changes in air temperature and/or precipitation may result in large modifications of the pedoclimate and plant phenology, with potential effects on soil C and N cycling. In particular, global warming might introduce a number of different effects on the seasonal snow cover; for instance, increasing air temperatures can result in a higher percentage of rain falling instead of snow, causing a thinner and shorter-lasting snow cover, a phenomenon already visible in many mountain ranges (e.g., Serquet, Marty, and Rebetez Citation2013; Notarnicola Citation2020). As remarked by Hock et al. (Citation2019), higher spring and summer temperatures lead to earlier melt-out dates and longer growing seasons for vegetation. Snowmelt timing is known to influence soil water availability during the summer months (Wilson et al. Citation2020). A warmer climate will likely deplete soil moisture in the summer by increasing evapotranspiration but also indirectly by advancing the timing of seasonal snowmelt (Blankinship et al. Citation2014). Snowpack changes can thus have cascading effects through ecosystems due to their influence on soil temperatures and water availability (Wilson et al. Citation2020).
Variations in the thickness and duration of snow cover result in remarkable differences not only in pedoclimatic conditions and nutrient cycling but also in the composition (D. A. Walker et al. Citation1993; Fisk, Schmidt, and Seastedt Citation1998) and phenology of plant communities (Khorsand Rosa et al. Citation2015).
Snowbed communities (i.e., Salicetum herbaceae Braun-Blanquet and Jenny Citation1926) are especially vulnerable to the forecasted decrease in snowfall and change in snow cover duration, coupled with increased temperature (Carbognani, Petraglia, and Tomaselli Citation2012; Bender, Lehning, and Fiddes Citation2020). In fact, the moment of snowmelt and the related beginning of the snow-free period sets the start and the duration of the whole growing season, conditioning plant survival, distribution, growth, and phenology (D. A. Walker et al. Citation1993; Stanton, Rejmanek, and Galen Citation1994; Huelber et al. Citation2006; Quaglia et al. Citation2020). For instance, Quaglia et al. (Citation2020) noted that the interannual variability of the snowmelt date and the length of the snow-free season markedly affected the temporal distribution of the phenological phases, and Petraglia et al. (Citation2014) showed, through a manipulation experiment, that an earlier snowmelt time determines an earlier occurrence of the flowering date of several snowbed species. A longer growing season could make grassland species more competitive than snowbed ones, thus changing the community to grasslands dominated species (Matteodo et al. Citation2016). In turn, these biological responses can alter biogeochemical cycles and ecosystem services, causing an increased decomposition of carbon stored in soils (Schuur et al. Citation2008), with a loss of biodiversity (Pauli, Gottfried, and Dullinger Citation2012) and changes in trophic dynamics (Post and Pedersen Citation2008; Wookey et al. Citation2009).
However, because the uptake of elements depends both on the phenology of plants and the availability of the resource, it is not easy to discriminate between the contribution of the factors affecting the availability of soil nutrients (e.g., pedoclimatic conditions) and the plants acquisition of nutrients. For instance, nitrogen (N) supplies, including inorganic (NH4+ and NO3−) and organic (dissolved organic nitrogen, DON) forms, show a pronounced seasonality, which is run by variations of soil temperature and moisture levels, whereas its uptake is related to different phenological phases of plants (Tian et al. Citation2017). Because the early stages such as foliation and flowering are the most demanding for the majority of alpine plants, during this phenological phase the nutrients uptake is the highest, whereas it reduces near the end of the plant cycle (Adair and Burke Citation2010). The balance of nutrient uptake, assimilation, and losses through turnover, leaching, exudation, and other disturbances (e.g., grazing, parasites, etc) affect nutrient concentrations (such as nitrogen) in plant biomass (Chapin and Shaver Citation1989; Aerts and Chapin Citation2000; Eckstein and Karlsson Citation2001). Güsewell (Citation2004) noted that nitrogen concentration in herbaceous plant biomass was positively correlated with the Ellenberg et al. (Citation1991) nutrient (N) indicator value, which can be considered as an estimator of nutrient requirements (Ryser and Urbas Citation2000). This indicator value, among others, belongs to the wide family of ecological indicator values (EIVs) widely used by plant ecologists because they can characterize the ecological condition of a site using species composition without the need of direct measurements (Diekmann Citation2003).
For the flora of Central Europe and for the Alps, Ellenberg et al. (Citation1991) and Landolt et al. (Citation2010), respectively, attributed to each plant species a numerical value referred to an ordinal range (Ellenberg: from one to nine; Landolt from one to five) to express the ecological optimum of a species for a given environmental factor (e.g., for soil moisture, nutrients, reaction, etc). For instance, high average N values suggest that vegetation communities occur in nutrient-rich conditions, whereas low average N values suggest nutrient-poor conditions (Güsewell, Peter, and Birrer Citation2012; Pittarello et al. Citation2016). The accuracy of such EIVs lies in the knowledge and extensive field experience of botanists and ecologists (Ellenberg et al. Citation1991; Pignatti et al. Citation2005; Landolt et al. Citation2010). Moreover, EIVs are a valid tool for habitat estimation and could be used to indirectly describe the corresponding pedoclimatic properties (Schaffers and Sýkora Citation2000), which could be affected by changes in climate conditions and influence the soil C and N cycling.
Despite the reliability of such a tool, few studies utilized EIVs, and few of them were performed in the snowbed habitat (e.g., Robbins and Matthews Citation2014; Matteodo et al. Citation2016). As supported by several authors (e.g., Björk and Molau Citation2007; Schöb et al. Citation2008; Carbognani, Petraglia, and Tomaselli Citation2012; Ernakovich et al. Citation2014), we hypothesize that the predicted change in the amount and timing of snowpack due to climate change will influence snowbed ecosystems, altering pedoclimatic condition and phenology, which in turn will affect the C and N soil biogeochemical cycles. Furthermore, given that snowbeds are more vulnerable to climate change effects than other subalpine and alpine plant communities (Matteodo et al. Citation2016), they are often considered as a target habitat where the effects of global warming on alpine vegetation can be thoroughly explored (Björk and Molau Citation2007; Schöb et al. Citation2008). Therefore, for four years we studied the floristic composition, phenology, and soil C and N forms of seven homogeneous permanent plots (all belonging to Salicetum herbaceae communities), identifying standard variables most sensitive to environmental changes, supporting the long-term ecological research in high-elevation ecosystems. In particular, our work aimed at (1) evaluating the interannual variability (2016–2019) of climatic and pedoclimatic conditions, soil C and N forms, and plant phenology dynamics; (2) assessing the effect of climatic, pedoclimatic, and vegetation variables (i.e., plant phenology and EIVs) on soil C and N dynamics; and (3) evaluating the considered abiotic/biotic drivers as possible monitoring variables of the response of C and N biogeochemical cycles to climate change in the framework of the long-term ecological research.
Materials and methods
Study area
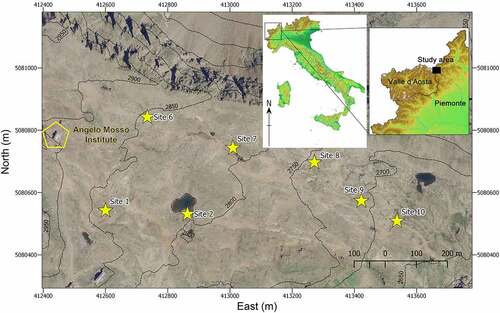
The study was carried out at the Long-Term Ecological Research (LTER) Site Angelo Mosso Scientific Institute (https://deims.org/17210eba-d832-4759-89fa-9ff127cbdf6e), located in the Western Italian Alps at the foot of the Monte Rosa Massif (4,634 m.a.s.l.), on the border between Piemonte and Valle d’Aosta Regions (northwest Italy; ). The research was performed at seven permanent study sites (named site 1, 2, 6, 7, 8, 9, 10, according to the LTER site numerations), located between 2,686 m.a.s.l. (site 10) and 2,854 m.a.s.l. (site 6).
Figure 1. Location of the research study area in Italy and in the northwestern Italian Alps (www.pcn.minambiente.it), aerial overview of the study area (orthoimage year 2006; coordinate system WGS84/UTM 32 N), and location of the seven permanent study sites at the LTER Site Angelo Mosso Scientific Institute.
Since 2007, meteorological parameters of the study area were continuously recorded by an Automatic Weather Station located at 2,901 m.a.s.l. and belonging to the Italian Army (Comando Truppe Alpine–Servizio Meteomont). From 2007 to 2019, the area was characterized by a mean annual air temperature of −2.2°C and a cumulative annual snowfall of 805 cm, and the mean annual liquid precipitation was ca. 370 mm. Generally, the snowpack accumulated by late October–early November, and snowmelt started typically in late April to early May. The mean snow cover duration was 263 days, ranging between a minimum of 236 to a maximum of 312 days. The mean soil temperature during the snow-covered season was 0°C, and it was 7°C during the snow free season. Generally, the mean duration of soil freezing lasted for 52 days, ranging between 0 and 162, with a mean temperature of −1°C.
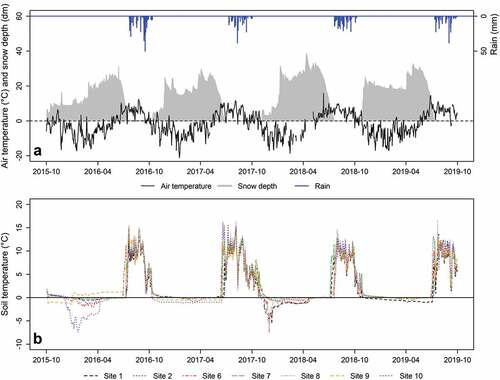
During the time span 2016–2019 (hydrologic years; i.e., 1 October 2015–30 September 2016), the mean annual air temperature recorded by the Automatic Weather Station was −1.8°C, with mean daily values ranging from a minimum of −21.1°C (16 January 2017) to a maximum of +15.8°C (12 June 2018; ). The mean air temperature during 2017 and 2019 was warmer than the historical time series (2007–2019 time frame; −2.2°C), with values of −1.4°C and −1.5°C, respectively (). The cumulative liquid precipitation during the snow-free season ranged between 202 mm in 2017 and 380 mm in 2016, with a maximum daily liquid precipitation of 50.0 mm (16 September 2016). In 2017 and 2019 the cumulative liquid precipitation was below the mean value of the historical time series (283 mm; 2007–2019 time frame). The snow cover duration ranged between 254 days (2018) and 295 days (2016; ); 2018 was the only year with a snow cover duration below the mean value of the historical time series (263 days). The earliest snowmelt day occurred in year 2017 (day of year [DOY] 184) and the latest occurred in 2016 (DOY 202). The mean snow density before snowmelt onset was equal to 341 kg m−3, and the mean snow water equivalent was around 1,113 mm; the N-NH4+ and N-NO3− stocks in the snowpack ranged between 0.34–0.97 and 0.53–0.88 kg ha−1 while dissolved organic carbon (DOC) and DON stock ranged between 7.4–10.9 and 0.85–2.34 kg ha−1.
Table 1. Weather conditions recorded by the Automatic Weather Station during the experimental period (2016–2019) and historical time frame (2007–2019).
Figure 2. (A) Air temperature (mean daily values), snow depth, and rainfall recorded at the Automatic Weather Station (AWS) from 1 October 2015 to 30 September 2019 and (B) soil temperature (10 cm depth, mean daily values) at the seven study sites.
The bedrock was primarily micaschists, with some inclusions of amphibolites and calcschists. Soils, described and classified according to the Food and Agriculture Organization (Citation2006) and IUSS Working Group WRB (Citation2015), belonged mainly to Regosol (sites 1, 8), Leptosol (site 2), Cambisol (sites 6, 7), and Umbrisol (sites 9, 10) great groups (IUSS Working Group WRB Citation2015; Supplementary Material, Table S1). Soil total organic C (TOC) and N (TN) ranged from 0.1 to 18.4 percent and from 0.02 to 1.23 percent, respectively; soil pH ranged from 4.2 to 6.1. Detailed soil classification and physical and chemical parameters are summarized in Supplementary Material, Table S1.
The vegetation of the sites was included in the “Siliceous alpine and boreal grasslands” (habitat 6150, according to the EU Habitat Directive), belonging to the association Salicetum herbaceae (Quaglia et al. Citation2020). The vast majority of the species could be described, based on vegetative optimum, either as snowbed specialists, debris, or grassland species, according to Aeschimann, Lauber, and André Michel (Citation2004).
Site-specific climatic-pedoclimatic variables
For the measurement of hourly soil temperature, each study site was equipped with thermistors combined with dataloggers (HOBO Pro v2 U23-00x, accuracy: ±0.1°C) placed within soil at a 10 cm depth, from fall 2016 until fall 2019. Moreover, several site-specific variables were calculated (): (1) proportion of cumulative rain days from the melt-out day to each sampling day (PRD; extracted from the Automatic Weather Station data); (1) snow cover duration (SCD), based on each hydrological year (as the following variables), using the daily soil temperature data: when the daily variation of soil temperatures remained below 1°C, the day was considered as a “snow-covered day” (Danby and Hik Citation2007); (3) melt-out day of snow (MOD), calculated as the first day of each hydrological year in which the daily amplitude of soil temperature went above 1°C; (4) duration of soil freezing (DSF); that is the number of days in which soil temperatures remained below 0°C; (5) number of soil freeze–thaw cycles (FTCs), estimated when the daily mean soil temperature reached values below and above 0°C (Phillips and Newlands Citation2011); (6) mean temperature of soil during the freezing period (MTF); (7) mean temperature of soil during the snow-free season (MTSF); (8) intensity of soil freezing (ISF); and (9) gravimetric water content of soil (GWC) calculated at every sampling time (Black Citation1965).
Table 2. Selected climatic, pedoclimatic, and vegetation variables used in generalized linearmixed models (GLMM).
Soil sampling and analysis
At each site, inside a homogenous snowbed pertaining to the Salicetum herbaceae association, one 9 m2 plot was established. Three topsoil samples (A horizon, 0–10 cm depth) were collected within the plot each month during the snow-free season from 2016 until 2019. The three topsoil samples were analyzed separately, as analytical replicates, and then we obtained a single average value for a single plot. More specifically, three soil samplings were performed each year in July, August, and September. Each soil sample was sieved at 2 mm within 24 hours since collection and oven-dried at 105°C for 8 hours to obtain the GWC. An aliquot of 20 g of fresh soil was extracted with 100 mL K2SO4 0.5 M, and 10 g was fumigated using chloroform for 18 hours before extraction with 50 mL K2SO4 0.5 M. The concentration of DOC both in not fumigated and fumigated soil extracts (extractable DOC) was determined with a TOC analyzer (Elementar, Vario TOC, Hanau, Germany) after filtration with 0.45-μm nylon membrane filters. The microbial carbon (Cmicr) was estimated as the difference in extractable DOC between fumigated and nonfumigated samples, corrected using a recovery factor of 0.45 (Brookes et al. Citation1985). Ammonium (extractable N-NH4+) concentrations in soil extracts were measured spectrophotometrically (U-2000, Hitachi, Tokyo, Japan) using a modified Berthelot method based on the reaction with salicylate in the presence of alkaline sodium dichloroisocyanurate (Crooke and Simpson Citation1971). Nitrate (extractable N-NO3−) concentrations in soil extracts were measured spectrophotometrically (U-2000, Hitachi, Tokyo, Japan) using the Greiss reaction (Mulvaney Citation1996) modified according to Cucu et al. (Citation2014). Total dissolved nitrogen (extractable TDN) in the extracts was measured as reported for DOC. Extractable DON was determined as the difference between extractable TDN and inorganic nitrogen (extractable N-NH4+ + N-NO3−) in the extracts. Microbial nitrogen (Nmicr) was estimated from the difference in extractable TDN between fumigated and nonfumigated samples corrected using a recovery factor of 0.54 (Brookes et al. Citation1985).
Vegetation variables and phenology surveys
From summer 2016 to 2019, surveys were carried out to describe the site vegetation composition and identify the most abundant species. Within each site, a 16 m2 (4 × 4 m) square plot (marked by metal pegs) for vegetation and phenology surveys was placed close to the soil sampling plot. Along the two diagonals of each plot, the vertical point-quadrat method (Daget and Poissonet Citation1971) was used to detect botanical composition. At 5-cm intervals, plant species touching a steel needle were identified and recorded, for a total of 200 measurements per plot. Because occasional species are often missed, a complete list of plant species found in the plot was recorded. The frequency of occurrence of each species, which is an estimate of species canopy cover, was calculated and converted to species percentage cover (%SC; Pittarello et al. Citation2016); that is, by dividing the frequency of occurrence by 2. A %SC = 0.3 was attributed to all occasional plant species (Tasser and Tappeiner Citation2005). The demand of each plant species for moisture level (F), soil pH level (R), and soil nitrogen content (N) was estimated according to the Landolt EIVs (Landolt et al. Citation2010; Supplementary Material, Table S2). Such values range from 1 (low demand) to 5 (high demand). Then, each plant species was associated with the corresponding F, R, and N Landolt value and the mean indexes (Fm, Rm, Nm) were calculated for each plot, separately for each year and site, by averaging species values weighted on their %SC. Plant phenology was recorded for S. herbacea, which not only was the most abundant species across all plots (%SC ranged from 37 to 73 percent, being lower than 50 percent in one single plot), but it had an extensive radical mass (Wijk Citation1986) when compared with the other species, and it was thus believed to have a greater interaction with soil chemicals. The main plot was divided into sixteen adjacent 1 × 1 m subplots, used as pseudo-replicates, where the phenophase of the most advanced individual was recorded seven to nine times per year throughout the whole growing season (Quaglia et al. Citation2020). The phenophase was assigned with a visual observation of the individual using an adaptation of the Biologische Bundesanstalt, Bundessortenamt and CHemical industry scale (Hack et al. Citation1992) fitted for the snowbed plant communities as a reference (Quaglia et al. Citation2020). This scale is characterized by a series of progressive integer numbers ranging from zero to fifty-nine, where the tens represent the major phenophases in chronological order (shoot emergence, leavf development, flower buds, flowering, fruiting, seed dispersal) and the units represent the advancement of such phenophases. The parameter S. herbacea phenophase (SP) was calculated for every soil sampling date as the linear interpolation of the median of the sixteen subplots of each phenological survey date.
Statistical methods
Statistical analyses were performed using R software v3.6.0 (R Core Team Citation2019). To assess the relative importance of climatic-pedoclimatic and vegetation variables (i.e., explanatory variables, ), nine generalized linear mixed models (GLMMs) were fitted, one for each response variable related to soil C and N forms: N-NH4+, N-NO3−, DOC, TDN, Cmicr, Nmicr, DON, CNmicr. Before modeling data with GLMMs, a correlation analysis (Pearson coefficient) was performed on explanatory variables to exclude highly collinear variables (r > |0.70|; ISF excluded). Explanatory variables were standardized (Z-scores) to allow the assessment of their size effect by scrutinizing model parameters (β coefficients). To account for the repeated measure structure, the soil sampling period, year, and site were considered as crossed random factors. Because all response variables had continuous and positive values (Y > 0), models were built both with Gaussian (identity- and log-link functions) and Gamma (log-link function) distributions and then the best fitting one was chosen based on the lowest Akaike information criterion (Zuur et al. Citation2009). For each GLMM, explanatory variables with a minimal effect on the overall model fit were identified with the “drop1” function from “stats” R package and removed from the model afterward. Through this procedure, each factor was iteratively removed at a time while holding the remaining factors constant and, using an analysis of deviance test, a report of the extent to which each factor affected the overall model fit was provided. Model assumptions were checked using “DHARMa” R package v0.2.7. (Hartig Citation2020). Modeling was carried out using the “glmmTMB” function from the “glmmTMB” R package v1.0.1. (M. E. Brooks et al. Citation2017).
Results
Interannual variability of site-specific climatic and pedoclimatic conditions
During the snow-covered season, the topsoil temperatures recorded in the study sites were usually close to 0°C (), with exceptions in early winters 2015–2016 and 2017–2018. It reached a minimum of −7.5°C in 2018 at site 6. ISF was always classified as mild freezing, except for two events of mild/hard freezing (cf. Tierney et al. Citation2001) recorded at sites 1, 6, 8 in 2017 (−6.6°C, −7.5°C, −6.8°C) and at site 10 in 2016 (−7.3°C). The lowest MTF (−2.4°C) occurred at site 10 in 2016. DSF ranged between 0 days (site 8, 2019) and 247 days (sites 6, 9, 2018; site 10, 2017). The maximum number of FTCs (two) was recorded at sites 1 and 10 in 2018 and at site 7 in 2019. SCD ranged between 230 (site 8, 2018) and 283 days (site 1, 2016; ). The SCD was weakly positively correlated with the MOD (r = 0.38, p < .001). Earliest MOD occurred at site 6 on DOY 163 (2017) and the latest MOD occurred at sites 9 and 10 on DOY 201 (2018; ).
Table 3. Descriptive statistics for all variables used in the generalized linearmixed models (GLMMs).
During the snow-free season, the topsoil temperatures reached the maximum of 16.7°C at site 8 in 2019 (), and the lowest and highest MTSF were 2.1°C and 11.4°C, respectively, at site 10 (2019).
Rainy days (PRD variable) were not equally distributed in the different snow-free seasons. In particular, in 2016 rainy days were mostly concentrated in September, close to the third sampling, accounting for 40 percent of the total liquid precipitation of the snow-free period. In 2017 rainy days were equally distributed between August and September, during which 60 percent of the total rainfall occurred. Otherwise, rainy days were slightly concentrated in August in 2018, whereas in 2019 liquid precipitation was quite well distributed across the whole snow-free season.
The GWC was between 27 and 28 percent in 2016 and 2017, respectively, whereas in 2018 and 2019 it was lower, between 20 and 23 percent, respectively. The lowest GWC (14 percent) was recorded at site 8 (September 2019) and the highest (44 percent) at site 9 (September 2017). Overall, during the four years of monitoring, site 7 was the driest, with a mean GWC of around 19 percent, whereas sites 2 and 6 were the wettest, with values around 30 percent.
Interannual variability of soil C and N dynamics
On an interannual basis (), N-NH4+ reached minimum (0.6 mg kg−1) and maximum (11.8 mg kg−1) values in 2017 (site 8) and 2019 (site 9), respectively (); the N-NO3− content reached a minimum value (0.1 mg kg−1) in 2016 (sites 1 and 7) and 2017 (sites 7 and 8), and the maximum value (2.0 mg kg−1) was recorded in 2019 (site 10). DOC content ranged between 29.4 and 165.1 mg kg−1, both in 2016 (sites 8 and 2, respectively). TDN reached minimum (4.4 mg kg−1) and maximum (54.0 mg kg−1) values in 2017 (site 8) and 2016 (site 6), respectively. DON reached minimum (1.9 mg kg−1) and maximum (50.5 mg kg−1) values in 2019 (site 7) and 2016 (site 6). Cmicr ranged between 143.0 and 1,166.2 mg kg−1, both in 2017 (sites 8 and 9, respectively), and Nmicr reached minimum (7.4 mg kg−1) and maximum (86.8 mg kg−1) values in 2019 (site 7) and 2016 (site 2), respectively. C:Nmicr reached a minimum value (5.0) at site 1 in 2018 and a maximum value (29.4) at site 7 in 2019.
Figure 3. Interannual variability of soil C and N forms in the seven snowbed communities. Sampling periods refer to different moments of sampling, which occurred every year within July, August, and September.
Vegetation and phenology dynamics and interannual variability
Although from 2016 to 2019 sixty plant species were identified within the seven permanent sites, S. herbacea was the most abundant (56.6 percent ± 0.02, mean %SC ± standard error). Overall, the other species had a moderate abundance, such as Alchemilla pentaphyllea L. (11.3 percent ± 0.35), Poa alpina L. (11.2 percent ± 0.02), Luzula alpinopilosa (Chaix) Breistr. (6.5 percent ± 1.68), and Gnaphalium supinum L. (5.0 percent ± 0.02).
The growing cycle of S. herbacea showed some variations throughout the monitoring years, with a perceivable shift in the timing of the events. In general, the first phenophases (from emergence to flowering) proceeded in a fast sequence right after the snowmelt, whereas the late phenophases (fruiting to seed dispersal) occurred at a slower rate (). The mean onset of flowering (phenophase 35) was on DOY 212 in 2018, with twenty-one days of delay on the same phenophase in 2017 (). The interannual difference in the period of appearance of the pre-flowering phenophases (i.e., less than thirty-five) is greater than the difference in the post-flowering phenophases (more than thirty-five; ). Beginning of seed dispersal started the earliest in 2017 (DOY 213) and occurred the latest in 2018 (DOY 257) with a maximum forty-four-day gap. Mean seed dispersal started on DOY 217 in 2017 and DOY 247 in 2018, whereas it occurred on DOY 241 in 2016 and DOY 234 in 2019.
Figure 4. Phenology of the species Salix herbacea throughout the four-year monitoring period. Phenophases are indicated on the y axis as a progressive number following the adaptation of the Biologische Bundesanstalt, Bundessortenamt and Chemical industry scale (Hack et al. Citation1992); day of year is reported as a variable on the x axis. For every year, the lines represent the median phenophase of the seven sites on each survey date.
Influence of climatic-pedoclimatic and vegetation variables on soil C and N forms
GLMMs revealed that several climatic and pedoclimatic variables significantly influenced soil extractable C and N forms in snowbed areas ( and Supplementary Material, Table S3), although with a different weight. In particular, considering the ranking of relative importance provided by β coefficients for each soil C and N forms (), the GWC resulted overall the most important variable, affecting primarily, with a positive relation, extractable DOC, TDN, Cmicr, and C:Nmicr. Moreover, it affected, as a second variable, N-NH4+ and Nmicr and, as a third variable, N-NO3−. The MOD played a fundamental role as well, resulting in one of the most important variables, influencing primarily, with a positive relation, extractable N-NO3− and Nmicr. MOD also affected positively, as a second variable, extractable DOC, TDN, and Cmicr and, as third variable, N-NH4+. The DSF influenced positively, as a first and third variable, respectively, extractable DON and TDN. The climatic variable PRD negatively influenced N-NO3− (as a second variable) and Nmicr (as a fourth variable). Although with a less important ranking, FTCs positively affected, as a second variable, C:Nmicr, whereas MTSF affected, as third variable with a positive relation, both Cmicr and Nmicr. SCD played a marginal role, affecting as a third variable only extractable DOC, with a negative relation.
Figure 5. Standardized effects of climatic-pedoclimatic and vegetation variables on soil C and N forms derived from generalized linear mixed models. For each model, the effects (standardized coefficient) of each independent variable are represented by a point symbol and their confidence intervals by a horizontal line. The independent variables are listed on the y axis: PRD, SCD, MOD, DSF, FTCs, MTF, MTSF, ISF, GWC, SP, Fm, Nm, and Rm. When the horizontal line intersects the vertical black line (representing a null effect), it means that the independent variable has no significant effect. Conversely, when the confidence interval line does not intersect the vertical black line, the independent variable has a significant effect. Significance: *p < 0.05, **p < 0.01, ***p < 0.001; the absence of asterisks means that there is no significant effect.
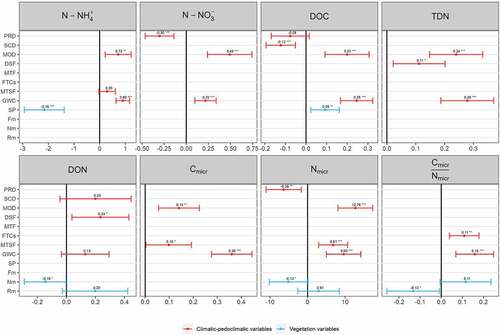
Concerning the vegetation variables, SP and Nm were the most important variables, whereas the effect of Rm was less pronounced. In particular, SP primarily influenced N-NH4+ with a negative relation, also affecting DOC (positive relation) as a fourth variable. Nm negatively influenced DON and Nmicr, respectively, as second and fifth variables and Rm affected C:Nmicr as a second variable with a negative relation.
Because EIVs are attributed on a scale from 1 to 5 with a 0.5 interval precision, the required variation range for each index significance is 0.5 (). Nm variation is slightly higher, whereas both Rm and Fm have lower variation rates (Rm min = 2.06, Rm max = 2.30, Fm min = 3.29, Fm max = 3.59), and despite the barely significant relation of Rm with C:Nmicr, neither one provides significant interactions with any other measured soil parameter ().
Discussion
Climatic-pedoclimatic drivers on soil C and N forms
In the time span 2016–2019, during both the snow-covered and snow-free seasons, the climatic and pedoclimatic variables had a fundamental effect on soil C and N forms in our research area, strongly influencing the soil biogeochemical cycles of the snowbed communities. In particular, soil GWC during the snow-free season, which ranged between 14.3 and 43.8 percent, had a first-order effect on soil C and N forms: the greater the GWC, the higher the content of N-NH4+, N-NO3−, DOC, TDN, Nmicr, Cmicr, and C:Nmicr. Our results confirmed the importance of soil water content as one of the main variables favoring microbial activity and C and N transformations (e.g., Haynes Citation1986; Stark and Firestone Citation1995; Lipson, Schmidt, and Monson Citation1999; Magnani et al. Citation2017; Pintaldi et al. Citation2019), in both snow-covered (Larsen, Jonasson, and Michelsen Citation2002) and growing seasons (Lipson, Schmidt, and Monson Citation1999). Indeed, within the climate change perspective, even small changes in water content availability could strongly influence the soil microbial biomass and N availability (Rui et al. Citation2011; Wang et al. Citation2014). The results are in agreement with those reported by Magnani et al. (Citation2017) in the same study area but under different vegetation cover, which showed a positive correlation between soil water content and the microbial biomass, N-NH4+, and DOC concentrations, confirming that water content is of great importance to the C and N dynamics in these high-elevation ecosystems. This is in accordance with Thornton et al. (Citation2021), who identified the soil hydraulic properties among the essential mountain climate variables, such as snowmelt.
In our work, the snowmelt timing (MOD) played an important role as well, significantly influencing, with a positive relation, several C and N forms. In particular, our results indicated that an earlier MOD caused a decrease in soil N-NH4+, N-NO3−, DOC, TDN, Nmicr, and Cmicr, therefore representing one of the most important abiotic variables in our snowbed areas. The strong effect of MOD on soil C and N could be explained by the interaction of several variables such as the snowpack nutrient input (Filippa et al. Citation2010; Freppaz et al. Citation2018), earlier plant development and nutrient uptake (Cooper, Dullinger, and Semenchuk Citation2011), and the related competition dynamics with microbial communities (Legay et al. Citation2013). As demonstrated by several authors (P. D. Brooks and Williams Citation1999; Hiltbrunner, Schwikowski, and Körner Citation2005; Petrone, Buffam, and Laudon Citation2007; Filippa et al. Citation2010; Freppaz et al. Citation2018; Westergaard-Nielsen et al. Citation2020), snowpack is considered a remarkable source of both dissolved inorganic and organic N; therefore, the timing of snowmelt defines the start and duration of the growing season, and water and nutrients released from the snowpack influence soil moisture, nutrient status (Kuhn Citation2001), and microbial activity until later in the summer (Freppaz et al. Citation2018). An earlier snowmelt day is a forecasted effect of global climate change (Beniston et al. Citation2003), which may affect the temporal N dynamics, limiting the important ecosystem functions performed by winter soil microbial communities, such as the breakdown of complex litter residues and associated buildup of high soil DON and available NH4+ (Broadbent, Snell, and Michas et al. Citation2021). Thus, in a warming climate scenario, we can assume an overall future decrease in soil available nutrients and microbial biomass in more snow-free high-elevation snowbed habitats.
Based on our results, the DSF significantly affected DON and TDN with a positive relation. The results agree with those reported by Pintaldi et al. (Citation2019), although in a subalpine forest catchment, where DSF significantly influenced, with a positive relation, both organic and inorganic N forms. As shown by several authors (Kalbitz et al. Citation2000; Grogan et al. Citation2004; Groffman et al. Citation2011; Viglietti et al. Citation2014), DSF can cause an increase in soil organic labile forms, which is mainly attributable to the physical disruption of the litter layer (and/or rootlets) and the consequent leaching from the disrupted materials. The cryogenic disruption of aggregates (Kværnø and Øygarden Citation2006) and microbial mortality (Groffman et al. Citation2001) can have the same effects. Furthermore, Vestgarden and Austnes (Citation2009) found that prolonged soil freezing increased soil C and N forms as well, probably partly because of starvation and exhaustion and increased lysis of microorganisms. Less snow and a later start of protective snow cover associated with climate change can be associated with deeper frost penetration in soils at the beginning of winter, thus increasing soil freezing effects on soil nutrient cycling and microbial communities. In fact, the effect of colder soils in a warmer world is well known (Groffman et al. Citation2001). Higher labile C and N contents at the beginning of the snow-free season, associated with early leaching, will also lead to a nutrient loss in these high-elevation soils.
The number of FTCs was a weak variable, affecting only C:Nmicr with a positive relation. This result can be explained by the fact that, during the four years of monitoring, a very limited number of FTCs were recorded. In addition, snowbed areas are, by definition, characterized by long-lasting snow cover (even eight to ten months; e.g., Hiller et al. Citation2005), which decouples soil temperature from the extreme cold air temperatures (Körner Citation2003).
The climatic variable rainfall days (PRD) significantly influenced both N-NO3− and Nmicr, with a negative relation. The negative relation between PRD and N-NO3− was probably linked with leaching phenomena governed by precipitation (e.g., Egli, Mirabella, and Sartori Citation2008), as well as with a sort of dilution effect of infiltrating water caused by increasing rain (e.g., Balestrini et al. Citation2019; Pintaldi et al. Citation2019), even if this variable is not related with the GWC of each plot, which seems to favor the nitrification processes. Regarding the relation between PRD and Nmicr, a similar trend was reported in the same area but for different soil types by Freppaz et al. (Citation2019). Although this variable is not necessarily related with the GWC of each plot, it is reasonable to suppose that greater PRD may also indicate a greater soil water content (at least in the short term), which may reduce the microbial N assimilation, even if the site-specific GWC was positively related with the Nmic.
MTSF significantly influenced only the microbial biomass, positively affecting both Cmicr and Nmicr. These results are partially in agreement with Magnani et al. (Citation2017), who found a positive correlation between MTSF and Cmicr in the same area. The results are consistent with the high levels of sensitivity of soil microorganisms to variations in temperatures, especially in high-elevation ecosystems (e.g., Bing et al. Citation2016). Wang et al. (Citation2014) and Rui et al. (Citation2011) also reported an increased microbial biomass after a soil warming experiment in alpine meadows. Pintaldi et al. (Citation2019) also found that soil temperature significantly affected Cmicr and Nmicr in a subalpine forest.
Surprisingly, SCD significantly influenced only extractable DOC. Thus, our results differed from those reported by previous works in the same study area (e.g., Magnani et al. Citation2017; Freppaz et al. Citation2019), which highlighted the strong influence of SCD on several C and N forms, although under different vegetation covers. As shown by several authors (e.g., Fisk, Schmidt, and Seastedt Citation1998; D. A. Walker Citation2000; Edwards, Scalenghe, and Freppaz Citation2007), in both alpine and arctic tundra, SCD affects the ecosystem functions and structure; however, the intensity of its effects is still unclear, because it varies among different ecosystems. Concerning DOC, our results agree with those found by Freppaz et al. (Citation2019), who indicated a negative correlation between SCD and DOC. The soil temperature usually remained close to 0°C, which promoted the subnival degradation processes, allowing the progressive depletion of organic substrates caused by microbial respiration (Lipson, Schmidt, and Monson Citation2000). Based on the conceptual model proposed by P. D. Brooks and Williams (Citation1999), our research area could fall in a transition zone between Zone II and Zone III, where small changes in SCD could have remarkable effects on the soil N and C dynamics (Magnani et al. Citation2017). However, our results indicate a less pronounced effect of SCD, suggesting that other pedoclimatic variables had a first-order effect on C and N forms (e.g., GWC and MOD).
Phenology dynamics and vegetation variables: Plants–soil interaction
Our observations confirmed soil water content and melt-out day as main factors influencing phenology in alpine ecosystems (Ernakovich et al. Citation2014). More specifically, alpine plants typically depend on snowmelt water (Fisk, Schmidt, and Seastedt Citation1998), which may influence growth and growing season (Berdanier and Klein Citation2011). Thus, reduced water rather than nutrient availability is more likely to alter the timing of plant life cycles and productivity (Ernakovich et al. Citation2014). Furthermore, our results are in agreement with those reported by other research (Prevéy et al. Citation2019; Quaglia et al. Citation2020), which indicated snowmelt day as one of the main factors influencing phenophases of snowbed communities. Moreover, the potential change in snowmelt timing and snow thickness as a consequence of climate change would alter season length and nutrient availability (Semenchuk, Elberling, and Cooper Citation2013; Semenchuk et al. Citation2015) and produce several long-term plant species-specific effects, affecting future plant composition through possible cascading competition.
Concerning the biotic drivers of soil C and N cycling, the phenology of S. herbacea significantly affected N-NH4+, with a negative relation, whereas it influenced DOC with a positive relation. This relationship could be related to the plant uptake and development: the plant uptake increases with increasing phenophases until senescence, reducing N-NH4+ in soils, whereas the DOC content increases as a result of the release of root exudates into soils (Hütsch, Augustin, and Merbach Citation2002). In fact, up to 20 percent of the photosynthetically fixed C is released by roots into the soil during the vegetation period as C-rich rhizodepositions, which play several functions in both plant nutrition and soil ecology (Hütsch, Augustin, and Merbach Citation2002). Regarding N-NH4+, the i norganic nitrogen input from melting snowpack represents a large part of the annual atmospheric nitrogen input in snowbed plant communities (e.g., Bowman Citation1992; Björk and Molau Citation2007). Furthermore, N-NH4+ is considered the dominant inorganic N form during the early stage of snowmelt (Mullen, Schmidt, and Jaeger Citation1998) and, given that nitrates are more leachable, ammonium represents the main inorganic form in soils of alpine and tundra cenoses (Makarov et al. Citation2010). Ammonium is an important nitrogen source in cold wet climates with acidic soils, and where ammonium is the primary source of nitrogen, also associated with organic N, this may regulate growth (Björk et al. Citation2007; Nord and Lynch Citation2009). Our results are in agreement with those reported by Makarov et al. (Citation2010), who observed a gradual reduction of N-NH4+ during the growing season, caused by plant and microorganism uptake. This means that an advanced phenology of plants determined by climate change could lead to an early deployment of available N forms, influencing microbial activity and, thus, decomposition rate and soil fertility.
When considering Nm, its negative relation with DON and Nmicr highlights the vegetation influence on soil N dynamics. Greater values of the parameter Nm correspond in vegetation surveys to a considerable occurrence of plant individuals with high N demands, especially the grass P. alpina, which is one of the most frequent species in these snowbed communities and, to a lesser extent, the forb Taraxacum alpinum (Ten.) DC., which similarly is a eutrophic species but is less common. Therefore, our results verify that the content of microbial and organic N in the soil is reduced with an increase in eutrophic species in the vegetation composition. Our findings align with many literature sources in confirming the valuable contribution of EIVs for the description of indirect properties (Delgado and Ederra Citation2013; Szymura et al. Citation2014; Perotti et al. Citation2018). Even though we were not able to confirm the accuracy of more indexes, we argue that the structure of plant composition and the derived nitrogen EIV are relevant for inferring the nutrient content in snowbed soils and its seasonal fluctuations.
Conclusion
In this study, through four-year monitoring of soil C and N forms and phenology of seven homogenous snowbed areas located at the LTER Site Angelo Mosso Scientific Institute, we investigated the effect of climatic, pedoclimatic, and vegetation variables on soil C and N forms. Our results indicated that in these high-elevation microhabitats, among the climatic and pedoclimatic variables, soil water content, snow melt-out day, and duration of soil freezing during the snow-covered season are the main abiotic factors driving soil C and N dynamics. More specifically, a greater soil water content caused an increase in N-NH4+, N-NO3−, DOC, TDN, Nmicr, Cmicr, and C:Nmicr, whereas an earlier melt-out day decreased soil N-NH4+, N-NO3−, DOC, TDN, Nmicr, and Cmicr. In addition, the duration of soil freezing in the previous winter played an important role, causing an increase in DON and TDN. Among the vegetation variables, the phenology of S. herbacea represented an important biotic driver, suggesting that the plant–soil interaction played a crucial role, significantly influencing the C and N forms in these high-elevation soils. The identified abiotic (snow melt-out day, soil temperature, soil water content) and biotic (plant phenological stages) parameters could be suggested as standard observation variables for the evaluation of the response of the soil biogeochemical cycles in snowbed communities to changes in climatic conditions. These habitats are considered more vulnerable to climate warming than other subalpine and alpine ecosystems and should be carefully monitored in a long-term perspective.
Supplemental Material
Download Zip (24.9 KB)Acknowledgments
Thanks to the Comando Truppe Alpine-Servizio Meteomont for the data from the Automatic Weather Station at Col d’Olen and to Monterosa 2000 SpA. for the logistic support.
Disclosure statement
No potential conflict of interest was reported by the authors.
Supplementary material
Supplemental material for this article can be accessed on the publisher’s website.
Additional information
Funding
References
- Adair, E. C., and I. C. Burke. 2010. Plant phenology and life span influence soil pool dynamics: Bromus tectorum invasion of perennial C3–C4 grass communities. Plant and Soil 335 (1–2):255–69. doi:10.1007/s11104-010-0413-3.
- Aerts, R., and F. S. ChapinsIII. 2000. The mineral nutrition of wild plants revisited: A re-evaluation of processes and patterns. Advances in Ecological Research 30:1–67.
- Aeschimann, D., K. Lauber, and D. André Michel. 2004. Flora alpina: Atlante delle 4500 piante vascolari delle Alpi. Bologna: Zanichelli.
- Balestrini, R., C. A. Delconte, A. Buffagni, A. Fumagalli, M. Freppaz, I. Buzzetti, and E. Calvo. 2019. Dynamic of nitrogen and dissolved organic carbon in an alpine forested catchment: Atmospheric deposition and soil solution trends. Nature Conservation 34:41–66. doi:10.3897/natureconservation.34.30738.
- Bender, E., M. Lehning, and J. Fiddes. 2020. Changes in climatology, snow cover, and ground temperatures at high alpine locations. Frontiers in Earth Science. doi:10.3389/feart.2020.00100.
- Beniston, M. 2006. Mountain weather and climate: A general overview and a focus on climatic change in the Alps. Hydrobiologia 562:3–16. doi:10.1007/s10750-005-1802-0.
- Beniston, M., F. Keller, B. Koffi, and S. Goyette. 2003. Estimates of snow accumulation and volume in the Swiss Alps under changing climatic conditions. Theoretical and Applied Climatology 76 (3–4):125–40. doi:10.1007/s00704-003-0016-5.
- Berdanier, A. B., and J. A. Klein. 2011. Growing season length and soil moisture interactively constrain high elevation aboveground net primary production. Ecosystems 14 (6):963–74. doi:10.1007/s10021-011-9459-1.
- Billings, W. D., and L. C. Bliss. 1959. An alpine snowbank environment and its effects on vegetation, plant development, and productivity. Ecology 40:388–97. doi:10.2307/1929755.
- Bing, H., Y. Wu, J. Zhou, H. Sun, J. Luo, J. Wang, and D. Yu. 2016. Stoichiometric variation of carbon, nitrogen, and phosphorus in soils and its implication for nutrient limitation in alpine ecosystem of Eastern Tibetan Plateau. Journal of Soils and Sediments 16:405–16. doi:10.1007/s11368-015-1200-9.
- Björk, R. G., L. Klemedtsson, U. Molau, J. Harndorf, A. Ödman, and R. Giesler. 2007. Linkages between N turnover and plant community structure in a tundra landscape. Plant and Soil 294 (1):247–61. doi:10.1007/s11104-007-9250-4.
- Björk, R. G., and U. Molau. 2007. Ecology of Alpine snowbeds and the impact of global change. Arctic, Antarctic, and Alpine Research 39:34–43. doi:10.1657/1523-0430(2007)39[34:EOASAT]2.0.CO;2
- Black, C. A. 1965. Methods of soil analysis: Part I physical and mineralogical properties. Second ed. Madison, Wisconsin, USA: American Society of Agronomy.
- Blankinship, J. C., M. W. Meadows, R. G. Lucas, and S. C. Hart. 2014. Snowmelt timing alters shallow but not deep soil moisture in the Sierra Nevada. Water Resources Research 50 (2):1448–56. doi:10.1002/2013WR014541.
- Bliss, L. C. 1963. Alpine plant communities of the Presidential Range, New Hampshire. Ecology 44:678–97. doi:10.2307/1933014.
- Bowman, W. D. 1992. Inputs and storage of nitrogen in winter snowpack in an alpine ecosystem. Arctic and Alpine Research 24:211–15.
- Braun-Blanquet, J. 1932. Plant sociology. The study of plant communities. First ed. New York: McGraw-Hill Book Co.
- Braun-Blanquet, J., and J. Jenny. 1926. Vegetationsentwicklung und Bodenbildung in der alpinen Stufe der Zentralalpen. Denkschriften der Schweizerischen Naturforschenden Gesellschaft 63:183–349.
- Broadbent, A. A. D., H. S. K. Snell, A. Michas, W. J. Pritchard, L. Newbold, I. Cordero, T. Goodall, et al. 2021. Climate change alters temporal dynamics of alpine soil microbial functioning and biogeochemical cycling via earlier snowmelt. ISME Journal 15:2264–75. doi:10.1038/s41396-021-00922-0.
- Brookes, P. C., A. Landman, G. Pruden, and D. S. Jenkinson. 1985. Chloroform fumigation and the release of soil nitrogen: A rapid direct extraction method to measure microbial biomass nitrogen in soil. Soil Biology and Biochemistry 17:837–42. doi:10.1016/0038-0717(85)90144-0.
- Brooks, P. D., P. Grogan, P. H. Templer, P. Groffman, M. G. Öquist, and J. Schimel. 2011. Carbon and nitrogen cycling in snow-covered environments. Geography Compass 5:682–99. doi:10.1111/j.1749-8198.2011.00420.x.
- Brooks, M. E., K. Kristensen, K. J. van Benthem, A. Magnusson, C. W. Berg, A. Nielsen, H. J. Skaug, M. Mächler, and B. M. Bolker. 2017. glmmTMB balances speed and flexibility among packages for zero-inflated generalized linear mixed modeling. R Journal 9:378–400. doi:10.3929/ethz-b-000240890.
- Brooks, P. D., and M. W. Williams. 1999. Snowpack controls on nitrogen cycling and export in seasonally snow-covered catchments. Hydrologcal Processes 13:2177–90. doi:10.1002/(SICI)1099-1085(199910)13:14/15<2177::AID-HYP850>3.0.CO;2-V.
- Carbognani, M., A. Petraglia, and M. Tomaselli. 2012. Influence of snowmelt time on species richness, density and production in a late snowbed community. Acta Oecologica 43:113–20. doi:10.1016/j.actao.2012.06.003.
- Carbognani, M., M. Tomaselli, and A. Petraglia. 2014. Current vegetation changes in an alpine late snowbed community in the south-eastern Alps (N-Italy). Alpine Botany 124:105–13. doi:10.1007/s00035-014-0135-x.
- Cebon, P., U. Dahinde, H. Davies, D. Imboden, and C. C. Jaeger. 1998. View from the Alps: Regional perspectives on climate change. Cambridge: The MIT Press.
- Chapin, F. S., III, and G. R. Shaver. 1989. Differences in growth and nutrient use among Arctic plant growth forms. Functional Ecology 3:73–80.
- Cooper, E. J., S. Dullinger, and P. Semenchuk. 2011. Late snowmelt delays plant development and results in lower reproductive success in the High Arctic. Plant Science 180:157–67. doi:10.1016/j.plantsci.2010.09.005.
- Crooke, W. M., and W. E. Simpson. 1971. Determination of ammonium in Kjeldahl digests of crops by an automated procedure. Journal of the Science of Food and Agriculture 22:9–10. doi:10.1002/jsfa.2740220104.
- Cucu, M. A., D. Said-Pullicino, V. Maurino, E. Bonifacio, M. R. E, and L. Celi. 2014. Influence of redox conditions and rice straw incorporation on nitrogen availability in fertilized paddy soils. Biology and Fertility of Soils 50:755–64. doi:10.1007/s00374-013-0893-4.
- Daget, P., and J. Poissonet. 1971. A method of plant analysis of pastures. Annales Agronomiques 22:5–41.
- Danby, R. K., and D. S. Hik. 2007. Responses of white spruce (Picea glauca) to experimental warming at a subarctic alpine treeline. Global Change Biology 13:437–51.
- Delgado, V., and A. Ederra. 2013. Long-term changes (1982–2010) in the biodiversity of Spanish beech forests assessed by means of Ellenberg indicator values of temperature, nitrogen, light and pH. Biological Conservation 157:99–107. doi:10.1016/j.biocon.2012.06.022.
- Diekmann, M. 2003. Species indicator values as an important tool in applied plant ecology–a review. Basic and Applied Ecology 4 (6):493–506.
- Eckstein, R. L., and P. S. Karlsson. 2001. Variation in nitrogen-use efficiency among and within subarctic graminoids and herbs. New Phytologist 150:641–51.
- Edwards, A. C., R. Scalenghe, and M. Freppaz. 2007. Changes in the seasonal snow cover of alpine regions and its effect on soil processes: A review. Quaternary International 162–163:172–81. doi:10.1016/j.quaint.2006.10.027.
- Egli, M., A. Mirabella, and G. Sartori. 2008. The role of climate and vegetation in weathering and clay mineral formation in late Quaternary soils of the Swiss and Italian Alps. Geomorphology 102:307–24. doi:10.1016/j.geomorph.2008.04.001.
- Ellenberg, H., H. E. Weber, R. Dull, V. Wirth, W. Werner, D. Paulisen. 1991. Zeigerwerte von Pflanzen in Mitteleuropa [Indicator values of plants in Central Europe]. In Scripta Geobotanics. – V. 18, ed. H. Ellenberg, E. Weber, R. Dull, V. Wirth, W. Werner, and D. Paulisen, 248. Göttingen: Verlag Erich Goltze KG.
- Ernakovich, J. G., K. A. Hopping, A. B. Berdanier, R. T. Simpson, E. J. Kachergis, H. Steltzer, and M. D. Wallenstein. 2014. Predicted responses of Arctic and alpine ecosystems to altered seasonality under climate change. Global Change Biology 20 (10):3256–69.
- Filippa, G., M. Freppaz, M. W. Williams, D. Helmig, D. Liptzin, B. Seok, B. Hall, and K. Chowanski. 2009. Winter and summer nitrous oxide and nitrogen oxides fluxes from a seasonally snow-covered subalpine meadow at Niwot Ridge, Colorado. Biogeochemistry 95:131–49. doi:10.1007/s10533-009-9304-1.
- Filippa, G., M. Freppaz, M. W. Williams, and E. Zanini. 2010. Major element chemistry in inner alpine snowpacks (Aosta Valley Region, NW Italy). Cold Region Science and Technology 64:158–66. doi:10.1016/J.COLDREGIONS.2010.07.005.
- Fisk, M. C., S. K. Schmidt, and T. R. Seastedt. 1998. Topographic patterns of above-and belowground production and nitrogen cycling in alpine tundra. Ecology 79:2253–66.
- Food and Agriculture Organization. 2006. Guidelines for soil description, 4th ed. Rome: Food and Agriculture Organization of the United Nations. 92-5-105521-1.
- Freppaz, M., E. Pintaldi, A. Magnani, D. Viglietti, and M. W. Williams. 2018. Topsoil and snow: A continuum system. Applied Soil Ecology 123:435–40. doi:10.1016/j.apsoil.2017.06.029.
- Freppaz, M., D. Viglietti, R. Balestrini, M. Lonati, and N. Colombo. 2019. Climatic and pedoclimatic factors driving C and N dynamics in soil and surface water in the alpine tundra (NW-Italian Alps). Nature Conservation 34:67–90. doi:10.3897/natureconservation.34.30737.
- Gjaerevoll, O. 1956. The plant communities of the Scandinavian alpine snow-beds. Det Konglige Norske Videnskabers Selskabs Skrifter 1:405.
- Groffman, P. M., C. T. Driscoll, T. J. Fahey, J. P. Hardy, R. D. Fitzhugh, and G. L. Tierney. 2001. Colder soils in a warmer world: A snow manipulation study in a northern hardwood forest ecosystem. Biogeochemistry 56:135–50. doi:10.1023/A:1013039830323.
- Groffman, P. M., J. P. Hardy, S. Fashu-Kanu, C. T. Driscoll, N. L. Cleavitt, T. J. Fahey, and M. C. Fisk. 2011. Snow depth, soil freezing and nitrogen cycling in a northern hardwood forest landscape. Biogeochemistry 102:223–38. doi:10.1007/s10533-010-9436-3.
- Grogan, P., A. Michelsen, P. Ambus, and S. Jonasson. 2004. Freeze–thaw regime effects on carbon and nitrogen dynamics in sub-Arctic heath tundra mesocosms. Soil Biology and Biochemistry 36:641–54. doi:10.1016/j.soilbio.2003.12.007.
- Güsewell, S. 2004. N: P ratios in terrestrial plants: Variation and functional significance. New Phytologist 164:243–66. doi:10.1111/j.1469-8137.2004.01192.x.
- Güsewell, S., M. Peter, and S. Birrer. 2012. Altitude modifies species richness–nutrient indicator value relationships in a country-wide survey of grassland vegetation. Ecological Indicators 20:134–42.
- Hack, H., H. Bleiholder, L. Buhr, U. Meier, U. Schnock-Fricke, E. Weber, and A. Witzenberger. 1992. Einheitliche Codierung der phänologischen Entwicklungsstadien mono- und dikotyler Pflanzen - Erweiterte BBCH-Skala, Allgemein. Nachrichtenbl. Deut. Pflanzenschutzd. 44:265–70.
- Hammond, J. C., F. A. Saavadra, and S. K. Kampf. 2018. Global snow zone maps and trends in snow persistence 2001-2016. International Journal of Climatology 38 (12):4369–83. doi:10.1002/joc.5674.
- Hartig, F. 2020. DHARMa: Residual diagnostics for hierarchical (multi-level/mixed) regression models. R package version 0.2.7
- Haynes, R. J. 1986. Nitrification. In Mineral nitrogen in the plant-soil system, ed. R. J. Haynes, 127–65. New York: Academic Press. 9780323148160.
- Hiller, B., A. Nuebel, G. Broll, and F. K. Holtmeier. 2005. Snowbeds on silicate rocks in the Upper Engadine (Central Alps, Switzerland)—pedogenesis and interactions among soil, vegetation, and snow cover. Arctic, Antarctic, and Alpine Research 37:465–76. doi:10.1657/1523-0430(2005)037[0465:SOSRIT2.0.CO;2.
- Hiltbrunner, E., M. Schwikowski, and C. Körner. 2005. Inorganic nitrogen storage in alpine snow pack in the Central Alps (Switzerland). Atmospheric Environment 39:2249–59. doi:10.1016/j.atmosenv.2004.12.037.
- Hock, R., G. Rasul, C. Adler, B. Caceres, S. Gruber, Y. Hirabayashi, M. Jackson, A. Kääb, S. Kang, S. Kutuzov, et al. 2019. High mountain areas. In IPCC special report onthe ocean and cryosphere in a changing climate. Genf, Switzerland: IPCC.
- Holtmeier, F. K., and G. Broll. 1992. The influence of tree islands and microtopography on pedoecological conditions in the forest-alpine tundra ecotone on Niwot Ridge, Colorado Front Range, USA. Arctic and Alpine Research 24:216–28. doi:10.2307/1551660.
- Huelber, K., M. Gottfried, H. Pauli, K. Reiter, M. Winkler, and G. Grabherr. 2006. Phenological responses of snowbed species to snow removal dates in the Central Alps: Implications for climate warming. Arctic, Antarctic, and Alpine Research 38:99–103. doi:10.1657/1523-0430(2006)038[0099:PROSST]2.0.CO;2
- Hütsch, B. W., J. Augustin, and W. Merbach. 2002. Plant rhizodeposition—an important source for carbon turnover in soils. Journal of Plant Nutrition and Soil Science 165:397–407. doi:10.1002/1522-2624(200208)165:4<397::AID-JPLN397>3.0.CO;2-C
- IPCC. 2021. Climate Change 2021: The Physical Science Basis. Contribution of Working Group I to the Sixth Assessment Report of the Intergovernmental Panel on Climate Change. Cambridge and New York: Cambridge University Press. doi:10.1017/9781009157896
- IUSS Working Group WRB. 2015. World Reference Base for Soil Resources 2014, update 2015. International soil classification system for naming soils and creating legends for soil maps. World Soil Resources Reports No. 106. FAO, Rome.
- Johnson, P. L., and W. D. Billings. 1962. The alpine vegetation of the Beartooth Plateau in relation to cryopedogenic processes and patterns. Ecological Monographs 32:105–35. doi:10.2307/1942382.
- Kalbitz, K., S. Solinger, J. H. Park, B. Michalzik, and E. Matzner. 2000. Controls on the dynamics of dissolved organic matter in soils: A review. Soil Science 165:277–304. doi:10.1097/00010694-200004000-00001.
- Khorsand Rosa, R., S. F. Oberbauer, G. Starr, I. Parker La Puma, E. Pop, L. A. E, and T. Baldwin. 2015. Plant phenological responses to a long-term experimental extension of growing season and soil warming in the tussock tundra of Alaska. Global Change Biology 21:4520–32. doi:10.1111/gcb.13040.
- Knowles, J. F., P. D. Blanken, and M. W. Williams. 2015. Soil respiration variability across a soil moisture and vegetation community gradient within a snow-scoured alpine meadow. Biogeochemistry 125:185–202. doi:10.1007/s10533-015-0122-3.
- Körner, C. 2003. Alpine Plant Life. Berlin, Heidelberg: Springer. doi:10.1007/978-3-642-18970-8.
- Kuhn, M. 2001. The nutrient cycle through snow and ice, a review. Aquatic Sciences 63 (2):150–67. doi:10.1007/pl00001348.
- Kværnø, S. H., and L. Øygarden. 2006. The influence of freeze-thaw cycles and soil moisture on aggregate stability of three soils in Norway. Catena 67:175–82.
- Landolt, E., B. Bäumler, A. Erhardt, O. Hegg, F. Klötzli, W. Lämmler, E. Urmi, M. Nobis, et al. 2010. Ecological indicator values and biological attributes of the flora of Switzerland and the Alps. Bern, Stuttgart, Vienna: Editions des Conservatoire et Jardin botaniques de la Ville de Genève & Haupt Verlag.
- Larsen, K. S., S. Jonasson, and A. Michelsen. 2002. Repeated freeze–thaw cycles and their effects on biological processes in two Arctic ecosystem types. Applied Soil Ecology 21:187–95. doi:10.1016/j.catena.2006.03.011.
- Legay, N., F. Grassein, T. M. Robson, E. Personeni, M. P. Bataillé, S. Lavorel, and J. C. Clément. 2013. Comparison of inorganic nitrogen uptake dynamics following snowmelt and at peak biomass in subalpine grasslands. Biogeoscience 10:7631–45. doi:10.5194/bg-10-7631-2013.
- Lipson, D. A., S. K. Schmidt, and R. K. Monson. 1999. Links between microbial population dynamics and nitrogen availability in an alpine ecosystem. Ecology 80:1623–31. doi:10.1890/0012-9658.
- Lipson, D. A., S. K. Schmidt, and R. K. Monson. 2000. Carbon availability and temperature control the post-snowmelt decline in alpine soil microbial biomass. Soil Biology and Biochemistry 32:441–48. doi:10.1016/S0038-0717(99)00068-1.
- Magnani, A., D. Viglietti, D. Godone, M. W. Williams, R. Balestrini, and M. Freppaz. 2017. Interannual variability of soil N and C forms in response to snow—cover duration and pedoclimatic conditions in alpine tundra, northwest Italy. Arctic, Antarctic, and Alpine Research 49:227–42. doi:10.1657/AAAR0016-037.
- Makarov, M. I., N. A. Leoshkina, A. A. Ermak, and T. I. Malysheva. 2010. Seasonal dynamics of the mineral nitrogen forms in mountain-meadow alpine soils. Eurasian Soil Science 43:905–13. doi:10.1134/S1064229310080077.
- Matteodo, M., K. Ammann, E. P. Verrecchia, and P. Vittoz. 2016. Snowbeds are more affected than other subalpine-alpine plant communities by climate change in the Swiss Alps. Ecological Evolution 6:6969–82. doi:10.1002/ece3.2354.
- Mikan, C. J., J. P. Schimel, and A. P. Doyle. 2002. Temperature controls of microbial respiration in Arctic tundra soils above and below freezing. Soil Biology and Biochemistry 34:1785–95. doi:10.1016/S0038-0717(02)00168-2.
- Mullen, R. B., S. K. Schmidt, and C. H. Jaegers III. 1998. Nitrogen uptake during snowmelt by the snow buttercup, Ranunculus adoneus. Arctic and Alpine Research 30:121. doi:10.2307/1552126.
- Mulvaney, R. L. 1996. Nitrogen—inorganic forms. In Methods of soil analysis: Part 3 Chemical methods, eds. D.L. Sparks, A.L. Page, P.A. Helmke, R.H. Loeppert, P. N. Soltanpour, M. A. Tabatabai, C. T. Johnston, and M. E. Sumner, 1123-1184. Madison, WI: Soil Science of America.
- Nord, E. A., and J. P. Lynch. 2009. Plant phenology: A critical controller of soil resource acquisition. Journal of Experimental Botany 60 (7):1927–37. doi:10.1093/jxb/erp018.
- Notarnicola, C. 2020. Hotspots of snow cover changes in global mountain regions over 2000–2018. Remote Sensing of Environment 243:111781. doi:10.1016/j.rse.2020.111781.
- Pauli, H., M. Gottfried, and S. Dullinger. 2012. Recent plant diversity changes on Europe's mountain summits. Science 336:353–55. doi:10.1126/science.1219033.
- Perotti, E., M. Probo, M. Pittarello, M. Lonati, and G. Lombardi. 2018. A 5-year rotational grazing changes the botanical composition of sub-alpine and alpine grasslands. Applied Vegetation Science 21:647–57. doi:10.1111/avsc.12389.
- Petraglia, A., M. Tomaselli, M. Petit Bon, N. Delnevo, G. Chiari, and M. Carbognani. 2014. Responses of flowering phenology of snowbed plants to an experimentally imposed extreme advanced snowmelt. Plant Ecology 215 (7):759–68. doi:10.1007/s11258-014-0368-1.
- Petrone, K., I. Buffam, and H. Laudon. 2007. Hydrologic and biotic control of nitrogen export during snowmelt: A combined conservative and reactive tracer approach. Water Resources Research 43 (6). doi: 10.1029/2006WR005286.
- Phillips, A. J., and N. K. Newlands. 2011. Spatial and temporal variability of soil freeze-thaw cycling across Southern Alberta, Canada. Agricultural Science 2 (4):392–405. https://doi.org/10.4236/as.2011.24051.
- Pignatti, S., P. Menegoni, and S. Pietrosanti. 2005. Biondicazione attraverso le piante vascolari. Valori di indicazione secondo Ellenberg (Zeigerwerte) per le specie della Flora d’Italia. Camerino: Braun-Blanquetia.
- Pintaldi, E., M. E. D’Amico, C. Siniscalco, E. Cremonese, L. Celi, G. Filippa, M. Prati, and M. Freppaz. 2016. Hummocks affect soil properties and soil-vegetation relationships in a subalpine grassland (North-Western Italian Alps). Catena 145:214–26. doi:10.1016/j.catena.2016.06.014.
- Pintaldi, E., D. Viglietti, M. E. D’Amico, A. Magnani, and M. Freppaz. 2019. Abiotic parameters and pedogenesis as controlling factors for soil C and N cycling along an elevational gradient in a subalpine larch forest (NW Italy). Forests 10:614. doi:10.3390/f10080614.
- Pittarello, M., M. Probo, M. Lonati, and G. Lombardi. 2016. Restoration of sub-alpine shrub-encroached grasslands through pastoral practices: Effects on vegetation structure and botanical composition. Applied Vegetation Science 19:381–90. doi:10.1111/avsc.12222.
- Post, E., and C. Pedersen. 2008. Opposing plant community responses to warming with and without herbivores. PNAS 105 (34):12353–58. doi:10.1073/pnas.0802421105.
- Prevéy, J. S., C. Rixen, N. Rüger, T. T. Høye, A. D. Bjorkman, I. H. Myers-Smith, and S. Wipf. 2019. Warming shortens flowering seasons of tundra plant communities. Nature Ecology & Evolution 3 (1):45–52.
- Quaglia, E., S. Ravetto Enri, E. Perotti, M. Probo, G. Lombardi, and M. Lonati. 2020. Alpine tundra species phenology is mostly driven by climate-related variables rather than by photoperiod. Journal of Mountain Science 17:2081–96. doi:10.1007/s11629-020-6079-2.
- R Core Team. 2019. R: A language and environment for statistical computing. Vienna, Austria: R Foundation for Statistical Computing. http://www.r-project.org/
- Robbins, J. A., and J. A. Matthews. 2014. Use of ecological indicator values to investigate successional change in boreal to high-alpine glacier-foreland chronosequences, southern Norway. The Holocene 24 (11):1453–64. doi:10.1177/0959683614544067.
- Rui, Y., S. Wang, Z. Xu, Y. Wang, C. Chen, X. Zhou, X. Kang, S. Lu, Y. Hu, and Q. Lin. 2011. Warming and grazing affect soil labile carbon and nitrogen pools differently in an alpine meadow of the Qinghai–Tibet Plateau in China. Journal of Soils and Sediments 11:903. doi:10.1007/s11368-011-0388-6.
- Ryser, P., and P. Urbas. 2000. Ecological significance of leaf life span among Central European grass species. Oikos 91 (1):41–50. doi:10.1034/j.1600-0706.2000.910104.x.
- Schaffers, A. P., and K. V. Sýkora. 2000. Reliability of Ellenberg indicator values for moisture, nitrogen and soil reaction: A comparison with field measurements. Journal of Vegetation Science 11 (2):225–44. doi:10.2307/3236802.
- Schöb, C., P. M. Kammer, P. M. Z. Kikvidze, P. Choler, and H. Veit. 2008. Changes in species composition in alpine snowbeds with climate change inferred from small-scale spatial patterns. Web Ecology 8:142–59. doi:10.5194/we-8-142-2008.
- Schuur, E. A. G., J. Bockheim, J. C. Canadel, E. Euskirchen, C. B. Field, S. V. Goryachkin, S. Hagemann, et al. 2008. Vulnerability of Permafrost Carbon to Climate Change: Implications for the Global Carbon Cycle. BioScience 58 (8):701–14. doi:10.1641/B580807.
- Scott, D., and W. S. Billings. 1964. Effects of environmental factors on standing crop and productivity of an alpine tundra. Ecological Monographs 34:243–70.
- Semenchuk, P. R., B. Elberling, C. Amtorp, J. Winkler, S. Rumpf, A. Michelsen, and E. J. Cooper. 2015. Deeper snow alters soil nutrient availability and leaf nutrient status in high Arctic tundra. Biogeochemistry 124 (1):81–94. doi:10.1007/s10533-015-0082-7.
- Semenchuk, P. R., B. Elberling, and E. J. Cooper. 2013. Snow cover and extreme winter warming events control flower abundance of some, but not all species in high Arctic Svalbard. Ecology and Evolution 3 (8):2586–99. doi:10.1002/ece3.648.
- Serquet, G., C. Marty, and M. Rebetez. 2013. Monthly trends and the corresponding altitudinal shift in the snowfall/precipitation day ratio. Theoretical and Applied Climatology 114:437–44. doi:10.1007/s00704-013-0847-7.
- Stanton, M. L., M. Rejmanek, and C. Galen. 1994. Changes in vegetation and soil fertility along a predictable snowmelt gradient in the Mosquito Range, Colorado, USA. Arctic and Alpine Research 26:364–74. doi:10.1080/00040851.1994.12003081.
- Stark, J. M., and M. K. Firestone. 1995. Mechanisms for soil moisture effects on activity of nitrifying bacteria. Applied Environmental Microbiology 61 (1):218–21.
- Szymura, T. H., M. Szymura, and A. Maciol. 2014. Bioindication with Ellenberg's indicator values: A comparison with measured parameters in Central European oak forests. Ecological Indicators 46:495–503. doi:10.1016/j.ecolind.2014.07.013.
- Tasser, E., and U. Tappeiner. 2005. New model to predict rooting in diverse plant community compositions. Ecological Modelling 185:195–211. doi:10.1016/j.ecolmodel.2004.11.024.
- Thornton, J. M., E. Palazzi, N. C. Pepin, P. Cristofanelli, R. Essery, S. Kotlarski, G. Giuliani, Y. Guigoz, A. Kulonen, D. Pritchard, et al. 2021. Toward a definition of essential mountain climate variables. One Earth 4 (6):805–27. doi:10.1016/j.oneear.2021.05.005.
- Tian, L., L. Zhao, X. Wu, H. Fang, Y. Zhao, G. Yue, and H. Chen. 2017. Vertical patterns and controls of soil nutrients in alpine grassland: Implications for nutrient uptake. Science of the Total Environment 607–608:855–64. doi:10.1016/j.scitotenv.2017.07.080.
- Tierney, G. L., T. J. Fahey, P. M. Grossman, J. P. Hardy, R. D. Fitzhugh, and C. T. Driscoll. 2001. Soil freezing alters fine root dynamics in a northern hardwood forest. Biogeochemistry 56:175–90. doi:10.1023/A:1013072519889
- Vestgarden, L. S., and K. Austnes. 2009. Effects of freeze-thaw on C and N release from soils below different vegetation in a montane system: A laboratory experiment. Global Change Biology 15:876–87. doi:10.1111/j.1365-2486.2008.01722.x.
- Viglietti, D., M. Freppaz, G. Filippa, and E. Zanini. 2014. Soil C and N response to changes in winter precipitation in a subalpine forest ecosystem, NW Italy. Hydrological Processes 28 (21):5309–21. doi:10.1002/hyp.10008.
- Walker, D. A. 2000. Hierarchical subdivision of Arctic tundra based on vegetation response to climate, parent material and topography. Global Change Biology 6:19–34. doi:10.1046/j.1365-2486.2000.06010.x.
- Walker, D. A., J. C. Halfpenny, M. D. Walker, and C. A. Wessman. 1993. Long-term studies of snow-vegetation interactions. BioScience 43:287–301. doi:10.2307/1312061.
- Walker, D. A., W. B. Krantz, E. T. Price, B. E. Lewis, and R. D. Tabler. 1994. Hierarchic studies of snow-ecosystem interactions: A 100 year snow alteration experiment. Proceedings of the 50th Eastern Snow Conference, 407–14.
- Wang, X., S. Dong, Q. Gao, H. Zhou, S. Liu, X. Su, and Y. Li. 2014. Effects of short-term and long-term warming on soil nutrients, microbial biomass and enzyme activities in an alpine meadow on the Qinghai-Tibet Plateau of China. Soil Biology and Biochemistry 76:140–42. doi:10.1016/j.soilbio.2014.05.014.
- Westergaard-Nielsen, A., T. Balstrøm, U. A. Treier, S. Normand, and B. Elberling. 2020. Estimating meltwater retention and associated nitrate redistribution during snowmelt in an Arctic tundra landscape. Environmental Research Letters 15 (3):034025.
- Wijk, S. 1986. Performance of Salix herbacea in an alpine snow-bed gradient. Journal of Ecology 74 (3):675–84. doi:10.2307/2260390.
- Wilson, G., M. Green, J. Brown, J. Campbell, P. Groffman, J. Durán, and J. Morse. 2020. Snowpack affects soil microclimate throughout the year. Climatic Change 163 (2):705–22. doi:10.1007/s10584-020-02943-8.
- Wookey, P. A., R. Aerts, R. D. Bardgett, F. Baptist, K. A. Brathen, J. H. C. Cornelissen, L. Gough, et al. 2009. Ecosystem feedbacks and cascade processes: Understanding their role in the responses of Arctic and alpine ecosystems to environmental change. Global Change Biology 15(5):1153–72. doi:10.1111/j.1365-2486.2008.01801.x.
- Zuur, A., E. N. Ieno, N. Walker, A. A. Saveliev, and G. M. Smith. 2009. Mixed effects models and extensions in ecology with R. New York: Springer.