
ABSTRACT
The Landsort Deep is the deepest part of the Baltic Sea and contains an excellent high-resolution late Pleistocene sediment record suitable to study the retreat history of the southern margin of the Fennoscandian Ice Sheet and the development of the ice-marginal Baltic Ice Lake (BIL) from ~13.5 to 10.5 ka BP. The studied cores are from the lithostratigraphic Units V and VI of Hole M0063C that were recovered during the Integrated Ocean Drilling Program (IODP) Expedition 347. The subdivision and interpretation of the studied BIL record are based on the identification of seven distinct sedimentary facies, grain size characteristics, detrital clay minerals, water and carbon content, and physical properties. The ice-rafted debris (IRD) in the lowermost part of Unit VI indicates a proximal glaciolacustrine environment. The onset of the Fennoscandian Ice Sheet deglaciation during the warm Bølling/Allerød interstadial caused a rise of the proglacial lake water level and the transition from ice-proximal (IRD-containing sediments) to ice-distal varved sediments (rhythmically laminated silty clays) detected within the middle part of Unit VI. This depositional unit of constant sedimentation was followed by the first drainage event of the BIL, which led to the deposition of a distinct clay-rich interval representing erosion and redeposition of the emerged lake bottom sediments. The reduced grain size of the overlying sediments is associated to the onset of cooler climate conditions and a possible ice sheet readvance during the Younger Dryas that resulted in a decrease of meltwater release and sediment availability. The higher sand content and kaolinite peak are associated to a rapid ice retreat and the release of abundant sediment laden meltwater plumes at the end of the Younger Dryas. The final drainage of the BIL enabled the erosion of coastal clay sediments, and the termination of the ice lake stage led to enhanced clay sedimentation to the Landsort Deep.
Introduction
The location of the Baltic Sea Basin (BSB) in a formerly glaciated latitude in the Northern Hemisphere has led to very dynamic development of the basin during its geological history. The BSB sediments provide a record of the waxing and waning of the Fennoscandian Ice Sheet (FIS). The recurring glaciations repeatedly covered the whole basin or parts of it, and subsequent deglaciations led to widely differential impacts and uplift in the Baltic Sea (BS) region.
The Landsort Deep (LD) is the deepest part (459 m) of the BS and is located just south of the postulated Weichselian Ice Sheet margin. The LD contains a high-resolution sediment sequence from late Pleistocene to Holocene (Andrén et al. Citation2015a) recording the variations of salinity in the BSB, which enabled the identification of four major stages in its history: Baltic Ice Lake (BIL), Yoldia Sea, Ancylus Lake, and Littorina Sea (Böttcher and Lepland Citation2000).
The stratification of the water column of a glacial lake can usually be related to sedimentation processes controlled by sediment-laden meltwater overflows and direct deposition in the front of glacier terminus. The indicators of rain-out from possible icebergs or lake ice and occasional resedimentation by mass flows and bottom currents that may disturb the depositional sequence are recognized and considered in the age–depth model illustrated in this research. The aim of this research is to increase our knowledge of the periodicity and effects of meltwater sediment supply and deposition in an ice-contact lake during the evolution of the BIL from ~13.5 to 10.5 ka BP in the LD area. The sedimentary lithofacies and clay mineral determination of this research enable more detailed interpretation of the depositional events and environments of the sediments. The objective is also to outline the evidences of ice sheet melting and/or lake drainage events associated to warm periods, including the Bølling/Allerød interstadial (~14.7–12.7 ka BP), and to evaluate the sedimentological evidences of the Younger Dryas stadial (~12.7–11.7 ka BP) recorded in the LD sediment sequence.
The studied cores are from Site M0063 of the Integrated Ocean Drilling Program (IODP) Expedition 347 (Andrén et al. Citation2015). This multiproxy approach includes lithostratigraphic and sedimentary facies analyses, as well as grain size and clay mineral analyses and loss on ignition (LOI550) determination. The new data were combined with the physical properties data set and carbon content acquired during the expedition for the interpretation of the modality of deglaciation and for the determination of the environmental change in the central BSB during its last glacial lake phase.
Regional and geological setting
The Baltic Sea Basin
The BS is a shallow inland sea consisting of several subbasins (). According to Kaskela et al. (Citation2012), the BS bedrock comprises Proterozoic crystalline basement rocks (). Sedimentary rocks are present in the southern areas, in the Gulf of Finland, and in tectonic depressions in the Bothnian Bay and central Bothnian Sea. The bedrock is divided into blocks by several fracture zones and ancient tectonic lineaments. The most notable features are probably the preglacial depressions and troughs. The strong variability in bedrock lithology and the distribution of deformable Quaternary sediments made the Baltic region favorable for the development of a thin and mobile ice sheet (Lambeck, Smither, and Johnston Citation1998). The BS is connected to the North Atlantic through the narrow and shallow straits between Denmark and Sweden, which are responsible for a restricted water exchange. Intensive water-level fluctuations characterized the different stages of the BS, and the subdivision into four different stages is related to the water exchange between the BS and the world ocean (Lepland and Stevens Citation1998). River discharge and meltwater caused the water-level and glacio-isostatic uplift balance to rise, which led either to a temporary connection between the BSB and the world ocean or to the isolation of the BSB (Lambeck, Smither, and Johnston Citation1998).
Figure 1. (a) Map of the study area in the Baltic Sea (Bathymetry Database v0.9.3 by Hell and Öiås Citation2014). The black rectangle indicates the location of the insert showing detailed location of Site M0063 in the Landsort Deep. The present surface water circulation (gray arrows) and deeper circulation (light gray arrows) are redrawn from Larsson et al. (Citation2017). (b) Pre-Quaternary geology of the Baltic Sea region (modified from Rosentau et al. Citation2017).
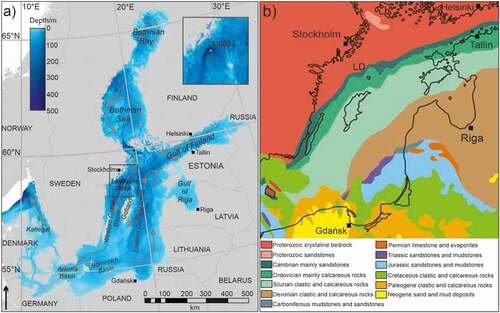
The Landsort Deep
The LD is the deepest part of the Baltic Sea (up to 459 m) and is located in the northwestern part of the Gotland basin between the southeast coast of Sweden and the island of Gotland (). It is a crescent-shaped depression with very steep walls (Myrberg, Leppäranta, and Kuosa Citation2006), with a maximum width of 3.2 km and length of 20 km. The LD is located along a major fault line that is deepened by glacial erosion (Lepland and Stevens Citation1998). The geometry of the deep shields the deposited sediments, preventing their erosion during subsequent glacial expansion (Andrén et al. Citation2015). The halocline of the water column is at about 50 to 80 m.b.s.l., separating the surface waters with a salinity of 7–8 per mill from the bottom water’s salinities of 8–13 per mill (e.g., Lepland and Stevens Citation1998; Böttcher and Lepland Citation2000). The present water column is stratified into three different zones: oxic, suboxic, and anoxic (Berndmeyer et al. Citation2014). This vertical oxygen zonation is driven by the limited inflow of oceanic water, the salinity of the water column, and oxygen depletion in the bottom waters resulting from the great depth of the LD (Böttcher and Lepland Citation2000; Myrberg, Leppäranta, and Kuosa Citation2006). The high sedimentation rate of the deep has varied between 100 and 650 cm kyr–1 from 11.0 ka BP ago to the present day (Obrochta et al. Citation2017). Sediments of the deep display the transition from organic-poor glacial clay deposits to organic-rich Holocene clay deposits, which coincides with the changeover from glacial to interglacial and from freshwater to brackish marine conditions (Andrén et al. Citation2015a).
The existing knowledge of the Baltic Ice Lake evolution
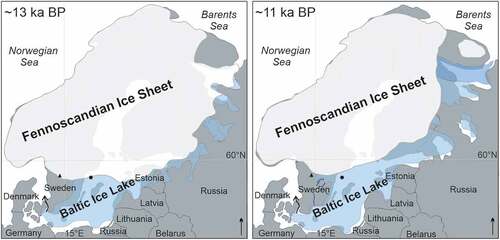
Three ice margin fluctuations of the southeastern margin of the FIS are identified between 25.0 ka BP and 12.0 ka BP (Rinterknecht et al. Citation2006). Deglacial millennial-scale climate variability, along with its effect on surface mass balance, had a strong influence on the rates of the FIS margin retreat (Cuzzone et al. Citation2016). The ice margin advanced and reached the largest extent in the Baltic region ca. 20 to 19 ka BP (Hughes et al. Citation2016; Stroeven et al. Citation2016). The first phase of the BIL formed at ca. 16.0 ka BP (Houmark-Nielsen and Kjær Citation2003). The BIL surface was most likely at sea level during its initial stage and damming of the lake possibly started due to the uplift of the Öresund threshold area, which is currently a strait between Sweden and Denmark (), and as it rose, the lake level also rose above sea level ca. 14.0 ka BP (Andrén et al. Citation2011). The BIL captured meltwater from the retreating ice sheet and the drainage of most river systems from Europe and western Russia (Patton et al. Citation2017). Andrén et al. (Citation2011) concluded that the first drainage of the BIL is estimated to have taken place ~13.0 ka BP due to the altitudinal difference between the gradually rising sea and the level of the BIL. The drainage was possibly caused by the ice recession at Mt. Billingen () and in the northern part of the south Swedish highlands. The deglaciation of the Baltic region and the main retreat of the ice sheet occurred between ~14.0 and 11.0 ka BP. At the time of the Younger Dryas cooling at ca. 12.7 ka BP, the ice sheet readvanced, blocking the northern drainage of the BIL, which led to transgression (Andrén et al. Citation2011). The final drainage of the BIL is estimated to have occurred at ~11.7 ka BP (Andrén et al. Citation2015) when a new draining point opened in south central Sweden (Bergsten and Nordberg Citation1992), causing the water level of the BIL to drop ca. 25 m down to sea level (Andrén et al. Citation2011). This final drainage had a great impact on the environment, including changes in fluvial drainage, reworking of sediments, and exposure of large coastal areas (Andrén et al. Citation2011).
Figure 2. Evolution of the Baltic Ice Lake and decay of the Fennoscandian Ice Sheet at ~13.0 and 11.5 ka BP. Source: Kallio (Citation2006), by M. Saarnisto/Geological Survey of Finland. Black dot marks the location of the Landsort Deep, black triangle marks Mt. Billingen, and black arrow marks the Öresund strait. The contemporary continental rivers (blue lines) are redrawn from Patton et al. (Citation2017).
Materials and methods
Site M0063
Five holes were drilled at Site M0063 (58°37.34′ N, 18°15.25′ E, water depth 437 m) in the LD during the IODP Expedition 347 “Baltic Sea Paleoenvironment” in 2013 (Andrén et al. Citation2015). The studied cores were recovered from Hole M0063C (), which is divided into seven (I–VII) lithostratigraphic units, and the samples for this contribution derive from Unit V (47.80–51.15 mbsf) and Unit VI (51.15–92.16 mbsf). The physical parameters, which include gamma wet bulk density and low-field volumetric magnetic susceptibility (MS), were measured from the core sections shortly after their recovery with an automated GEOTEK Multi-Sensor Core Logger.
Obrochta et al. (Citation2017) calculated a new nonoverlapping depth scale for each hole, expressed as adjusted meters below seafloor (ambsf). The ambsf depth scale took account of the expansion that the cores experienced due to degassing during decompression. This adjusted meter scale was applied for the depths of the samples investigated in this study.
Facies analysis
Trends in changes of lithology, sedimentary structures and grain size were used to identify sedimentary lithofacies within the lithostratigraphic Units V and VI. Facies analysis is a method applied to trace the vertical character of the recovered sequence and interpret depositional processes, events, and environments (cf. Miall Citation2022).
Grain size analysis
The grain size analysis for the seventy-six samples (size 2 cm; interval ~50 cm throughout the sequence) was done by using the Malvern Mastersizer 2000 G laser diffractometer device at the Department of Geosciences and Geography, University of Helsinki, Finland. Before each analysis, the samples were treated with 10 mL hydrogen peroxide (H2O2; 30 percent) and 10 mL of hydrochloric acid (HCl; 0.5 N) overnight to remove organic matter and biogenic carbonate, respectively. Furthermore, the samples were chemically treated with 300 mg of sodium pyrophosphate (Na4P2O7) to prevent the particles from flocculating. The samples were also mechanically treated with 10 µm amplitude ultrasound for 30 seconds before measurements. Each sample was measured three times maintaining the setting of 750 rpm stirrer speed and 2,000 rpm pump speed. The analysis of grain size statistics was calculated using GRADISTAT software (Blott and Pye Citation2001).
Water and carbon content determination
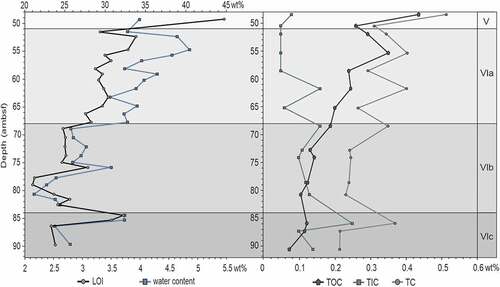
Loss on ignition (LOI) is an analytical method used to estimate the relative organic matter and water content of sediments. The twenty-nine samples were studied with the LOI550 method at the Department of Geosciences and Geography, University of Helsinki. The samples were selected from the seventy-six samples studied for the grain size analysis. Ceramic crucibles were weighed empty and with the samples to calculate the sample weight (3–4 g). The samples were dried in an oven at 105°C overnight to remove pore water from the samples and then cooled in a desiccator. Dried samples and the crucibles were weighted again to determine the sediment water content and then placed in a muffle furnace and kept at 550°C for 2 hours. The samples were cooled in a desiccator and weighted to determine the weight percent of organic matter. The weights of crucibles were subtracted to determine the mass loss, and the values reported as LOI550 percent were calculated using the equation from Heiri, André, and Lemcke (Citation2001).
The total carbon (TC), total organic carbon (TOC), and total inorganic carbon (TIC) values were obtained from the Pangaea data portal (Expedition 347 Scientists Citation2014a) because they were determined during the expedition using a LECO CS-300 Carbon Sulfur Analyzer, following the IODP procedures (Andrén et al. Citation2015b). For the measurement of the TC, ~65 mg of the sample was weighed and heated in a furnace and the CO2 produced was measured with a nondispersive infrared detector. The sediments were decalcified with 12.5 percent HCl to remove the carbonates and reanalyzed with the same method to determine the TOC content, whereas the TIC content was determined by the difference between TC and TOC. The data are reported in weight percent (wt%) of dry sample with an analytical precision <3 percent absolute based on replicate sample analyses.
Clay mineralogy
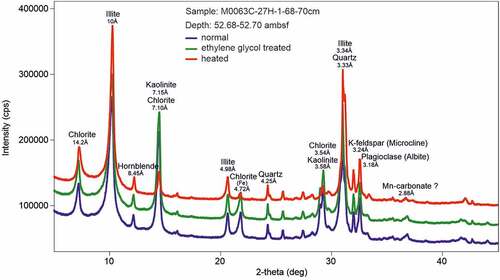
The clay mineral assemblage and the content of quartz and feldspar in the clay fraction was determined with powder X-ray diffraction (XRD) on twenty-four oriented clay samples at the Center for Material Analysis, University of Oulu, Finland. The selected samples were from the same depths as the samples used for the LOI550 determination. About 3 g of each sample was placed in a tube, dissolved in distilled water, and centrifuged for 1 minute at 1,000 rpm to separate the clay-sized fraction (<2 µm) remaining in suspension from the silt and sand fraction that settle in the tube. The clay suspension was then transferred to another tube with the addition of distilled water and centrifuged for 15 minutes at 1,000 rpm for the clay to settle. The clay fraction was wet-smeared on glass slides (three slides per sample). One slide was dried for 2 hours at 60°C. A second slide was heated first at 60°C for 2 hours and then at 550°C for 2 hours to disintegrate kaolinite and certain chlorites. The third slide was solvated with ethylene glycol overnight at 60°C in vacuum conditions. This treatment expands the smectite from 15 Å to a basal spacing of 17 Å for a better evaluation of the smectite peak. Oriented clay mineral mounts were measured on a Rigaku SmartLab 9 kW XRD system with cobalt radiation with 40 kV and 135 mA settings and Bragg-Brentano para-focusing geometry (300-mm goniometer). Slits were 5° in both source and analyzer, and a 0.5° incident slit was used to limit the beam divergence. Acquisition speed was 4° per minute with a step of 0.02°. The diffractometer system was controlled by SmartLab Guidance software (Rikagu Ltd., Tokyo, Japan). For semiquantitative estimation of clay mineral abundances, a PDXL2 software suite with integrated access to the ICDD PDF-4 + 2020 database of powder diffraction patterns was used.
The main four investigated clay minerals, when untreated, have basal spacings at 7.15 Å (kaolinite, chlorite), 10 Å (illite), 14.1 Å (chlorite), and 15 Å (smectite), and they reflect the climate conditions in the source area during weathering, the character of the source materials, and sediment transport and deposition. The determination of the kaolinite–chlorite ratio reflects a mixing row of a two end-member system mainly caused by sediment resuspension and lateral transport processes from the coastal zones toward the depositional site (Leipe and Gingele Citation2003). The quartz–feldspar ratio was also determined because it represent the detrital components of glacial sediments in comparison to reworked terrestrial materials (cf. Emel’yanov and Luksha Citation2014).
Existing age constrains applied in this study
The ice recession and the first drainage of the BIL are estimated to have taken place at ~13.5 to 13.0 ka BP according to Andrén et al. (Citation2011) and Björck (Citation1995). The inferred age of the onset of deglaciation of the LD is ~13.5 ka BP (Hughes et al. Citation2016; Stroeven et al. Citation2016; Obrochta et al. Citation2017). The reconstruction of the BIL by Vassiljev and Saarse (Citation2013) indicates that the LD was fully deglaciated at ~12.2 ka BP, and the water level at ice margin was up to 140 to 150 m.a.s.l. Distinct pollen types at ~66 mbsf might imply a pre-Holocene age for that spectrum, and it could also be related to the Bølling/Allerød interstadials (Andrén et al. Citation2015a). A previously dated pollen spectrum typical at 11.0 to 10.5 ka BP was found at ~56.8 mbsf, suggesting a correlative age for the sediments (Andrén et al. Citation2015a).
Results
Lithostratigraphy
The description of the main lithologies of Units V and VI is based on Andrén et al. (Citation2015a) and visual images from Expedition 347 Scientists (Citation2014b). The over 40-m-thick Unit VI overlies the diamict of Unit VII. The lowermost part of Unit VI has an increased grain size and frequent well-sorted sand laminae with a gradational lower boundary and dispersed clasts of subangular sand and centimeter-scale pebble grains (). There are several distinct upward-fining sandy silt–clay couplets present, as well as individual millimeter-scale sand laminae in the lower part of Unit VI. Brown/reddish clay–silt–sand interlaminaes in thicker units, massive structures, and clay laminaes with occasional internal slumping are common up to ~85 mbsf (). Centimeter-scale carbonate concretions () within laminated silty clay occur upward from ~75 mbsf. The uppermost part of the unit contains homogeneous dark gray-brown clay interbeds and millimeter-scale silt interlaminaes. The overlying Unit V is composed of dark gray to grayish brown very well sorted clay with internal structures of massive appearance as well as contorted silt laminated intervals with convolute bedding. The laminated clay is displaced by microscale faults in the lower parts of the unit ().
Figure 3. Core images representing the main lithologies of Units V and VI: (a) brownish/reddish sandy silt with slightly disturbed laminated structures (347-M0063C-38-2, 89–90.5 mbsf); (b) silt–clay with sandy interlaminaes and massive structures (347-M0063C-37-2, 85.7–87.2 mbsf; (c) clay and silt with coarser interlaminaes (347-M0063C-36-1, 80.9–82.4 mbsf); (d) interlaminated silt and clay, slightly disturbed, carbonate concretion (347-M0063C-33-2, 72.5–74 mbsf); (e) silty clay laminated by color and grain size (347-M0063C-30-2, 62.6–64.1 mbsf); (f) silty clay, homogeneous gray clay interbeds (347-M0063C-27-1, 52.6–54.1 mbsf); (g) dark gray/grayish brown silty clay, contorted silt laminaes, convolute bedding, slumping (347-M0063C-25-2, 48.6–50 mbsf); (h) dark gray clay (347-M0063C-24-2, 47.4–48.6 mbsf). Images downloaded from the Pangaea data portal (Expedition 347 Scientists Citation2014b).
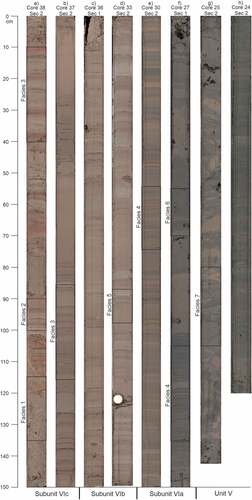
In this research, Unit VI is divided into three subunits: VIc (84–92.16 ambsf), VIb (68–84 ambsf), and VIa (51.15–68 ambsf). The division is based on visual core descriptions, consideration of the sedimentary facies, variations in sediment grain size characteristics and clay mineral assemblages, and changes in the physical property and water and carbon content trends.
Facies description
The genetic facies-level approach made it possible to establish depositional trends and environments of the studied sediments (). Each facies represent an individual depositional event related to the BIL evolution and can be interpreted in terms of its hydrodynamic origin. Facies 1 (; ) represents disorganized fine-grained sandy–silty clay with dispersed sand clasts occurring in the lowermost part of the studied sediment sequence. The fine sand and silt planar laminaes of Facies 2 (; ) with a thickness of 1 to 5 mm occur in the lower part of the sequence; for example, around 90 ambsf in Subunit VIc. Facies 3 represents sandy silt–clay couplets with thicknesses of 30 to 60 mm (; ) and 10 to 30 mm (; ) are present, for instance, in Subunit VIc between 87 and 88.6 ambsf. These rhythmically laminated couplets compose of a basal sandy silt, laminated sandy–silt portions, and faintly laminated to massive clay top, as well as subangular sand and few dispersed centimeter-scale clasts. Facies 4 comprises silt–clay couplets with a thickness of 20 to 30 mm with lighter colored silty portions (; ) and with a couplet thickness of 5 to 20 mm whose boundaries can be diffuse, and darker colored clay portions are thick and massive (; ). These rhythmically laminated couplets are present, for example, at ~63 and ~53 ambsf in Subunit VIa. The fine-grained silty clay of Facies 5 (; ) is irregularly laminated or structureless and shows very thin silt laminae (1–2 mm). The winnowed lamination of Facies 5 occurs, for example, at ~73.4 ambsf in Subunit VIb. The massive, partly mottled gray clay of Facies 6 (; ) appears, for example, at ~52.5 ambsf in Subunit VIa. The deformed fine-grained clay to silty clay of Facies 7 occurring particularly in Unit V shows soft sediment folds, microfaulting, convolute bedding, and slumping (; ).
Figure 4. Representative images of sedimentary lithofacies from Units V and VI: (a) disorganized sandy–silty clay (diamict), interval 347-M0063C-38-2, 115 to 135 cm; (b) laminated fine sand and silt (Facies 2), sandy planar laminae indicated with black thin arrows, interval 347-M0063C-38-2, 90 to 100 cm; (c) sandy silt/clay couplets (Facies 3) with thickness of 30 to 60 mm, boundaries indicated with black arrows, interval 347-M0063C-38-2, 10 to 40 cm; (d) sandy silt–clay couplets (Facies 3) with thickness of 10 to 30 mm, boundaries indicated with black arrows, interval 347-M0063C-37-2, 85 to 115 cm; (e) silt–clay couplets (Facies 4) with thickness of 20 to 30 mm, light colored silty portions are laminated, boundaries indicated with black arrows, interval 347-M0063C-30-2, 55 to 75 cm; (f) silt–clay couplets (Facies 4) with thickness of 5 to 20 mm, couplet boundaries (indicated with black arrows) can be diffuse and darker colored clay portions become thicker and massive, interval 347-M0063C-27-1, 105 to 135 cm; (g) laminated to massive silty clay (Facies 5), silty laminae indicated with black thin arrows, interval 347-M0063C-33-2, 87 to 97 cm; (h) faintly laminated clay (Facies 6), interval 347-M0063C-27-1, 55 to 70 cm; (i) deformed clay to silt–clay (Facies 7), microscale transverse fault indicated with black thin arrow, interval 347-M0063C-25-2, 80 to 105 cm. Images downloaded from the Pangaea data portal (Expedition 347 Scientists Citation2014b).
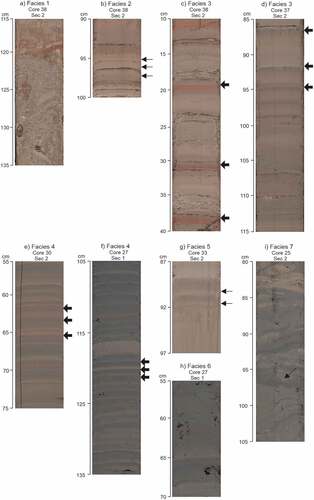
Table 1. Summary of the sedimentary lithofacies types used for the Landsort Deep sediments.
Sedimentary and mineralogical characterization
Subunit VIc (84–92.16 ambsf)
Description
Massive brownish/reddish disorganized sandy–silty clay with subangular sand clasts (diamict) occurs between 92.16 and 90.8 ambsf (Facies 1; ), in addition to frequent sand laminations and increased grain size, with individual dispersed sand grains, between 90 and 87.5 ambsf. According to Kelly and Passhier (Citation2018), the larger clasts are subangular to subrounded red sandstones, dark fine-grained amphibolite, and biotite gneiss. The well-sorted sand and silt couplets with slightly disturbed laminated structures (Facies 2; ) and the rhythmically deposited sandy silt–clay couplets composed of basal laminated sandy silt and structureless to faintly laminated clay top (Facies 3; ) comprise most of Subunit VIc. The thickness of the coupled lithology varies between 10 to 60 mm. The sediments of Subunit VIc are dominated by silt with values of 67 to 85 percent, and the clay content varies between 14 and 33 percent. The sand content has a maximum percentage of 4 percent, and the percentage of very coarse sand is 1 to 2 percent at 86.75 ambsf (). The highest values of density (up to 2.28 g/cm3) and wide variations in MS characterize this subunit (). There is a notable negative excursion in density at 90.5 ambsf and a peak of higher value of MS at ~91 ambsf. The clay mineral assemblage from the base of the subunit up to 85 ambsf is dominated by illite that decreases upward, whereas both kaolinite and chlorite increase upward (). From ~85 ambsf upward, illite increases and kaolinite and chlorite decrease, with a contemporaneous change of the quartz–feldspar ratio with an increase in the quartz content. This trend corresponds also with an increase in water and carbon content ().
Figure 5. Sand, silt, and clay content (vol%) of the studied samples from various depths from Units V and VI. Grain size of <2 µm is classified as clay, 2 to 63 µm, is silt and >63 µm is sand. Gamma wet bulk density and magnetic susceptibility values data from the Pangaea data portal (Expedition 347 Scientists Citation2014b).
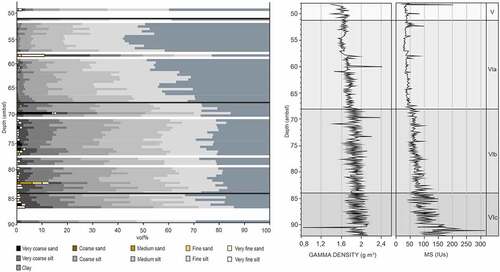
Figure 6. Clay mineral distribution and kaolinite–chlorite and quartz–feldspar ratios of the studied samples from Units V and VI.
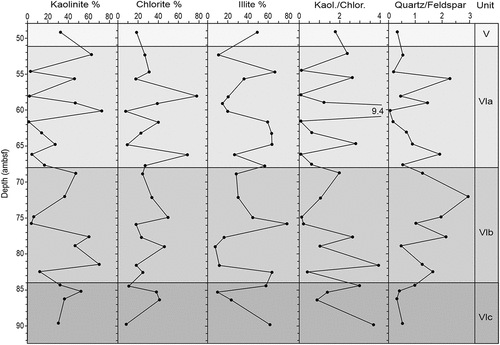
Figure 7. Water and carbon content from Units V and VI. Data for total organic carbon (TOC), total inorganic carbon (TIC), and total carbon (TC) from the Pangaea data portal (Expedition 347 Scientists Citation2014b). LOI = Loss on ignition.
Interpretation
The occurrence of frequent sand laminations and generally coarser grain sizes, with isolated pebble and sand grains, indicates an ice-proximal glaciolacustrine environment. The poorly sorted, massive sandy diamictic sediments in the lowermost part of this subunit indicates deposition close to the ice sheet margin. This kind of sediment is deposited by meltout release of basal debris from relatively stagnant ice, a situation identified also by Streuff et al. (Citation2017) and Björck and Möller (Citation1987). In this context, the presence of pebbly sand is an indication of ice rafting (ice-rafted debris). The presence of lithic fragments and larger detritus is responsible for the higher density values (i.e., MacLeod, Osborn, and Spooner Citation2006), and increased input of terrigenous sandy material in meltwater pulses can cause an increase in density (Harff et al. Citation2011), as seen in the higher density values of this subunit. The correlative shifts in MS values can also be related to grain size variation. The notable peaks in density and MS are most likely due to distortion of the sediments (cf. Andrén, et al. Citation2015a). A peak in water content at ~85 ambsf and the increase in TIC content are possibly due to formation of various precipitates.
The rhythmic parallel laminated sediments of Facies 2 are characteristic of the lake bottom deposits and indicate that the retreat of the ice sheet was relatively continuous. The interlaminaes of more sorted lake underflow deposits are synsedimentary with clayey meltout deposits of Facies 3, and these couplets represent proximal varves. Multiple intervals of graded 3- to 5-mm-thick laminae within coarser light-colored sediments represent pulses of meltwater inflow. According to Ashley (Citation2002), a coarse–fine couplet usually represents an annual deposit with sharp contact between the coarser sediments deposited prior to and during the overturn of the water column and the finer sediments deposited after the overturn. The proximal depositional successions contain varves representing multiple summer melt events that are interbedded with episodic underflows. Rhythmically laminated silt and clay overlying the ice-contact facies are very often related to seasonal fluctuations in meltwater discharge in an ice-contact lake (Ridge et al. Citation2012); however, slump-generated underflows may complicate the rhythmicity of the lake bottom sedimentation. High percentages of illite, high kaolinite–chlorite ratios, and low quartz–feldspar ratios in the lowermost part of this subunit are characteristic of the local glacial sources. According to Gingele and Leipe (Citation1997), the low quartz–feldspar ratios are characteristic of unweathered crystalline source rocks.
Subunit VIb (68–84 ambsf)
Description
The sediments in Subunit VIb are dominantly interlaminated silt and clay with slightly disturbed laminated structures (Facies 4; ). Mostly brown and weak red colored sandy silt-clay interlaminations (Facies 3; ) are present upward from ~84 ambsf. The clay content varies between 15 and 33 percent and silt content varies between ~60 and 80 percent. The sand content is generally <5 percent; however, there are notable peaks with a concentration of 16 percent at 82.45 and 13 percent at 70.33 ambsf (). The density value decreases at ~71 ambsf and increases at ~69.5 ambsf, and the MS values show an upward progressive decreasing trend throughout the subunit (). At the lowermost part of the subunit, water and carbon content have relatively low values, whereas from ~80 ambsf upwards, the values show a general increasing trend, also exceeding the highest values at the uppermost part of the subunit (). Illite is the most abundant clay mineral at the lowermost part of this subunit (). Upward from ~82 ambsf, illite decreases and kaolinite and chlorite increase, and between ~79 and 75.8 ambsf illite is dominant. The kaolinite percentage lowers to <5 percent between 75.8 and 74.9 ambsf, and from thereon it increases. In the uppermost part of the subunit, above 68.8 ambsf, illite increases again and kaolinite decreases. Chlorite content is relatively constant throughout the subunit, on average 35 percent. The ratio of quartz and feldspar fluctuates with an increase in quartz content.
Interpretation
The coarse-grained interlaminated sediments indicating proximal sedimentation are overlaid by finely interlaminated, fine-grained sediments, suggesting a progressive retreat of the glacial margin at the LD. The ice retreat and glacio-isostatic processes allowed the storage of substantial amounts of meltwater in the BIL. The silt–clay couplets are generally complex; show greater variability, particularly in thickness; and contain sharp-based sand laminae indicative of underflows. Local thicker sand laminae (e.g., at ~69 ambsf; ) indicate occasional larger influx of ice sheet outwash. The higher and lower peaks in density can be related to the coarser/finer grain size, respectively, and the upward decreasing MS values could be related to upward decreasing grain size. According to Andrén et al. (Citation2002), slightly increased TOC values can be caused by increased organic production or enhanced preservation of organic carbon in anoxic conditions. This can be the cause of the upward increasing trend of water and carbon content in the subunit and the cause of the color change from brownish to grayish between Subunits VIb and VIa. Before the first drainage, the initial continental rivers draining into the BS in general corresponded to an increase in the kaolinite–chlorite ratios and increased quartz–feldspar ratios (). The increase in the quartz–feldspar ratio is related to the increase in the content of detrital components derived from the reworked continental sediments.
Subunit VIa (51.15–68 ambsf)
Description
The sediments in Subunit VIa consist mainly of brownish silty clay. Mostly structureless parts are present between 67 and 66 ambsf, and massive interbeds of gray clay are present at 64.4 to 64.1 ambsf (Facies 6; ). Silt–clay couplets (Facies 4; ) and laminated silt–clay (Facies 5; ) are present at the uppermost part of this subunit. The clay content is 32 to 55 percent, the silt content is 43 to 70 percent, and the sand content is generally scarce, with peaks at around 60 ambsf with a content of ~2 percent and at ca. 58 ambsf with a content of 10 percent (). There are declines in density at ~65 ambsf and between 57 and 54.5 ambsf and a clear increase at ~60 and 58 ambsf (). The MS values show a slight decrease upward in the subunit. As TOC increases, TIC and TC, as well as water content, fluctuate between 68 and 55 ambsf, and upward from there all values decrease (). Chlorite is a dominant clay mineral in the lowermost part between 68 and 65 ambsf, whereas from 64.8 to 61.6 ambsf illite is the most abundant mineral (). Kaolinite peaks occur at 60.2, 55.7, and 52.3 ambsf, which is an opposite trend in relation to chlorite. In addition, the highest kaolinite–chlorite ratio of 9.4 occurs at 60.2 ambsf. Three peaks of quartz are observed approximately at 66, 59, and 55 ambsf.
Interpretation
The upward decreasing grain size with increasing clay content in Subunit VIa indicates that sediments of Facies 6 were most likely deposited by suspension rainout from the water column in an ice-distal setting, which is comparable to the situation documented by Ridge et al. (Citation2012) and Kelly and Passhier (Citation2018). However, massive structureless parts between 67.7 and 66 ambsf indicate relatively rapid deposition from suspension. The thickness of these sediments varies, which indicates some breaks in constant sedimentation. The clay-rich distal varves of Facies 4 are partly diffuse and were likely deposited from distal meltwater suspension plumes. The decrease in density is related to the absence of sandy material, and the upward decreasing MS values are concordant with the decreasing grain size. The formation and stability of chlorite are usually connected to colder climate; therefore, the increased chlorite value between 68 and 65 ambsf, along with finer grain size might be due to the decrease of sediment availability associated with glacier readvance. Above this interval, the presence of sand at around 60 ambsf and 58 ambsf (~10 percent; ) indicates a rapid ice retreat and active meltwater release. In addition, the increase in density value corresponds with the presence of sandy material. The increase in illite and feldspar contents derives from the previously deposited and reworked clays eroded from the emerged coastal area due to the lake drainage.
Unit V (47.80–51.15 ambsf)
Description
Unit V consists of dark gray to grayish brown silty clay with contorted silt laminae and layers with convolute bedding (Facies 7; ). The bedding is strongly contorted and microfaulted at ~51 ambsf, and there are a few steeply inclined soft sedimentary microfaults at ~50 ambsf. The most abundant grain size fraction in the studied sample from this unit is silt with a content of 60 percent. The clay content is 38 percent and the sand content is 2 percent (). Density decreases at a few points in relation to increased MS values (), and water and carbon contents increase upward the unit (). The main component of the clay mineral assemblage is illite (50 percent), whereas the kaolinite percentage is ~32 percent and chlorite 18 percent (). Feldspar is dominant in relation to quartz.
Interpretation
The gray clay sediments with microfaults seen in Facies 7 between 50 and 48 ambsf represent a mass transport deposit (slump/debris flow). According to Andrén et al. (Citation2015), convolute bedding in Unit V indicates that the clay deposits were possibly remobilized by a slump event. This remobilization of sediments can be inferred also from the notable peaks of lower and higher density and MS values and increase in illite and feldspar content. The notable increase in water and carbon content indicates the weakening of ice sheet influence and the probable enhanced productivity.
Discussion
Reconstruction of the depositional phases of the Baltic Ice Lake
The stratification and rhythmical banding of the studied sediments are inferred to be related to glacial lake sedimentation controls. In such an environment, sandy lamination intervals relate to deposition from meltwater plumes, direct deposition in front of the ice sheet, and rainout from icebergs (cf. Bennett and Glasser Citation2009; Teller Citation2013). The relatively low water content and carbon values throughout the sediment sequence represent the expected low levels of productivity in this deglaciated basin, which is similar to a situation recorded by MacLeod, Osborn, and Spooner (Citation2006). Kaolinite, chlorite, and illite are the principal clay minerals in the studied samples and in the BS in general (e.g., Spiridonov et al. Citation2007), whereas smectite is absent in the presently studied samples (). Variations in clay mineral assemblages result mainly from the erosion of different glacial source deposits and crystalline bedrock as well as possible locally exposed Paleocene carbonate rocks. Kaolinite-rich sediments are formed by chemical weathering of silicic magmatic rocks, which are primarily rich in feldspars and micas (Leipe and Gingele Citation2003), and kaolinite can be eroded from kaolinite-rich sedimentary rocks in the catchments of major rivers entering the BS. The granite–gneisses of the Fennoscandian Shield are seen to represent the major parent rocks of terrigenous sediments, and quartz, feldspar, and illite are derived from the erosion and redeposition of these granite–gneisses, as indicated by Emel’yanov and Luksha (Citation2014). Supplies of eroded sediments in the local drainages and reworked moraines on the BS seafloor may play some role in this as well.
Figure 8. X-ray diffractogram of a clay fraction sample from the Landsort Deep sediments showing the principle of the major clay and non-clay mineral evaluation used in this study identified from three runs: normal, ethylene glycol treated, and heated (550°C).
Ice-marginal phase and the onset of deglaciation (Subunit VIc)
The occurrence of frequent sand laminations and coarser grain sizes in sediments, with isolated pebble and sand grains, indicates a proximal glaciolacustrine environment. The inferred onset of deglaciation at ~13.5 ka BP () led to a rise of the glacial lake level. The diamictic sediments with silt interlaminaes appearing in an overall upward-fining succession suggest a depositional environment with decreasing intensity of meltwater plumes. A rhythmically laminated silt and clay couplet that overlays ice-contact facies represents seasonal fluctuations of meltwater discharge in ice-contact lake (cf. Ridge et al. Citation2012); however, slump-generated underflows may complicate this rhythmicity of the lake bottom sediments.
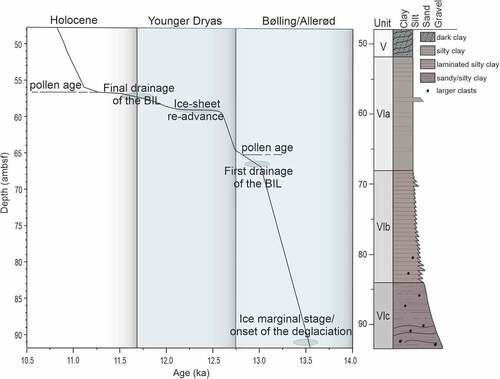
Figure 9. Inferred age–depth model of the sediment deposition of the Baltic Ice Lake stage based on the present multiproxy study from the Landsort Deep sediments from Units V and VI. The lenses illustrate the time span of the different stages of the Baltic Ice Lake presented in the figure. Pollen age distributions by Andrén et al. (Citation2015) are shown by dashed lines.
Toward the first drainage during Bølling/Allerød interstadial (Subunit VIb)
According to Kelly and Passhier (Citation2018), the rapid ice retreat and glacio-isostatic processes allowed the storage of substantial amounts of meltwater in the BIL during the Bølling/Allerød interstadials. This is recorded in Subunit VIb as finely laminated silty clays with a relatively uniform grain size distribution overlaying the proximal sediments. The silt–clay couplets (Facies 4) show greater variability in thickness and contain sharp-based sand laminaes of Facies 2 indicating lake underflows. The deposition prior to the first drainage is characterized by constant sediment supply and rapid sediment accumulation (). The effect of lake drainage, however, could be seen as an increase of clay content. A contribution of the major rivers and wider drainages corresponds to increased kaolinite–chlorite and quartz–feldspar ratios due to longer sediment transport pathways (Leipe and Gingele Citation2003). After the first drainage, large areas of clay-rich former lake floor sediments became exposed to the following surface runoff. Rivers likely incised the shorelines to meet the new lake level, thereby generating massive amounts of fine-grained suspended sediment deposited in the LD.
Younger Dryas and the final lake drainage (Subunit VIa and Unit V)
The clay-rich distal varves of Facies 4 are inferred to be deposited from distal meltwater suspension plumes, consistent with the interpretation by Kelly and Passhier (Citation2018). The reduced grain size variation, higher percentage of clay fraction, and increase in chlorite are connected to cooler conditions and possible glacier readvance leading to a decrease of meltwater and sediment availability. According to the cronostratigraphy, this interval likely refers to the Younger Dryas cold reversal. At the end of this interval, the sharp increase of sand content at around 58 ambsf may indicate a rapid ice retreat phase and a reprise meltwater release that generated the BIL level rise. The following final drainage enabled the erosion of the emerged coastal clay sediments, and the increased illite and feldspar content are characteristic of these reworked BIL clays deposited during glacial conditions. The accumulation of contorted layers at the base of Unit V is related to gravitational slump events that reworked and redeposited the sediments downslope, resembling a situation recorded by Forsberg et al. (Citation1999) and Streuff et al. (Citation2017).
Conclusions
The present multiproxy determinations of the sedimentary characteristics of the lithostratigraphic Units V and VI from the Landsort Deep enable interpretation of the nature of the last deglaciation during the Baltic Ice Lake stage of the Baltic Sea Basin. Based on our consideration of sedimentary facies, grain size, clay mineral distribution, and complementing information from the physical property measurements and the water and carbon content, the division to three subunits was applied to explain the evolutionary stages of the glacial lake related to the Fennoscandian Ice Sheet retreat. Our inferred age–depth model of the sediment deposition illustrates the main phases of the Baltic Ice Lake stage between ~13.5 and 10.5 ka BP.
The interval of ice-rafted debris in the lowermost part of Subunit VIc indicates a depositional environment associated with an ice-marginal phase. The onset of deglaciation related to the warm Bølling/Allerød interstadial caused a rise of the glacial lake level and the coarser ice-proximal varved sediments progressively changed to ice-distal fine-grained varved clayey and silty sediments of Subunit VIb.
The constant sedimentation phase was followed by the first drainage event of the Baltic Ice Lake, which result in the deposition of a clay-rich interval in Subunit VIb due to the erosion of the emerged lake bottom sediments.
The following reduced grain size variation and sedimentation rate and increased chlorite content might be due to the cooler conditions of the Younger Dryas and the related ice sheet readvance, which led to the decrease of meltwater and sediment availability.
The reoccurrence of higher sand content and a kaolinite peak in Subunit VIa are an indication of a rapid ice retreat, active meltwater plumes, and a rise of the lake level. The following final drainage enabled the erosion of the emerged coastal clay sediments and enhanced sediment transport to the Landsort Deep.
Acknowledgments
We thank the Integrated Ocean Drilling Program (IODP) and Expedition 347 Scientists (Citation2014c) for providing the samples used in this research. Many thanks also to Riitta Kontio at the Oulu Mining School, University of Oulu for the laboratory guidance and to Marcin Selent at the Centre for Material Analysis, University of Oulu for the XRD procedure. The constructive and helpful reviews of Jean-Carlos Montero-Serrano (ISMER-UQAR) and an anonymous reviewer, and the editor’s efficient handling of the review process contributed substantially to improving the article.
Disclosure statement
No potential conflict of interest was reported by the authors.
Additional information
Funding
References
- Andrén, T., S. Björck, E. Andrén, D. Conley, L. Zillén, and J. Anjar. 2011. The development of the Baltic Sea during the last 130 ka. In The Baltic Sea Basin, ed. J. Harff, S. Björck, and P. Hoth, 75–97. Berlin: Springer. doi:10.1007/978-3-642-17220-5_4.
- Andrén, T., B. B. Jorgensen, and C. Cotterill, and the Expedition 347 Scientists. 2015. Proceedings of IODP, 347: College Station, TX: IOPD (Integrated Ocean Drilling Program). doi:10.2204/iodp.proc.347.2015.
- Andrén, T., B. B. Jørgensen, C. Cotterill, S. Green, and the Iodp Expedition 347 Scientific Party. 2015. IODP expedition 347: Baltic Sea basin paleoenvironment and biosphere. Scientific Drilling 20:1–12. doi:10.5194/sd-20-1-2015.
- Andrén, T., B. B. Jørgensen, C. Cotterill, S. Green, E. Andrén, J. Ash, T. Bauersachs, B. Cragg, A.-S. Fanget, A. Fehr, et al. 2015a. Site M0063. In Proceedings of the IODP, ed. T. Andrén, B. B. Jørgensen, C. Cotteril, and S. Green, and the Expedition 347 Scientists, Vol. 347. doi:10.2204/iodp.proc.347.107.2015.
- Andrén, T., B. B. Jørgensen, C. Cotterill, S. Green, E. Andrén, J. Ash, T. Bauersachs, B. Cragg, A.-S. Fanget, A. Fehr, et al. 2015b. Methods. In Proceedings of the IODP, ed. T. Andrén, B. B. Jørgensen, C. Cotterill, S. Green, and the Expedition 347 Scientists, Proceedings of IODP, 347. College Station, TX: IOPD (Integrated Ocean Drilling Program). doi: 10.2204/iodp.proc.347.102.2015
- Andren, T., G. Lindeberg, and E. Andren. 2002. Evidence of the final drainage of the Baltic Ice Lake and the brackish phase of the Yoldia Sea in glacial varves from the Baltic Sea. Boreas 31:226–38. doi:10.1111/j.1502-3885.2002.tb01069.x.
- Ashley, G. M. 2002. Glaciolacustrine environments. In Modern and past glacial environments, ed. J. Menzies, 335–59. Oxford: Butterworth-Heinemann. doi:10.1016/B978-075064226-2/50014-3.
- Bennett, M. R., and N. F. Glasser. 2009. Glacial geology, ice sheets and landforms, 385. UK: Wiley-Blackwell.
- Bergsten, H., and K. Nordberg. 1992. Late Weichselian marine stratigraphy of the southern Kattegat, Scandinavia: Evidence for drainage of the Baltic Ice Lake between 12,700 and 10,300 years BP. Boreas 21 (3):223–52. doi:10.1111/j.1502-3885.1992.tb0030.x.
- Berndmeyer, C., V. Thiel, O. Schmale, N. Wasmund, and M. Blumenberg. 2014. Biomarkers in the stratified water column of the Landsort Deep (Baltic Sea). Biogeosciences 11 (23):7009–23. doi:10.5194/bg-11-7009-2014.
- Björck, S. 1995. A review of the history of the Baltic Sea, 13.0–8.0 ka BP. Quaternary International 27:19–40. doi:10.1016/1040-6182(94)00057-C.
- Björck, S., and P. Möller 1987. Late Weichselian environmental history in southeastern Sweden during the deglaciation of the Scandinavian ice sheet. Quaternary Research 28:1–37. doi:10.1016/0033-5894(87)90030-5
- Blott, S. J., and K. Pye. 2001. GRADISTAT: A grain size distribution and statistics package for the analysis of unconsolidated sediments. Earth Surface Processes and Landforms 26 (11):1237–48. doi:10.1002/esp.261.
- Böttcher, M. E., and A. Lepland. 2000. Biogeochemistry of sulphur in a sediment core from the west-central Baltic Sea: Evidence from stable isotopes and pyrite textures. Journal of Marine Systems 25 (3–4):299–312. doi:10.1016/S0924-7963(00)00023-3.
- Cuzzone, J. K., P. U. Clark, A. E. Carlson, D. J. Ullman, V. R. Rinterknecht, G. A. Milne, J.-P. Lunkka, B. Wohlfarth, S. A. Marcott, and M. Caffee. 2016. Final deglaciation of the Scandinavian Ice Sheet and implications for the Holocene global sea-level budget. Earth and Planetary Science Letters 448:34–41. doi:10.1016/j.epsl.2016.05.019.
- Emel’yanov, E. M., and V. L. Luksha. 2014. The clay mineralogy and paleogeography of the Gotland Basin (based on the data from the Psd-303590 core). Moscow University Geology Bulletin 69 (4):219–28. 10.3103/S0145875214040036.
- Expedition 347 Scientists. 2014a. Carbon and sulphur content (raw data) of IODP Hole 347-M0063C. PANGAEA, 10.1594/PANGAEA.839492.
- Expedition 347 Scientists. 2014b. Physical properties of IODP Hole 347-M0063C. PANGAEA, 10.1594/PANGAEA.838479.
- Expedition 347 Scientists. 2014c. Visual core description and core images IODP Hole 347-M0063C. PANGAEA, 10.1594/PANGAEA.837860.
- Forsberg, C. F., A. Solheim, A. Elverhøi, E. Jansen, J. E. T. Channell, E. S. Andersen. 1999. The depositional environment of the western Svalbard margin during the Late Pliocene and the Pleistocene: Sedimentary facies changes at site 986. In Proceedings of the Ocean Drilling Program, Scientific Results, ed. M. E. Raymo, E. Jansen, P. Blum, and T. D. Herbert, Vol. 162, 233–246. doi:10.2973/0dp.proc.sr.162.032.1999.
- Gingele, F. X., and T. Leipe. 1997. Clay mineral assemblages in the western Baltic Sea: Recent distribution and relation to sedimentary units. Marine Geology 140 (1–2):97–115. doi:10.1016/S0025-3227(97)00023-6.
- Harff, J., R. Endler, E. Emelyanov, S. Kotov, T. Leipe, M. Moros, R. Olea, M. Tomczak, A. Witkowski. 2011. Late Quaternary climate variations reflected in Baltic Sea sediments. In The Baltic Sea Basin, ed. J. Harff, S. Björck, and P. Hoth, 99–132. Berlin: Springer.
- Heiri, O., F. L. André, and G. Lemcke. 2001. Loss on ignition as a method for estimating organic and carbonate content in sediments: Reproducibility and comparability of results. Journal of Paleolimnology 25 (1):101–10. doi:10.1023/A:1008119611481.
- Hell, B., and H. Öiås. 2014. A new bathymetry model for the Baltic Sea. International Hydrographic Review 12.
- Houmark-Nielsen, M., and K. H. Kjær. 2003. Southwest Scandinavia, 40–15 ka BP: Palaeogeography and environmental change. Journal of Quaternary Science 18 (8):769–86. doi:10.1002/jqs.802.
- Hughes, A. L. C., R. Gyllencreutz, Ø. S. Lohne, J. Mangerud, and J. I. Svendsen. 2016. The last Eurasian ice sheets – A chronological database and time-slice reconstruction, DATED-1. Boreas 45:1–45. doi:10.1111/bor.12142.
- Kallio, H. 2006. The evolution of the Baltic Sea – Changing shorelines and unique coasts. Geological Survey of Finland, Special paper 41. 17–21.
- Kaskela, A. M., A. T. Kotilainen, Z. Al-Hamdani, J. O. Leth, and J. Reker. 2012. Seabed geomorphic features in a glaciated shelf of the Baltic Sea. Estuarine, Coastal and Shelf Science 100:150–61. doi:10.1016/j.ecss.2012.01.008.
- Kelly, A. L., and S. Passhier. 2018. A sub-millennial sediment record of ice-stream retreat and meltwater storage in the Baltic Ice Lake during the Bølling-Allerød interstadial. Quaternary Science Reviews 198:126–39. doi:10.1016/j.quascirev.2018.08.018.
- Lambeck, K., C. Smither, and P. Johnston. 1998. Sea-level change, glacial rebound and mantle viscosity for Northern Europe. Geophysical Journal International 134 (1):102–44. doi:10.1046/j.1365-246x.1998.00541.x.
- Larsson, J., E. E. Lind, H. Corell, M. Grahn, K. Smolarz, and M. Lönn. 2017. Regional genetic differentiation in the blue mussel from the Baltic Sea area. Estuarine, Coastal and Shelf Science 195:98–109. doi:10.1016/j.ecss.2016.06.016.
- Leipe, T., and F. X. Gingele. 2003. The kaolinite/chlorite clay mineral ratio in surface sediments of the southern Baltic Sea as an indicator for long distance transport of fine-grained material. Baltica 16:31–37.
- Lepland, A., and R. L. Stevens. 1998. Manganese authigenesis in the Landsort Deep, Baltic Sea. Marine Geology 151 (1–4):1–25. doi:10.1080/11035899609546240.
- MacLeod, D. M., G. Osborn, and I. Spooner. 2006. A record of post-glacial moraine deposition and tephra stratigraphy from Otokomi Lake, Rose Basin, Glacier National Park, Montana. Canadian Journal of Earth Sciences 43:447–60. doi:10.1139/E06-001.
- Miall, A. D. 2022. Stratigraphy: A modern synthesis, 518. Cham: Springer.
- Myrberg, K., M. Leppäranta, and H. Kuosa. 2006. Itämeren fysiikka, tila ja tulevaisuus, 202. Helsinki: University Press.
- Obrochta, S. P., T. Andrén, S. Z. Fazekas, B. C. Lougheed, I. Snowball, Y. Yokoyama, Y. Miyairi, R. Kondo, A. T. Kotilainen, O. Hyttinen, et al. 2017. The undatables: Quantifying uncertainty in a highly expanded Late Glacial-Holocene sediment sequence recovered from the deepest Baltic Sea basin—IODP site M0063. Geochemistry Geophysics Geosystems 18 (3):858–71. doi:10.1002/2016GC006697.
- Patton, H., A. Hubbard, K. Andreassen, A. Auriac, P. L. Whitehouse, A. P. Stroeven, C. Shackleton, M. Winsborrow, J. Heyman, and A. M. Hall. 2017. Deglaciation of the Eurasian ice sheet complex. Quaternary Science Reviews 169:148–72. doi:10.1016/j.quascirev.2017.05.019.
- Pickering, K. T., R. Hiscott, and F. J. Hein. 1989. Deep-marine environments: Clastic sedimentation and tectonics. London: Unwin Hyman.
- Pickering, K. T., D. Stow, M. Watso, and R. Hiscott. 1986. Deep-water facies, processes and models: A review and classification scheme for modern and ancient sediments. Earth Science Reviews 223:75–174.
- Ridge, J. C., G. Balco, R. L. Bayless, C. C. Beck, L. B. Carte, J. L. Dean, E. B. Voytek, and J. H. Wei. 2012. The New North American Varve Chronology: A precise record of southeastern Laurentide Ice Sheet deglaciation and climate, 18.2-12.5 kyr BP, and correlations with Greenland ice core records. American Journal of Science 312 (7):685–722. doi:10.2475/07.2012.01.
- Rinterknecht, V. R., P. U. Clark, G. M. Raisbeck, F. Yiou, A. Bitinas, E. J. Brook, L. Marks, V. Zelčs, J.-P. Lunkka, I. E. Pavlovskaya, et al. 2006. The last deglaciation of the Southeastern sector of the Scandinavian Ice Sheet. Science 311 (5766):1449–52. doi:10.1126/science.1120702.
- Rosentau, A., O. Bennike, S. Uścinowicz, and G. Miotk-Szpiganowicz. 2017. The Baltic Sea Basin. In Submerged landscapes of the European continental shelf: Quaternary paleoenvironments, ed. Flemming, N. C., Harff, J., Moura, D., Burgess, A., Bailey, G. N., 103–133. doi:10.1002/9781118927823.ch5.
- Spiridonov, M., D. Ryabchuk, A. Kotilainen, H. Vallius, E. Nesterova, and V. Zhamoida. 2007. The Quaternary deposits of the eastern Gulf of Finland. In Holocene sedimentary environment and sediment geochemistry of the eastern Gulf of Finland, Baltic Sea. Geological Survey of Finland. Special Paper 45: 7–19.
- Streuff, K., C. Ó. Cofaigh, K. Hogan, A. Jennings, J. M. Lloyd, R. Noormets, T. Nielsen, A. Kuijpers, J. A. Dowdeswell, and W. Weinrebe. 2017. Seafloor geomorphology and glacimarine sedimentation associated with fast-flowing ice sheet outlet glaciers in Disko Bay, West Greenland. Quaternary Science Reviews 169:206–30. doi:10.1016/j-quascirev.2017.05.021.
- Stroeven, A. P., C. Hättestrand, J. Kleman, J. Heyman, D. Fabel, O. Fredin, B. W. Goodfellow, J. M. Harbor, J. D. Jansen, L. Olsen, et al. 2016. Deglaciation of Fennoscandia. Quaternary Science Reviews 147:91–121. doi:10.1016/j.quascirev.2015.09.016.
- Teller, J. T. 2013. Subaquatic landsystems: Large Proglacial Lakes. In Glacial Landsystems, ed. D. J. A. Evans, 532. New York: Routledge.
- Vassiljev, J., and L. Saarse. 2013. Timing of the Baltic Ice Lake in the eastern Baltic. Bulletin of the Geological Society of Finland 85 (1):9–18. doi:10.17741/BGSF/85.1.001.