
 ?Mathematical formulae have been encoded as MathML and are displayed in this HTML version using MathJax in order to improve their display. Uncheck the box to turn MathJax off. This feature requires Javascript. Click on a formula to zoom.
ABSTRACT
Snow algae are photosynthetic microbes growing on melting snow surfaces, the blooms of which are visible on alpine snowpacks in Japan during the melting season. We characterized the seasonal and altitudinal variations in algal blooms on Mount Gassan, Japan, to assess the influence of vegetation on the algal bloom. From May to July in 2019, we collected colored snow from lower deciduous forest to the upper alpine areas. In the lower forest area, chlorophyll-a concentration in colored snow samples increased concomitantly with deciduous tree budburst, whereas in the alpine area, chlorophyll-a increased from June to July, although at lower levels than in the forest area. The absorption spectra of algal pigments extracted from samples differed among study sites and seasons, with those obtained from forest sites mainly characterized by absorption of chlorophylls and primary carotenoids, whereas those from alpine sites showed an intense secondary carotenoid peak throughout the study period. Chemical solute analyses revealed a general abundance of phosphate in snow, which was significantly higher in forest than in alpine sites and positively correlated with chlorophyll-a concentration. These findings suggest that nutrient supply from the forest canopy largely controls the appearance of colored snow in this area.
Introduction
Snow algae are photosynthetic microbes growing on the melting snow surfaces of glaciers and snowfields worldwide, a majority of which are species of Chlorophyta (green algae) in the order Volvocales (Kol Citation1968), with occasional representatives of the Cyanobacteria and Chrysophytes (golden algae; e.g., Fukushima Citation1963; Segawa et al. Citation2005). When these algae bloom on snowpacks, the snow surface can be visibly pigmented with various colors, including red, green, and yellow. In alpine and polar regions, snow algal blooms reduce snow surface albedo and thereby accelerate the rate of melt (Yallop et al. Citation2012; Takeuchi Citation2013; Lutz et al. Citation2016). Thus, it is essential to understand the factors contributing to the development of these algal blooms on snowpacks.
The color of snow algal blooms varies both temporally and spatially, depending on the pigment composition of the algal cells. Snow algal cells typically contain a range of pigments, including chlorophylls and carotenoids, which play a role in photosynthesis and/or photoprotections (Bidigare et al. Citation1993; Müller et al. Citation1998). Red snow is caused by the bloom of algae that contain abundant secondary carotenoids such as astaxanthins, which are red-colored pigments. On the other hand, green snow is caused by the algae that contain less secondary carotenoids but mainly chlorophylls and primary carotenoids, which are green- and yellow- or orange-colored pigments, respectively.
Given that the chemical and physical conditions of the snow surface influence the community structure or life cycle of snow algae to differing extents, these can play roles in determining the pigment compositions of snow algal blooms. For example, red-colored snow develops on the snow surface subjected to intense solar radiation, whereas green-colored snow often occurs in shaded sites such as forest floors (Thomas and Duval Citation1995). Furthermore, red-colored snow contains abundant secondary carotenoids that develop under nutrient-poor conditions, whereas a nutrient-rich environment is conducive to the development of green-colored algae (Leya et al. Citation2009). However, it has also been controversially observed that astaxanthin-rich algae were found in snow with a high nitrogen content (Fujii et al. Citation2010) and that nutrient concentration was not clearly different between the different colored snow communities (Spijkerman et al. Citation2012). Therefore, the association of nutrient with algal pigments is not simple, although the nutrient content has a relevant role in the occurrence of snow algae.
The abundance and the community structure of snow algae have been established to vary temporally and spatially depending on the environmental conditions. In this regard, a reduction in the biomass of snow algae and significant changes in algal community composition have been observed with increasing elevation on a glacier in the Nepali Himalayas (Yoshimura, Kohshima, and Ohtani Citation1997), whereas on an Alaskan glacier, the composition of snow algal communities has been found to differ according to season (Takeuchi Citation2013). Altitudinal variation in the community structure of snow algae has also been observed on snowpacks in mountainous areas. In Canada, at sites above the tree line, snow algal blooms consisting of several species have been found to be dominated by Sanguina, whereas at lower elevations, Chloromonas tends to predominate (Engstrom, Yakimovich, and Quarmby Citation2020; Yakimovich, Engstrom, and Quarmby Citation2020).
The occurrence and composition of snow algal communities in mountainous areas are likely to be associated with vegetation, because the forest canopy typically has a prominent influence on the physiochemical conditions of the snow surface (Jones Citation1991). For example, given that the forest canopy shades the snow surface from direct sunlight, the biomass and pigment composition of snow algae may vary with the type of vegetation. Furthermore, throughfall and litterfall from the forest canopy can have pronounced effects on the chemical composition of the snow surface. For example, compared with open areas, the concentrations of major chemical solutes, particulate organic carbon, and organic nitrogen in the snowpack have been reported to be higher within forested sites (Suzuki and Watanabe Citation2000), which presumably influences the nutrient conditions of snow algae.
Seasonal snowpacks in the mountainous areas of Japan are commonly pigmented with algal blooms of differing color (Fukushima Citation1963). For example, in the alpine area of Mount Asahi on Hokkaido Island, red- and green-colored snow, associated with a predominance of algae in the genera Chloromonas and Sanguina, develops on the snow surface (Terashima et al. Citation2017). Similarly, red-colored snow algae dominated by Sanguina sp. develop on the snow surface in the alpine area of Mount Tateyama, the pigment composition of which differs depending on season and location (Nakashima et al. Citation2021). On mainland Japan, the vegetation changes with elevation from the evergreen broadleaf forest distributed in the lower plains, to the summer green broadleaf forest, subalpine forest, and treeless alpine grassland predominant in the highest areas of mountains (Numata, Miyawaki, and Itow Citation1972). Consequently, it can be anticipated that the snow algal blooms that develop in mountainous areas will vary spatially, depending on elevation and vegetation type. Currently, however, there is a lack of information regarding the spatial and seasonal variations in the appearance of algal blooms in the mountainous areas in Japan. Accordingly, there is an imperative to characterize the distribution and seasonal changes of these algae to gain a better understanding of the influence of vegetation on snow algal blooms.
Each winter, Mount Gassan, located in Yamagata Prefecture in the northwestern part of Honshu Island, Japan, is typically covered with deep snow, and on the snowpacks in this area, algal blooms of differing color appear each spring. Taxonomic studies of these blooms have indicated that green-colored snow is associated with the occurrence of Chloromonas algae (Muramoto et al. Citation2008, Citation2010; Matsuzaki et al. Citation2015, Citation2019), whereas yellow-colored snow has been reported to be dominated by the Chrysophytes (golden algae) Ochromonas algae (Tanabe et al. Citation2011).
In this study, we sought to characterize seasonal and altitudinal variations in algal blooms that develop on the snowpacks of Mount Gassan to assess the influence of vegetation on occurrence and color of the algal bloom. During the melting season from May to July in 2019, we collected colored snow at selected sites from lower deciduous forest to upper alpine areas above the tree line, and herein we describe the seasonal and altitudinal variations in algal abundance, community structure, and pigment compositions with respect to the nutrient conditions and vegetation in the surveyed area.
Study site and methods
Study site and sample collection
Mount Gassan (39°30′ N, 140°00′ E) is located in the Yamagata Prefecture in the northwestern region of Honshu Island (). The highest peak of Mt. Gassan is 1984 m above sea level (a.s.l.), and the main mountainous ridge extends from the north to the south along the west coast of the Honshu Island. During the winter, strong westerly monsoon winds blow in from the Sea of Japan to the mountains, bringing heavy snowfalls, which can accumulate to depths of more than 3 m. In the lower forested area of the study site, the vegetation is dominated by broadleaf deciduous trees (mostly Fagus crenata), whereas the upper alpine zone above 1,450 m.a.s.l. is generally covered by alpine grassland with a partial cover of dwarf conifer shrub (Pinus pumila). In this region, which is characterized by subzero mean winter temperatures, seasonal snow generally accumulates from November until March, typically reaching depths of approximately 4 m in the lower forest area (Yumihiradaira Park, altitude 770 m.a.s.l.; Yamaguchi et al. Citation2011). This snow starts to melt from late March and by mid-July most has disappeared, although scattered patches remain along the valleys throughout the summer months. During this seasonal melt, green-, orange-, red-, and yellow-colored algal blooms appear annually on the snow surface, particularly in the lower forest area.
Figure 1. (a) Maps showing the location of the study area in Mount Gassan, Japan. (b) Locations of the sites where the colored snow samples were collected. Numbers in the map indicate the altitude above sea level. (c) Photograph of the alpine area at site S7 on 18 May. (d) Photograph of the sampling point in the forest area at the site S3 on 20 May showing the green-colored snow surrounded by vegetative litter from the forest canopy. (e) Photograph of the forest area at site S3 on 20 May.
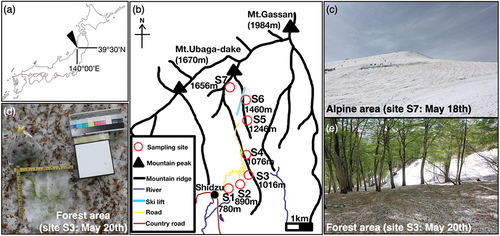
The fieldwork undertaken in this study was conducted at three time points during the melt season of 2019, from 18 to 20 May, on 5 and 6 June, and on 1 July. Snow samples were collected at seven sites along a ridgeline extending from an altitude of 780 to 1,656 m.a.s.l. In May, all of the sites were still completely covered with snow, whereas by June, snowpacks had disappeared from the lower forest sites (S1–S3) but still remained at the upper sites (S4–S7). By July, snow remained only at the highest alpine site (S7). In the daytime during the period of observation, the snow surface melted at all study sites. At each site, we collected a total of ten samples of visibly colored surface snow, which were melted and preserved in a 3% formalin solution in clean 15-mL centrifuge tubes for subsequent determinations of cell concentration. Despite the likelihood of the loss of algal fine structures during formalin preservation, the algae could still be counted with the aid of a microscope. A further set of samples, collected for chlorophyll, spectral absorption, and chemical analysis, were initially maintained frozen in a cooler box. After transporting the samples to the laboratory at Chiba University, they were stored in a freezer (−20°C) until further analysis.
Microscopic observations and quantification of algal biomass
Algal cells in the melted samples were observed using an Olympus BX51 optical microscope. A 5- to 100-mL volume of melted sample was filtered through a hydrophilic membrane filter (pore size: 0.45 µm) and the number of algal cells on the filter (area: 2.5 × 106 µm2) was counted under the microscope. For each sample, we performed three counts, on the basis of which we determined cell concentrations (cells per 1 mL of meltwater) for each algal morphological type. The cell volume of each type was determined geometrically based on measurements of the mean size (length, width, or diameter) of cells using microscopic photographs taken using an Olympus DP21 digital microscope camera and ImageJ (Schneider, Rasband, and Eliceiri Citation2012) image processing software. Using the algal cell concentration and volume values thus obtained, we determined the cell volume biomass (µm3 mL−1) of algae.
Chlorophyll-a concentration
The concentration of chlorophyll-a in snow samples was measured using the Welschmeyer method (Welschmeyer Citation1994). Melted snow samples (sample volume: 5–145 mL, depending on chlorophyll-a concentration to fit in the measurable range) were filtrated through a 25-mm grass fiber filter to collect algal cells on filters, which were immersed in 6 mL of N,N-dimethylformamide (DMF) contained within plastic screw-capped vials. These vials were placed in a refrigerator (4°C) for 24 hours to facilitate algal pigment extraction, with the concentration of chlorophyll-a in the DMF being measured fluorometrically using a Trilogy Laboratory Fluorometer. The concentration of chlorophyll-a in the snow samples was determined from the values obtained for the concentration in DMF and the volume of filtered water.
Absorption spectra of algal pigments
To ascertain the pigment composition of algal blooms, we obtained absorption spectra for the algal pigments extracted from the snow samples. Light absorbance of the DMF pigment extracts was measured at 1-nm intervals in a wavelength range from 300 to 900 nm using a Shimadzu UV-mini 1240 spectrophotometer, and from the values thus determined, we obtained spectral absorption curves within the designated wavelength range.
Major chemical solutes in snow samples
Major soluble ions (PO43−, NO3−, NH4+, K+, Na+, Cl−, SO42−, Mg2+, and Ca2+) in snow samples were analyzed using an ICS-1100 ion chromatography system. To remove particulate matter, melted snow samples were initially filtered through an ion-free filter (chromatographic discs). For anion analysis, we used a Dionex Ion Pac AS12A separator column in conjunction with a Dionex Ion Pac AG12A guard column. As an eluent, we used a mixture of 2.7 mM Na2CO3 and 0.3 mM NaHCO3, the flow rate of which was set at 1.5 mL min−1. For cation analysis, we used a Dionex Ion Pac CS12A column and 20 mM methanesulfonic acid as an eluent with a flow rate of 1.0 mL min−1.
Tree canopy analysis using satellite images
Coverage of the leaf canopies of broadleaf deciduous trees over a given snow area was analyzed using the Normalized Difference Vegetation Index (NDVI), the values of which were determined with satellite images. For the purposes of this study, we used three satellite images of the Mount Gassan area, which were obtained on 13 May, 5 June, and 21 June 2019 by an Operational Land Imager sensor of the Landsat 8 satellite. The images were selected for their cloud-free views of the study site in mid-May and early and late June, coinciding with the periods of fieldwork. We converted satellite digital numbers obtained from Landsat 8 images into reflectance values using the following equation (Malik, Shukla, and Mishra Citation2019):
where Ref(Band i) is the top of atmosphere planetary reflectance in Band i, ML is the band-specific multiplicative rescaling factor, Qcal is the quantified and calibrated standard product pixel value in Band i, and θSE is the local sun elevation angle in Band i.
NDVI values were calculated from band reflectance in the red (Band 4) and near-infrared (Band 5) wavelengths using the following equation (Malik, Shukla, and Mishra Citation2019):
NDVI values have been shown to be effective in sensing green vegetation and monitoring regional trends, as well as the variability of vegetation (Huete et al. Citation2002). We used the NDVI (the value of which ranges from −1 to 1) to determine whether deciduous trees had opened their leaves. In general, negative values of NDVI (values approaching −1) correspond to water, whereas values close to zero (−0.1 to 0.1) tend to indicate barren rock, sand, or snow areas. Low positive values (approximately 0.2 to 0.4) represent shrub and grassland, whereas high positive values (values approaching 1) are indicative of temperate and tropical rainforests.
Statistical data analysis
Statistical analyses including Student’s t test, one-way analysis of variance (ANOVA), Pearson’s correlation test, and principal component analysis (PCA) were performed using R Statistical Software v4.1.3 (R Core Team Citation2018). Student’s t test and one-way ANOVA were conducted to examine the spatial and seasonal variations in chlorophyll-a and major ion concentrations. Pearson’s correlation and PCA were conducted to examine the relationship between chlorophyll-a and major ion concentrations.
Results
Colored snows were visibly observed at the study sites, the colors of which differed according to season and site elevation. In May, we found mainly green-colored snow patches at the lower forest sites (S1–S3) but also found orange-colored patches at site S1. These colored patches were typically approximately 10 cm in diameter. In contrast, we observed only brown- or black-colored patches of snow at the other sites, which was probably due to windblown organics and dust. In June, we found green-colored snow patches at the two higher forest sites (S4 and S5), where colored snow was not observed in May. Although we failed to detect any visible evidence of colored snow at site S6 in the lower alpine area, we did observe red-colored snow patches of approximately 30 × 30 cm in dimension at site S7, the highest alpine area surveyed. Moreover, in July, numerous patches of red-colored snow were visible at this latter site.
Morphology of snow algal cells
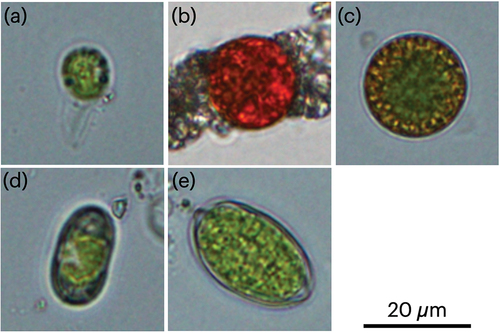
Microscopic observation revealed that snow samples contained algal cells with a diverse range of morphological types (), the major types of which are as follows. Type I cells () are spherical flagellate cells of 10 ± 2.5 µm (mean ± SD) in diameter. These cells bear two flagella, chloroplasts of approximately 9 µm in diameter, with a cell wall thickness of approximately 1 µm. Type II cells () are spherical red cysts of 14 ± 1.5 µm in diameter, with a cell wall thickness of approximately 1.5 µm. Type III cells () are flagellate spherical cells of 18 ± 1.8 µm in diameter, with a chloroplast of approximately 6 µm in diameter and cell wall thickness of approximately 2 mm. Type IV cells () are elliptical cells of approximately 11 ± 1.6 µm in diameter and 20 ± 2.7 µm in length, and type V cells () are oval-shaped cells of 14 ± 1.4 µm in diameter and 23 ± 2.7 µm in length.
Figure 2. Microphotographs of snow algal cells in colored snow samples in Mount Gassan. Scale bar = 20 µm. (a) Type I: Spherical flagellate cell with an approximate size of 10 µm in diameter. (b) Type II: Spherical cell with an approximate size of 14 µm in diameter. (c) Type III: Spherical cell with an approximate size of 18 µm in diameter. (d) Type IV: Elliptical cell with an approximate size of 11 µm in diameter and 20 µm in length. (e) Type V: Oval-shaped cell with an approximate size of 14 µm in diameter and 23 µm in length.
Composition of algal cell types
Microscopy revealed that all snow samples collected in this study contained snow algal cells and that the composition of these algae differed among the sites and collection dates (). In May, type III algae were found to be dominant (85–91 percent) in the alpine sites (S6 and S7), whereas type I algae predominated (4–63 percent) in the forest sites at lower elevations (S1–S5). Moreover, among these forested sites, the predominance of type I was notably higher in the lower sites (S1–S3) than in the upper sites (S4 and S5; 18–63 percent at S1–S3 versus 4–27 percent at S4 and S5). Type II algae were observed exclusively in the alpine sites, although they accounted for only for 7 to 9 percent of the total algal biomass. Type IV algae were observed only in the lower three sites in the forest area, accounting for 12 to 34 percent of the total algal biomass, whereas type V algae were found to be relatively ubiquitous, being observed in all but the highest alpine site (S7) and accounting for 2 to 26 percent of the total biomass (S1–S6). In this month, the proportions of type I algae were the most variable among the sites than the other algae types.
Figure 3. Seasonal and altitudinal variations in compositions of algal morphological types represented by cell number on the snow surface of Mount Gassan from May to July 2019. No snow remained at the sites below the dashed lines.
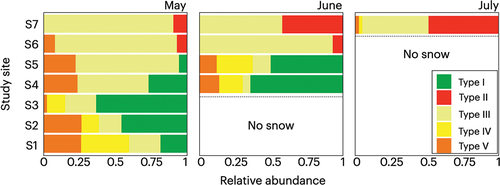
In June, type III algae were the predominant type (58–93 percent) in alpine sites (S6 and S7), whereas in forest sites S4 and S5, type I algae predominated (50–65 percent), which was similar to the pattern observed in May. At the highest alpine site (S7), the percentage of type II algae with respect to total algal biomass increased from that in May (9 percent in May to 42 percent in June) with respect to total algal biomass. In the uppermost two forested sites, the percentages of type I and IV algae in the total algal biomass increased from those in May (type I: 27–57 percent; type IV: 0–21 percent), whereas a reduction was detected in the proportions of type III and V algae (type III: from 50 to 9 percent; type V: from 24 to 13 percent). In this month, the proportions of type I and II algae were relatively more changed from May than the other algae types.
During July, type II algae became marginally more predominant (49 percent) among snow algal communities in the highest alpine site (S7), whereas type III algae were found to be the second most dominant type (46 percent) at this site. The remaining 5 percent comprised algae of types IV and V, which were detected at S7 during May and June (type IV: 2 percent; type Ⅴ: 3 percent).
Chlorophyll-a concentrations
Chlorophyll-a concentrations of the colored snow samples differed according to collection date and site elevation (). In May, the mean chlorophyll-a concentrations were significantly higher at the lower three sites in the forest area (mean = 708–764 µg L−1 at S1–S3) than at higher elevations (mean = 2.6–71 µg L−1 at S4–S7; t = 10.6, p = 5.3 × 10⁻¹⁶). Among the latter four sites, mean chlorophyll-a concentrations at the higher two forest sites and two alpine sites were 19–71 µg L−1 and less than 5 µg L−1, respectively.
Figure 4. Seasonal and altitudinal variations in chlorophyll-a concentrations on the snow surface of Mount Gassan from May to July 2019. No snow remained at the sites below the dashed lines.
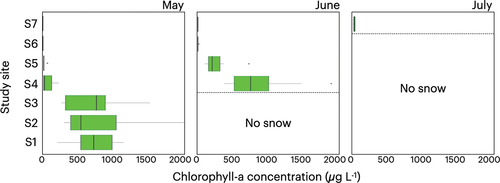
In June, mean chlorophyll-a concentrations were significantly higher at the upper two forest sites compared with those at the alpine sites (268–869 µg L−1 versus 5.6–6.5 µg L−1; t = 5.3, p = 4.5 × 10⁻⁶). Moreover, the mean concentrations increased from those in May, particularly in the forested areas, with significant twelve- and fourteenfold increases being detected at sites S4 and S5, respectively (mean = 71 to 869 µg L−1 at S4; 19 to 268 µg L−1 at S5; t = −5.2, p = 6.6 × 10⁻⁵ at S4; t = −4.3, p = 4.4 × 10⁻⁴ at S5). In contrast, at the alpine sites, the observed increases in mean chlorophyll-a concentrations in June from those in May were relatively limited (mean = 3.8 to 6.5 µg L−1 at S6; 2.6 to 5.6 µg L−1 at S7; t = −1.9, p = .073 at S6; t = −2.6, p = .017 at S7).
In July, however, the mean chlorophyll-a concentration at the highest alpine site (S7) was 36 µg L−1, which represents a significant increase from that in both May and June (t = −8.5, p = 1.1 × 10⁻⁷ from May, t = −7.4, p = 6.8 × 10⁻⁷ from June). At the remaining six sites, snow cover had disappeared during this month.
Absorption spectra of algal pigments
Consistent with the observed changes in algal community composition and chlorophyll-a concentrations, we detected differences among study sites and collection dates with respect to the absorption spectra of algal pigments extracted from colored snow samples (). In most cases, the spectra obtained were characterized by an absorption peak at a wavelength of 663 nm, which corresponds to the absorption of chlorophyll-a. We also detected peaks at wavelengths between 400 and 500 nm, although the absorption wavelengths differed among samples. On the basis of the peak wavelengths in this range, we classified the spectra into four types (A to D; ). Type A was characterized by a highest absorption at 480 nm, which is assumed to represent astaxanthin absorption, and the surface snows corresponding to this type were found to have red pigmentation (Lambertsen and Braekkan Citation1971). For type B, the highest absorption was detected at 410 nm, which is indicative of pheophythin-a or primary carotenoids, and the surface snow patches associated with this type were characterized by dark green-colored snow (Lichtenthaler Citation1987; Chazaux et al. Citation2022). The highest absorption of type C was detected at 430 nm, which represents chlorophyll-a or primary carotenoids, with the surface snow patches associated with this type being characterized by a green-colored snow (Chazaux et al. Citation2022). Type D had the highest absorption peaks of 460 and 430 nm, the levels of which were comparable, and the surface snow patches associated with this type were stained orange. Of these two peaks, we speculate that the absorption at 460 nm is attributable to chlorophyll-b or primary carotenoids. In addition, there were fifty-six samples showing no clear absorption peak, which we assumed reflected insufficient amounts of algal pigments that were below the level of detection. These samples were accordingly excluded from the classification.
Figure 5. (a) Typical absorption spectra of snow algal pigments of the collected samples in the visible wavelength region on the snow surface of Mount Gassan. The absorbance at each wavelength was normalized to 1 at 663 nm. (b) Seasonal and altitudinal variations of pigment type compositions on the snow surface of Mount Gassan from May to July 2019.
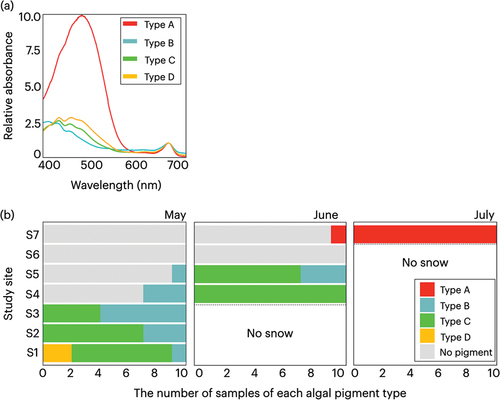
In May, the spectra of samples collected from the forest sites (S1–S5) were characterized by types B, C, and D, with type B obtained for samples collected from all five sites, type C obtained for samples from the lower three sites, and type D obtained only for samples collected from the lowest site. In contrast, the spectra of samples collected from the alpine sites (S6 and S7) showed no clear absorption peak at 663 nm (chlorophyll-a).
In June, the spectra of the samples collected from the forest sites generally showed type B or C profiles. Although type C was not observed at the two uppermost forest sites (S4 and S5) in May, it was found to increase significantly in June. Apart from one sample collected from the highest alpine site (S7), which was characterized by a type A spectrum, the spectra for all other samples collected from the alpine sites showed no clear absorption at 663 nm.
In marked contrast, the spectra obtained for samples collected from the highest alpine site in July showed only a type A profile, and we noted a significant increase in the proportion of type A spectra during this month.
Major chemical solutes in colored snow
We also detected differences in the compositions and concentrations of the major chemical solutes in snow samples collected from the different study sites and at different time points (, ). In May, compared with the four sites at higher elevation (S4–S7), chemical solutes were found to be more abundant at the lower three sites in the forested area (S1–S3). In particular, the concentrations of PO43−, NH4+, K+, and Mg2+ were significantly higher at these lower three sites, whereas those of NO3−, Na+, SO42−, and Ca2+ were significantly lower. The concentrations of PO43− and NH4+, which are potential nutrients for snow algae, were respectively approximately eight- and threefold higher in the lower sites than in the upper sites. However, we detected a significant variation among sites regarding the concentrations of Cl−, which appeared to be unassociated with elevation.
Figure 6. Seasonal and altitudinal variations of major chemical solutes concentrations on the snow surface of Mount Gassan from May to July 2019. (a) Solutes representing potential sources of nutrients for algae. (b) Solutes from sea salt. (c) Solutes from mineral dust.
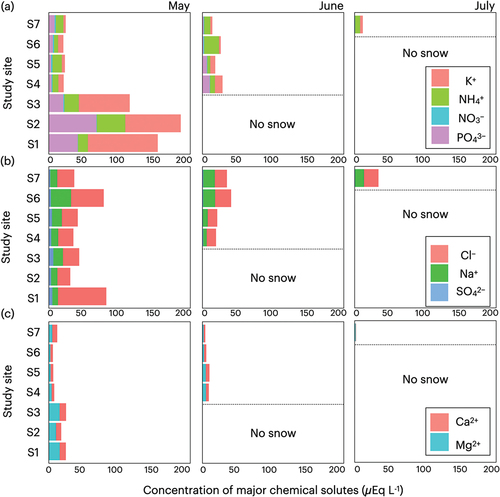
Table 1 Results of statistical analyses of concentrations of each chemical solute among the study sites or months.
In June, we noted distinct differences between forest and alpine sites regarding the compositions of major chemical solutes, with the concentrations of PO43−, K+, Mg2+, and Ca2+ being significantly higher in the upper forest sites (S4 and S5) than those in the alpine sites (S6 and S7). In contrast, the concentrations of NO3−, NH4+, Na+, and Cl− were lower in the forest sites, whereas the concentration of SO42− showed no significant difference between the two areas. Compared with May, the concentrations of PO43−, K+, and Mg2+ recorded in June had increased significantly in the forest sites, whereas at the same sites the concentrations of NH4+, NO3−, Na+, Cl−, and SO42− had undergone significant declines. However, no significant changes were detected with respect to the concentrations of Ca2+. At the alpine sites, we detected a significant increase in the concentration of NH4+ between May and June, whereas there were significant reductions in the concentrations of PO43−, Cl−, SO42−, and Ca2+, although no significant changes were detected regarding the concentrations of NO3−, K+, Na+, and Mg2+.
In July, NH4+, Na+, and Cl− were found to be the predominant chemical solutes detected at the highest alpine site (S7). Compared with June, there were significant reductions in the concentrations of PO43−, SO42−, Mg2+, and Ca2+, whereas no significant changes were observed regarding the concentrations of NO3−, NH4+, K+, Na+, and Cl−.
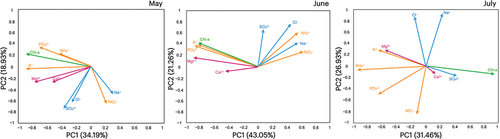
PCA analyses of chlorophyll-a and the major chemical solutes concentration showed that the first two principal components accounted for 53, 64, and 58 percent of the total variance of the original data in May, June, and July, respectively (). PC1 was highly correlated with chlorophyll-a in all three months and with PO43−, K+, and Mg2+ in May and June.
Figure 7. Biplot diagrams of the original variables of chlorophyll-a and major ion concentrations in PC1 and PC2 in each month (May, June, and July).
Spatial and temporal changes in NDVI in the study area
Satellite images revealed differences in NDVI across the study sites and that values changed with the seasons (). In May, we noted a reduction in NDVI with elevation in the lower forest areas from S1 to S3 and that the upper forest and alpine areas (S4–S7) were all characterized by lower index values. Across the entire transect line covering the study sites, NDVI values ranged from −0.06 to 0.55 (mean = 0.08), with those recorded at elevations of between 780 and 1,016 m, encompassing the lower three sites (S1–S3), ranging from 0.06 to 0.55, which were significantly greater than those recorded at higher elevations covering the upper forest and alpine sites (S4–S7), which ranged from −0.06 to 0.14 (t = 18; p = 2.2 × 10⁻¹⁶).
Figure 8. Satellite images (Landsat 8) of the study area of Mount Gassan taken on 13 May, 5 June, and 21 June 2019. The red lines indicate the transect line for sample collections in this study.
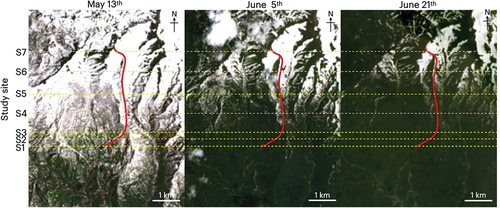
Figure 9. Profiles of NDVI along the transect line shown in in Mount Gassan in 13 May, 5 June, and 21 June 2019. The horizontal distance of the study section is on the y-axis.
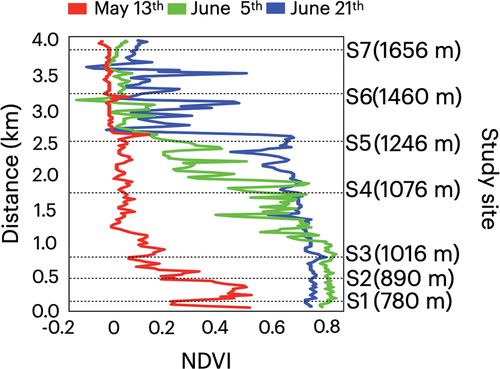
In early June, there was a general increase in NDVI in the forest area with the development of distinct differences between the forest and alpine areas. Values recorded for elevations between 780 and 1,246 m encompassing forest sites S1 to S5 ranged from 0.15 to 0.89 (mean = 0.65), whereas those at elevations covering alpine sites S6 and S7 were significantly lower, ranging from −0.15 to 0.17 (mean = 0.03, t = 21, p = 2.2 × 10⁻¹⁶). In the forested areas, we detected notably higher, apparently saturated, values in the lower forest area (mean = 0.86 at S1 to S3) compared with those in the upper forest sites (mean = 0.53 at S4 and S5). Compared with the values obtained in May, we noted significant increases in values obtained for the forest area (mean = 0.13 in May to 0.65 in early June at S1 to S5, t = −20, p = 2.2 × 10⁻¹⁶), whereas there was a comparatively slight increase in the alpine area (mean = −0.02 in May to 0.03 in early June at S6 and S7, t = −6.2, p = 8.1 × 10⁻⁹ < .001).
In late June, we recorded further increases in NDVI values in the upper area of the study site. NDVI values were also maintained at high levels in the lower forest sites. At elevations between 780 and 1,246 m, values for the forest sites S1 to S5 ranged from 0.47 to 0.85 (mean = 0.74), and for the upper forest area encompassing sites S4 and S5, we detected significant increases from those in early June (0.15 to 0.87 versus 0.47 to 0.79 for early and late June, respectively; t = 6.5, p = 1.6 × 10⁻⁹). In the upper alpine area including S6 and S7, the values were significantly lower than those in the forest sites, ranging from −0.11 to 0.59 (mean = 0.15, t = 34, p = 2.2 × 10⁻¹⁶). However, compared with early June, we noted significant increases in the values recorded for the alpine area in late June (−0.15 to 0.17 versus −0.11 to 0.59 for early and late June, respectively; t = 6.1, p = 1.4 × 10⁻⁸).
Discussion
Seasonal and altitudinal variations in the occurrence of algal blooms
The findings of this study revealed the widespread occurrence of snow algal blooms on the slopes of Mount Gassan, from the lower forest to upper alpine areas, although their prevalence and timing of appearance differed across the selected study sites. Differences in the timing of algal bloom appearance is assumed to reflect the changes in air temperature and snow depths that occur with changing elevation. As suggested by Onuma, Yoshimura, and Takeuchi (Citation2022), snow algae growth on the snow surface occurs in response to the initiation of snow melting. Given that air temperature decreases with an increase in elevation, algal blooms generally develop earlier at lower elevation sites. It has also been suggested that algal blooms commence development on the snow surface when the depth of snow decreases to less than 30 cm, which is sufficiently shallow to enable the migration of motile algal cells from the underlying soil (Hoham Citation1975; Hoham, Mullet, and Roemer Citation1983). However, the findings of the present study would suggest that the depth of snow is not a significant factor influencing the emergence of algal blooms, because we observed the development of blooms in areas in which the depth of snow was certainly greater than 30 cm (e.g., 89 ± 29 cm [mean ± SD] at S3 in May). Consequently, we suspect that regardless of snow depth, algal blooms will develop as long as the snow continues to melt for a sufficient length of time to enable algal growth, although the timing, cell abundance, and pigments of algal blooms may vary, depending on the location and environment of the snow surface.
Our observations regarding the spatial distribution of chlorophyll-a indicate that snow algal blooms were more prominent in the forest area than in the upper alpine zone. We detected distinct differences in concentrations between the forested (S1–S5) and alpine (S6 and S7) areas, with values in the former being approximately twenty-four-fold greater than those in the latter, which accordingly tends to indicate that the presence of trees has an certain influence on algal growth. Indeed, Jones (Citation1991) and Suzuki and Watanabe (Citation2000) suggested that forest canopy potentially influences the growth of algae on the snow surface. In particular, the forest canopy can supply nutrients to the snow surface for algal growth via throughfall and litterfall, which is highlighted by our observations that abundances of the nutrients PO43−, NH4+, and K+ were significantly higher in snow samples collected from the lower forested sites (S1–S3) than in samples collected at higher elevations (S4–S7) in May (). PCA of the chemical solutes in May and June indicated that the first component (PC1) was related to canopy-derived chemical solutes (PO43− and K+) and concentrations of chlorophyll-a (). Consequently, it is possible that the greater prominence of algal blooms in forested areas can be attributed to the input of canopy-derived nutrients.
Seasonal changes in NDVI in the study area would appear to indicate that the occurrence of algal blooms in forested areas is influenced by the budburst of deciduous trees. In May, recorded chlorophyll-a concentrations indicated the occurrence of algal blooms only at the lower three sites in the forested area, coinciding with the elevation range for which the NDVI value was relatively higher (), which corresponds with the timing of the unfolding of leaves of broadleaf deciduous trees. In June, we similarly detected an increase in chlorophyll-a concentrations in the upper forest sites (S4 and S5) concomitant with an increase in the NDVI obtained for this area. These findings therefore suggest that the budburst of deciduous trees contributes to promoting the development of snow surface algal blooms.
With respect to budburst, we noted the deposition of numerous shed bud scales on the snow surface at those sites in which budbreak had occurred (), and this plant litter would presumably provide a source of nutrients for algae on the snow surface (Jones Citation1991; Suzuki and Watanabe Citation2000). These findings overall provide evidence that the emergence of algal blooms is associated with the spring phenology of forest vegetation.
Variations in the color of snow algal blooms
One of the main findings of the present study was the distinct difference in coloration of algal blooms detected in forest and alpine areas, with dark green-, green-, or orange-stained snow (types B, C, and D, respectively) being observed in forested areas but only red-colored snow (type A) being found in the alpine area. According to previous studies, green-colored snow coincided primarily with the presence of mostly motile algae in the genus Chloromonas (e.g., Muramoto et al. Citation2008, Citation2010; Matsuzaki et al. Citation2015, Citation2019), whereas red-colored snow in the alpine zone reflects the occurrence of Sanguina algae, the cells of which contain an abundance of the secondary carotenoid astaxanthin (e.g., Remias, Lütz-Meindl, and Lütz Citation2005; Lutz et al. Citation2016; Nakashima et al. Citation2021). Differences between forest and alpine areas with respect to algal species and pigment profiles could be attributable to the intensity of solar radiation to which the snow surface is exposed (Thomas and Duval Citation1995; Remias, Lütz-Meindl, and Lütz Citation2005; Leya et al. Citation2009). As revealed by the distribution of NDVI, there are pronounced differences between forest and alpine areas with respect to canopy coverage, and given the paucity of tree growth in alpine areas, the snow surface is directly exposed to the incoming solar radiation. Consequently, to ensure survival, snow algae growing under such conditions require an abundant accumulation of photoprotective pigments such as astaxanthins and carotenoids. In contrast, in areas shaded by forest canopy, radiation reaching the snow surface will generally be attenuated to varying degrees. Thus, it can be assumed that presence of a forest canopy plays a prominent role in determining the distinct color of algal blooms.
Differences in the species and pigment compositions of algal blooms developing in forest and alpine sites may also reflect differences in the mode of algal dispersal, although there is currently only limited information available in this regard. Whereas long-distance airborne dispersal has been suggested for Sanguina algae (e.g., Segawa et al. Citation2018), the dispersal of Chloromonas species is believed to be limited to within local areas (Hoham Citation1980; Jones et al. Citation2001). Given that a forest canopy influences atmospheric circulation, it is possible that its presence affects the dispersal, and thus distribution, of algal species across the alpine and forest zones. However, further studies in the regard are necessary to gain an understanding of the underlying processes.
Values obtained for the NDVI of forest areas provide evidence that observed temporal changes in the pigment profiles of algal blooms are associated with budburst of the forest canopy. We found that from May to June, the pigment compositions of algal blooms at sites S4 and S5 in the forest area appeared to change from a dominance of type B to one of type C (), thereby indicating an increase in concentrations of primary carotenoids and a corresponding reduction in pheophytin-a. From May to early June, there was a concomitant increase in the NDVI of this area, coinciding with the unfolding of forest canopy leaves (). This unfolding would have a pronounced effect on the amount of solar radiation filtering through to the forest canopy, and such changes in light condition may contribute to differences in the production of chlorophylls and primary carotenoids for maintenance of effective photosynthesis.
The appearance of orange-colored snow (type D) at site S1 in the forest area is likely to reflect changes in snow surface conditions after the algae have bloomed. In addition to higher absorptions at wavelengths of 460 and 430 nm, type D pigmentation is characterized by a small absorption peak at 480 nm, indicating the presence of astaxanthin (). In this context, our analyses of morphological type composition at site S1 revealed a higher abundance of types Ⅳ and Ⅴ (60 percent), which presumably correspond to the cysts of Chloromonas algae. Because the cysts of snow algae often accumulate secondary carotenoids (Osterrothová et al. Citation2019), we accordingly speculate that the detection of type D at this site may be indicative of the formation of algal cysts, which is generally associated with a deterioration of environmental conditions (Procházková et al. Citation2020). Site S1 was located at the lowest elevation along our study transect, and it is plausible that physical and/or chemical conditions specific to the snow surface at this site contributed to inducing the formation of algal cysts. However, further research is necessary to establish the nature of the factors promoting cyst formation.
Comparisons with algal blooms in other areas
Snow algal blooms have been reported in other mountainous regions in both Japan and the rest of the world. For example, each summer (June and July) red algal blooms commonly appear in the alpine zone of Japan’s Mount Tateyama, located to the southwest of the present study area (Nakashima et al. Citation2021), the algae and pigment compositions of which are consistent with those observed at alpine site S7. Similar algal blooms characterized by red-colored snow have been reported on Mount Asahi, Hokkaido Island, located 500 km north of the present study area (Terashima et al. Citation2017), indicating that red algal blooms might be a common phenomenon in alpine areas of the mountainous regions of Japan. On the other hand, there have been only limited reports regarding the occurrence of algal blooms in forested areas.
Altitudinal variations in snow algal communities consistent with those described here have been reported in mountainous regions of Canada (Engstrom, Yakimovich, and Quarmby Citation2020; Yakimovich, Engstrom, and Quarmby Citation2020), and red algal blooms commonly occur on snowpacks in the alpine regions of Europe and North America (Thomas and Duval Citation1995; Gorton, Williams, and Vogelmann Citation2001; Gorton and Vogelmann Citation2003; Remias, Lütz-Meindl, and Lütz Citation2005; Takeuchi et al. Citation2006; Novis et al. Citation2008; Takeuchi Citation2013; Procházková et al. Citation2019). Similarly, green algal blooms have been reported on snowpacks in forest areas in Europe and North America (Duval and Hoham Citation2000; Hoham et al. Citation2006; Nedbalová, Kociánová, and Lukavský Citation2008; Řezanka, Nedbalová, and Sigler Citation2008), although in most studies, sample collections have been spatially and temporally fragmented. It thus appears that the development of green algal blooms in deciduous forest areas and red algal blooms in upper alpine areas is a common event in mountainous regions worldwide.
Collectively, our observations provide evidence that the appearance and prominence of algal blooms are strongly associated with the vegetation in a given area. In particular, the forest canopy appears to have a pronounced influence in determining the occurrence and pigmentation of algal blooms. Though the vegetation of the selected study area was limited to alpine grassland and deciduous broadleaf (Fagus crenata) forest, mountain ranges in Japan are generally characterized by a more diverse range of vegetation types (Numata, Miyawaki, and Itow Citation1972), which certainly warrant further investigation. For example, the input of nutrients via throughfall and litterfall may vary between the deciduous and conifer forests and among the different tree taxa (Suzuki and Watanabe Citation2000). Furthermore, future climate change is predicted to cause reductions in the amount of snowfall and changes in the vegetation of mountainous areas in Japan (Ionue and Yokoyama Citation1998; Amagai, Kudo, and Sato Citation2018). Despite relatively few reports on snow algal blooms in the mountainous regions of Japan to date, the evidence accumulated thus far suggests that the occurrence of these blooms is a reasonably common seasonal feature on snowy mountains along the west coast of the Japanese Archipelago. It is, however, necessary to undertake further investigation on snow algal blooms in a range of forested areas to gain a better understanding of the associations between vegetation dynamics and algal blooms.
Conclusions
Our investigation on snow algal blooms along an elevational transect on Mount Gassan, Japan, revealed that during the melting season, blooms develop across the assessed elevational range from the lower forested areas to the upper alpine zone. These blooms initially appeared in lower forested sites in May, followed by the upper forest sites in June and subsequently in the upper alpine sites in July. In terms of chlorophyll-a concentrations, those blooms developing in forested areas tended to be more prominent compared with those observed in the alpine area, which we assume to reflect the abundant input of nutrients to the snow surface via throughfall and litterfall from the forest canopy. In forested areas, the commencement of bloom development appeared to coincide with the budburst of deciduous trees, which may be associated with the provision of nutrients derived from shed bud scales deposited on the snow surface when canopy leaves unfold. We also noted a distinct difference in the color of algal blooms developing in forest and alpine sites, with green- or orange-colored snow typically being observed in the former and red-colored snow occurring exclusively in the latter. These colors are associated with differences in the species and pigment compositions of snow algae, which in turn may reflect the response of these algae to light conditions at the snow surface. Moreover, in forest areas, we detected seasonal changes in the pigment composition of algal blooms, which may also be attributable to changes in light conditions coinciding with the budburst of deciduous trees. Collectively, our findings indicate that the emergence of algal blooms is strongly associated with springtime vegetation and tree phenology. To evaluate the response of snow ecosystems to future climate change, it is necessary to undertake further studies to determine the nutrient cycles within the snowpacks, life cycles of different algal species, and interactions between algae and vegetation.
Acknowledgments
We thank Tsubasa Takahashi and Shunsuke Takeuchi for their kind support in the fieldwork on Mount Gassan and two anonymous reviewers for constructive comments. We also thank Editage (www.editage.com) for English language editing.
Disclosure statement
No potential conflict of interest was reported by the authors.
Correction Statement
This article was originally published with errors, which have now been corrected in the online version. Please see Correction http://dx.doi.org/10.1080/15230430.2023.2230052.
Additional information
Funding
References
- Amagai, Y., G. Kudo, and K. Sato. 2018. Changes in alpine plant communities under climate change: Dynamics of snow‐meadow vegetation in northern Japan over the last 40 years. Applied Vegetation Science 21 (4):561–16. doi:10.1111/avsc.12387.
- Bidigare, R. R., M. E. Ondrusek, M. C. Kennicutt, R. Iturriaga, H. R. Harvey, R. W. Hoham, and S. A. Macko. 1993. Evidence a photoprotective for secondary carotenoids of snow algae. Journal of Phycology 29 (4):427–34. doi:10.1111/j.1529-8817.1993.tb00143.x.
- Chazaux, M., C. Schiphorst, G. Lazzari, and S. Caffarri. 2022. Precise estimation of chlorophyll a, b and carotenoid content by deconvolution of the absorption spectrum and new simultaneous equations for Chl determination. The Plant Journal 109 (6):1630–48. doi:10.1111/tpj.15643.
- Duval, B., and R. W. Hoham. 2000. Snow algae in the northeastern US: Photomicrographs, observations, and distribution of Chloromonas spp. (Chlorophyta). Rhodora 102 (911):365–72. https://www.jstor.org/stable/23313387.
- Engstrom, C. B., K. M. Yakimovich, and L. M. Quarmby. 2020. Variation in snow algae blooms in the Coast Range of British Columbia. Frontiers in Microbiology 11:569. doi:10.3389/fmicb.2020.00569.
- Fujii, M., Y. Takano, H. Kojima, T. Hoshino, R. Tanaka, and M. Fukui. 2010. Microbial community structure, pigment composition, and nitrogen source of red snow in Antarctica. Microbial Ecology 59 (3):466–75. doi:10.1007/s00248-009-9594-9.
- Fukushima, H. 1963. Studies on cryophytes in Japan. Yokohama Municipal University. Series C 43:1–146.
- Gorton, H. L., and T. C. Vogelmann. 2003. Ultraviolet radiation and the Snow Alga Chlamydomonas nivalis (Bauer) Wille. Photochemistry and Photobiology 77 (6):608–15. doi:10.1562/0031-8655(2003)0770608URATSA2.0.CO2.
- Gorton, H. L., W. E. Williams, and T. C. Vogelmann. 2001. The light environment and cellular optics of the snow alga Chlamydomonas nivalis (Bauer) Wille. Photochemistry and Photobiology 73 (6):611–20. doi:10.1562/0031-8655(2001)0730611TLEACO2.0.CO2.
- Hoham, R. W. 1975. The life history and ecology of the snow alga Chloromonas pichinchae (Chlorophyta, Volvocales). Phycologia 14 (4):213–26. doi:10.2216/i0031-8884-14-4-213.1.
- Hoham, R. W., J. D. Berman, H. S. Rogers, J. H. Felio, J. B. Ryba, and P. R. Miller. 2006. Two new species of green snow algae from Upstate New York, Chloromonas chenangoensis sp. nov. and Chloromonas tughillensis sp. nov. (Volvocales, Chlorophyceae) and the effects of light on their life cycle development. Phycologia 45 (3):319–30. doi:10.2216/04-103.1.
- Hoham, R. W. 1980. Unicellular chlorophytes-snow algae. In Phytoflagellates, ed. E. R. Cox, 61–84. Holland, New York: Elsevier.
- Hoham, R. W., J. E. Mullet, and S. C. Roemer. 1983. The life history and ecology of the snow alga Chloromonas polyptera comb. nov. (Chlorophyta, Volvocales). Canadian Journal of Botany 61 (9):2416–29. doi:10.1139/b83-266.
- Huete, A., K. Didan, T. Miura, E. P. Rodriguez, X. Gao, and L. G. Ferreira. 2002. Overview of the radiometric and biophysical performance of the MODIS vegetation indices. Remote Sensing of Environment 83 (1–2):195–213. doi:10.1016/S0034-4257(02).
- Ionue, S., and K. Yokoyama. 1998. Estimation of snowfall, maximum snow depth and snow cover condition in Japan under global climate change. Journal of the Japanese Society of Snow and Ice 60 (5):367–78. doi:10.5331/seppyo.60.367.
- Jones, H. G. 1991. Snow chemistry and biological activity: A particular perspective on nutrient cycling. In Seasonal Snowpacks, ed. T. D. Davies, M. Tranter, and H. G. Jones, 173–228. Berlin, Heidelberg: Springer. doi:10.1007/978-3-642-75112-7_8.
- Jones, H. G., J. W. Pomeroy, D. A. Walker, and R. W. Hoham, eds. 2001. Snow ecology: An interdisciplinary examination of snow-covered ecosystems. Cambridge: Cambridge University Press.
- Kol, E. 1968. Algae from the Antarctica. Annales historico-naturales Musei nationalis hungarici 60:71–77.
- Lambertsen, G., and O. R. Braekkan. 1971. Method of analysis of astaxanthin and its occurrence in some marine products. Journal of the Science of Food and Agriculture 22 (2):99–101. doi:10.1002/jsfa.2740220215.
- Leya, T., A. Rahn, C. Lütz, and D. Remias. 2009. Response of Arctic snow and permafrost algae to high light and nitrogen stress by changes in pigment composition and applied aspects for biotechnology. FEMS Microbiology Ecology 67 (3):432–43. doi:10.1111/j.1574-6941.2008.00641.x.
- Lichtenthaler, H. K. 1987. Chlorophylls and carotenoids: Pigments of photosynthetic biomembranes. In Methods in enzymology, ed. L. Packer and R. Douce, Vol. 148, 350–82. Orlando: Academic Press.
- Lutz, S., A. M. Anesio, R. Raiswell, A. Edwards, R. J. Newton, F. Gill, and L. G. Benning. 2016. The biogeography of red snow microbiomes and their role in melting Arctic glaciers. Nature Communications 7 (1):1–9. doi:10.1038/ncomms11968.
- Malik, M. S., J. P. Shukla, and S. Mishra. 2019. Relationship of LST, NDBI and NDVI using Landsat-8 data in Kandaihimmat Watershed, Hoshangabad, India. Indian Journal of Geo Marine Sciences 48 (1):25–31. http://nopr.niscair.res.in/handle/123456789/45657.
- Matsuzaki, R., H. Kawai-Toyooka, Y. Hara, and H. Nozaki. 2015. Revisiting the taxonomic significance of aplanozygote morphologies of two cosmopolitan snow species of the genus Chloromonas (Volvocales, Chlorophyceae). Phycologia 54 (5):491–502. doi:10.2216/15-33.1.
- Matsuzaki, R., H. Nozaki, N. Takeuchi, Y. Hara, and M. Kawachi. 2019. Taxonomic re-examination of “Chloromonas nivalis (Volvocales, Chlorophyceae) zygotes” from Japan and description of C. muramotoi sp. nov. PLoS One 14 (1):e0210986. doi:10.1371/journal.pone.0210986.
- Müller, T., W. Bleiß, C. D. Martin, S. Rogaschewski, and G. Fuhr. 1998. Snow algae from northwest Svalbard: Their identification, distribution, pigment and nutrient content. Polar Biology 20 (1):14–32. doi:10.1007/s003000050272.
- Muramoto, K., S. Kato, T. Shitara, Y. Hara, and H. Nozaki. 2008. Morphological and genetic variation in the cosmopolitan snow alga Chloromonas nivalis (Volvocales, Chlorophyta) from Japanese mountainous area. Cytologia 73 (1):91–96. doi:10.1508/cytologia.73.91.
- Muramoto, K., T. Nakada, T. Shitara, Y. Hara, and H. Nozaki. 2010. Re-examination of the snow algal species Chloromonas miwae (Fukushima) Muramoto et al., comb. nov. (Volvocales, Chlorophyceae) from Japan, based on molecular phylogeny and cultured material. European Journal of Phycology 45 (1):27–37. doi:10.1080/09670260903272607.
- Nakashima, T., J. Uetake, T. Segawa, L. Procházková, A. Tsushima, and N. Takeuchi. 2021. Spatial and temporal variations in pigment and species compositions of snow algae on Mt. Tateyama in Toyama Prefecture, Japan. Frontiers in Plant Science 12. doi:10.3389/fpls.2021.689119.
- Nedbalová, L., M. Kociánová, and J. Lukavský. 2008. Ecology of snow algae in the Giant Mts./Ekologie snezných ras Krkonos. Opera Corcontica 45:59–68.
- Novis, P. M., R. W. Hoham, T. Beer, and M. Dawson. 2008. Two snow species of the quadriflagelate green alga chlainomonas (chlorophyta, Volvocales): Ultrastructure and phylogenetic position within the Chloromonas clade. Journal of Phycology 44 (4):1001–12. doi:10.1111/j.1529-8817.2008.00545.x.
- Numata, M., A. Miyawaki, and D. Itow. 1972. Natural and semi-natural vegetation in Japan. Blumea 20 (2):435–96.
- Onuma, Y., K. Yoshimura, and N. Takeuchi. 2022. Global simulation of snow algal blooming by coupling a land surface and newly developed snow algae models. Journal of Geophysical Research: Biogeosciences 127 (2):e2021JG006339. doi:10.1029/2021JG006339.
- Osterrothová, K., A. Culka, K. Němečková, D. Kaftan, L. Nedbalová, L. Procházková, and J. Jehlička. 2019. Analyzing carotenoids of snow algae by Raman microspectroscopy and high-performance liquid chromatography. Spectrochimica Acta Part A: Molecular and Biomolecular Spectroscopy 212:262–71. doi:10.1016/j.saa.2019.01.013.
- Procházková, L., T. Leya, H. Křížková, and L. Nedbalová. 2019. Sanguina nivaloides and Sanguina aurantia gen. et spp. nov. (Chlorophyta): The taxonomy, phylogeny, biogeography and ecology of two newly recognizsed algae causing red and Orange snow. FEMS Microbiology Ecology 95 (6):fiz064. doi:10.1093/femsec/fiz064.
- Procházková, L., D. Remias, W. Bilger, H. Křížková, T. Řezanka, and L. Nedbalová. 2020. Cysts of the snow alga Chloromonas krienitzii (Chlorophyceae) show increased tolerance to ultraviolet radiation and elevated visible light. Frontiers in Plant Science 11:617250. doi:10.3389/fpls.2020.617250.
- R Core Team 2018. R: A language and encironment for statistical computing. Vienna: R Foundation for Statistical Computing. Available at: https://www.R.project.org/
- Remias, D., U. Lütz-Meindl, and C. Lütz. 2005. Photosynthesis, pigments and ultrastructure of the alpine snow alga Chlamydomonas nivalis. European Journal of Phycology 40 (3):259–68. doi:10.1080/09670260500202148.
- Řezanka, T., L. Nedbalová, and K. Sigler. 2008. Unusual medium-chain polyunsaturated fatty acids from the snow alga Chloromonas brevispina. Microbiological Research 163 (4):373–79. doi:10.1016/j.micres.2006.11.021.
- Schneider, C. A., W. S. Rasband, and K. W. Eliceiri. 2012. NIH image to Image J: 25 years of image analysis. Nature Methods 9:671–75. doi:10.1038/nmeth.2089.
- Segawa, T., R. Matsuzaki, N. Takeuchi, A. Akiyoshi, F. Navarro, S. Sugiyama, T. Yonezawa, and H. Mori. 2018. Bipolar dispersal of red-snow algae. Nature Communications 9 (1):1–8. doi:10.1038/s41467-018-05521-w.
- Segawa, T., K. Miyamoto, K. Ushida, K. Agata, N. Okada, and S. Kohshima. 2005. Seasonal change in bacterial flora and biomass in mountain snow from the Tateyama Mountains, Japan, analyzed by 16S rRNA gene sequencing and real-time PCR. Applied and Environmental Microbiology 71 (1):123–30. doi:10.1128/AEM.71.1.123-130.2005.
- Spijkerman, E., A. Wacker, G. Weithoff, and T. Leya. 2012. Elemental and fatty acid composition of snow algae in Arctic habitats. Frontiers in Microbiology 3:380. doi:10.3389/fmicb.2012.00380.
- Suzuki, K., and Y. Watanabe. 2000. Chemical changes of snowpack by microbiological activity and incubation experiment of Scenedesmus acuminatus. Journal of the Japanese Society of Snow and Ice 62 (3):235–44. doi:10.5331/seppyo.62.235.
- Takeuchi, N. 2013. Seasonal and altitudinal variations in snow algal communities on an Alaskan glacier (Gulkana glacier in the Alaska range). Environmental Research Letters 8 (3):035002. doi:10.1088/1748-9326/8/3/035002.
- Takeuchi, N., R. Dial, S. Kohshima, T. Segawa, and J. Uetake. 2006. Spatial distribution and abundance of red snow algae on the Harding Icefield, Alaska derived from a satellite image. Geophysical Research Letters 33 (21):21. doi:10.1029/2006GL027819.
- Tanabe, Y., T. Shitara, Y. Kashino, Y. Hara, and S. Kudoh. 2011. Utilizing the Effective Xanthophyll Cycle for Blooming of Ochromonas smithii and O. itoi. PLos One. doi:10.1371/journal.pone.0014690.
- Terashima, M., K. Umezawa, S. Mori, H. Kojima, and M. Fukui. 2017. Microbial community analysis of colored snow from an alpine snowfield in northern Japan reveals the prevalence of Betaproteobacteria with snow algae. Frontiers in Microbiology 8:1481. doi:10.3389/fmicb.2017.01481.
- Thomas, W. H., and B. Duval. 1995. Sierra Nevada, California, USA, snow algae: Snow albedo changes, algal-bacterial interrelationships, and ultraviolet radiation effects. Arctic and Alpine Research 27 (4):389–99. doi:10.1080/00040851.1995.12003136.
- Welschmeyer, N. A. 1994. Fluorometric analysis of chlorophyll a in the presence of chlorophyll b and pheopigments. Limnology and Oceanography 39 (8):1985–92. doi:10.4319/lo.1994.39.8.1985.
- Yakimovich, K. M., C. B. Engstrom, and L. M. Quarmby. 2020. Alpine snow algae microbiome diversity in the coast range of British Columbia. Frontiers in Microbiology 11:1721. doi:10.3389/fmicb.2020.01721.
- Yallop, M. L., A. M. Anesio, R. G. Perkins, J. Cook, J. Telling, D. Fagan, J. MacFarlane, M. Stibal, G. Barker, C. Bellas, et al. 2012. Photophysiology and albedo-changing potential of the ice algal community on the surface of the Greenland ice sheet. The ISME Journal 6 (12):2302–13. doi:10.1038/ismej.2012.107.
- Yamaguchi, S., O. Abe, S. Nakai, and A. Sato, 2011. Recent fluctuations of meteorological and snow conditions in Japanese mountains. Annals of Glaciology 52 (58):209–215. doi:10.3189/172756411797252266.
- Yoshimura, Y., S. Kohshima, and S. Ohtani. 1997. A community of snow algae on a Himalayan glacier: Change of algal biomass and community structure with altitude. Arctic and Alpine Research 29 (1):126–37. doi:10.1080/00040851.1997.12003222.