
 ?Mathematical formulae have been encoded as MathML and are displayed in this HTML version using MathJax in order to improve their display. Uncheck the box to turn MathJax off. This feature requires Javascript. Click on a formula to zoom.
ABSTRACT
A unique permafrost thermal state was examined at Maunakea, Hawaiʻi. The presence of the permafrost was determined in 1969. Mean annual ground surface temperature (MAGST) is significantly above zero at permafrost sites, between +2°C and +5°C. This indicates that subsurface thermal processes control and preserve the permafrost state (strong thermal resistance). Year-round high-resolution (1-cm intervals) active layer temperature monitoring reveals the thermal dynamics. Unlike permafrost at higher latitudes, the large thermal offset may be caused by nonconductive heat transfer in the active layer. The permafrost survived many decades because of snow cover, the structure of the ground, and hydraulic permeability. However, over the past fifty years the extent of permafrost has declined. Other periglacial geomorphology has been described in permafrost-free areas mainly above 3,500 m.a.s.l., where freeze–thaw action is ubiquitous. The seasonal frost depth is 40 to 60 cm, and seasonal and diurnal creeping has moved stones about 0.45 to 4.3 cm/year over the last fifty-two years. This research clarified the thermal dynamics of the active layer and the presence of the mountain permafrost at unusually low elevations in the tropics.
Introduction
Permafrost in Hawaiʻi was sensationally reported in 1970 (Woodcock, Furumoto, and Woollard Citation1970; Woodcock Citation1974). Even today, it is surprising that permafrost is present at such low elevation in the tropics. Since then, other cryo-environments were described in the Hawaiian Archipelago, in the form of freeze–thaw cycles and stone stripes on Haleakalā, Maui (Noguchi, Tabuchi, and Hasegawa Citation1987), and ice caves on Maunaloa (Pflitsch et al. Citation2016; Teehera et al. Citation2018). The permafrost on Maunakea was revisited by Schorghofer, Leopold, and Yoshikawa (Citation2017, Citation2018). Freeze–thaw cycles and snow phenomenon have been observed on four mountains in the Hawaiian archipelago: Hualalai (2,521 m), Haleakalā (3,055 m), Maunaloa (4,169 m), and Maunakea (4,207 m; Schorghofer, Kantar, and Nogelmeier Citation2014). Isolated permafrost was found on north-facing slopes of the Maunakea summit area around the block fields or embryonic rock glacier type materials above 4,000 m.a.s.l. The last minor eruption on Maunakea occurred about 4,500 years BP (Porter Citation1979). However, this volcanic activity occurred in a very limited area, not at summit craters. Most of the volcanic activity calmed down during the late Pleistocene (Porter Citation1979). Maunakea had at least four major glaciations that coincide with isotope stages 2, 4, 6, and 8 (Porter Citation1979). The equilibrium-line altitude (ELA) was about 3,750 m during the last glaciation (Late Makanaka Glaciation) of the summit plateau, and cinder cones around the summit remained as nunataks (Porter, Stuiver, and Yang Citation1977; Porter Citation1979). Porter (Citation2005) estimated a current ELA of 4,715 ±95 m.a.s.l., about 930 m ±100 m higher than during the Last Glacial Maximum and 510 m above Maunakea summit.
Elsewhere, the lower limit of alpine permafrost (LLAP) is around 5,200 to 5,300 m.a.s.l. at 19.8° north and south latitudes (Yoshikawa Citation2017). Other LLAPs of similar latitude on the planet are Mexico (5,300 m, 19.0° N) and northern Chile to southern Peru (5,250 m, 16.2° S–22° S) mountains (Vizoto Citation2018; Mena et al. Citation2021; Yoshikawa et al. Citation2021). Compared with these other areas, the wet (snow-covered) season is very different on Maunakea. During summer months, the Intertropical Convergence Zone is strongly affected, and snow cover is common in Mexico and Chilean to Peruvian mountains but infrequent in Hawaiʻi. Also, elevation of the mountains in Hawaiʻi is much lower and frost periods due to snow during summer are rare. Mexican and Chilean/Peruvian mountains are well below freezing during winter months without snow insulation and protected from strong solar radiation during summer months by a snow cover (Vizoto Citation2018; Mena et al. Citation2021; Yoshikawa et al. Citation2021). Yoshikawa et al. (Citation2020) estimated that the LLAP elevations are very close to ELA in the Peruvian Andes and Kilimanjaro. The thermal state and characteristics of mountain permafrost are different in the tropics than at higher latitudes. Tropical high-altitude environments have a unique thermal balance between land and atmosphere, such as lower atmospheric pressure with stronger incoming solar radiation and limited liquid precipitation (Yoshikawa et al. Citation2021). The permafrost or low ground temperature is sustained by reduced solar radiation absorption due to high albedo terrain (such as a bright tephra layer or long periods of thin snow cover) or penitentes (Yoshikawa et al. Citation2021).
Hawaiʻi (Big Island) is located at tropical latitude (19°–20° N) where it is affected by subtropical jet streams during winter months that can bring precipitation to the summit. During this wet season, the North Pacific high-pressure system is often interrupted by larger-scale rain-bearing weather systems. Storms known as “Kona lows” and frontal passages bring widespread rain and snow to the mountain (Caruso and Businger Citation2006). During summer months, the Intertropical Convergence Zone stays just south of the islands and conditions are drier, except during tropical hurricane invasion. Snow cover is common in winter and rare in summer, and summer snow cover often melts away within a few days (Blumenstock and Price Citation1967). However, winter storm snow cover sometimes lasts into spring to early summer, especially during La Niña years (O’Connor et al. Citation2015). During the El Niño phenomenon, the Hadley circulation strengthens in the Eastern Pacific and the islands experience drier conditions, resulting in little snowfall on Maunakea (Zhang, Hamilton, and Wang Citation2017). Partial snow cover records are available since the Little Ice Age (LIA), based on historical narratives and weather bureau records (Schorghofer, Kantar, and Nogelmeier Citation2014; Martin et al. Citation2019). In general, snow cover periods were longer on Maunakea and Maunaloa during the LIA compared with today.
The thermal offset is defined as the difference between mean annual temperature at the permafrost table and at the ground surface (Goodrich Citation1982; Burn and Smith Citation1988), in general caused by the difference in frozen/unfrozen thermal conductivities of the materials. The thermal offset depends on the thermal properties of the soil and the water content. Summer ground surface temperature has a significant influence on the thermal offset in higher latitude regions (Romanovsky and Osterkamp Citation1995). Where the active layer is deeper, the thermal offset is usually larger and the thawing index (or positive degree days) at the ground surface is also higher (Burn Citation1998). However, we observed that a different type of thermal regime controls the thermal offset on Maunakea. Tropical high-altitude regions have greater temperature variations diurnally than seasonally or interannually. Here, the thawing index concept is not suitable and rarely studied for active layer thermal properties (Mena et al. Citation2021). Our high-resolution temperature measurements reveal details of the freezing and thawing process of the tropical active layer and the thermal offset.
Also, cold air can be trapped in rocky block fields that allow air to freely convect in pore spaces (Goering and Kumar Citation1996; Sawada, Ishikawa, and Ono Citation2003), also known as “kurum” in Russia. This morphology can cause a very strong thermal offset; for example, +7°C to +8°C in Chara, Southern Siberia (Romanovskii et al. Citation1991; Sergueev et al. Citation2007; Sergeev et al. Citation2016), where typically permafrost survived as low as 300 to 1,000 m below LLAP (Harris and Pedersen Citation1998; Sawada, Ishikawa, and Ono Citation2003). Harris and Pedersen (Citation1998) described fast temperature changes in the active layer and summarized theories that could explain unusually large differences in ground temperatures in coarse blocky material. The “chimney effect” includes evaporation and sublimation of water/ice in the block deposit. The “Balch effect” (Balch Citation1900) is based on the idea of a simple replacement of warm air with cold air within the blocky pore spaces due to the density difference. Although Maunakea is not high enough for frequent development of penitentes, the snow cover pattern benefits the thermal conditions of the ground and convection cooling (Goering and Kumar Citation1996).
After a long hiatus after Woodcock’s pioneering work, systematic research on permafrost on Maunakea resumed. Micrometeorological data were collected from 2007 to 2010; temperatures above and next to the permafrost have been monitored since 2012, and electrical resistivity tomography and ground penetrating radar surveys were conducted in 2015 and 2016 (Eaton and Businger Citation2014; Schorghofer, Leopold, and Yoshikawa Citation2017; Schorghofer, Businger, and Leopold Citation2018). Since the publication of these works, in situ temperature probes and high-resolution active layer temperature monitoring were added to understand the permafrost and cryosphere environments at the mountain in underground current thermal state, which are a main focus of this work.
Methods
Study area
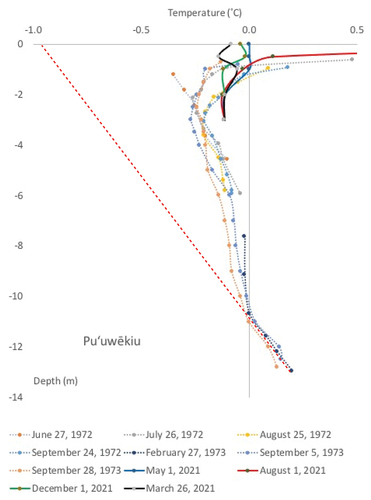
We investigated the state of the permafrost on the sacred mountain with methods that involve no or minimal disturbance to the environment. Woodcock (Citation1974) documented permafrost in Pu’uwēkiu (Summit Cone); the frozen body extended horizontally for several decameters in a north–south direction (). He also measured ground temperature including in the 11.5-m-thick permafrost (BH3 in and ). The permafrost temperature was only a few tenths of a degree Celsius below the melting point at the time (Woodcock Citation1974). We located Woodcock’s drill sites (), including his nearly 1-m-deep excavated shaft (). The shaft still existed in 2000 but has been filled in since. We reinstrumented the area inside of the Pu’uwēkiu crater that once had permafrost. Four of Woodcock’s boreholes are still in place; we refer to them as pipe 1 and boreholes 2, 3, and 5 (). We cleaned several of the preexisting boreholes and emplaced temperature sensors to depths of up to 6 m (borehole 2). To obtain in situ permafrost temperatures, two additional 25-mm-diameter boreholes were drilled up to 3 m. Boreholes were cleaned and created in November 2020 at Pu’uwēkiu and Pu’uhaukea (Goodrich Cone). Both sites contain very ice-rich permafrost (), and some pumice was in the core. Our sensors reached 6 m at BH2, 3 m at BH3, 4 m at BH5, 5 m at borehole 6, and 3 m at Pu’uhaukea. Elsewhere, we emplaced data loggers with temperature sensors at various shallow depths and recorded several years of continuous ground temperature data ().
Figure 1. Geomorphological features and drill sites (stars) are shown in this map. Stone stripes are often associated with snow drift (moisture) and soil conditions. The extent of late snow deposits is based on year 2021.
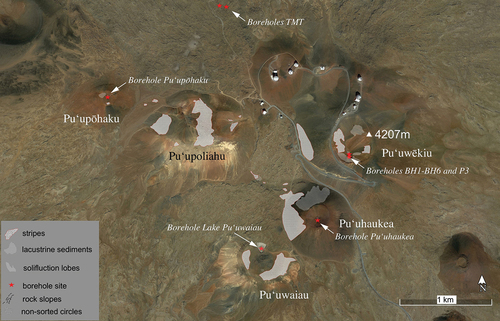
Figure 2. Permafrost distributions and drill sites at Pu’uwēkiu and Pu’uhaukea craters. Permafrost is located at the north-facing lower slope and the base of the craters. A close-up profile of Pu’uwēkiu site is also shown with information from the 1970s (Woodcock Citation1974) and 2022 (this study). BH (borehole)1, BH2, and BH3 lie on the same (approximately north–south) transect, whereas BH5 and BH6 do not. Frozen ground and ground ice were confirmed at BH3, BH6, HK (Pu’uhaukea borehole)1 but not at BH2 and BH5. Cyan dashed line indicates the bottom of either the active layer or the seasonal frost layer, “??” means unknown bottom boundary.
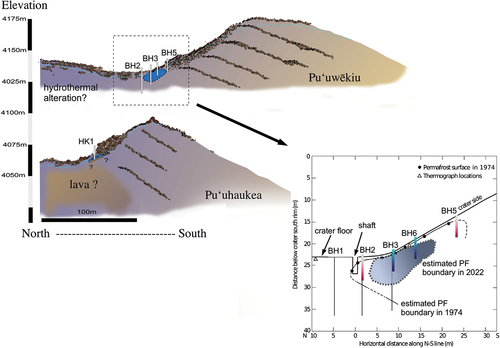
Figure 3. Historical drill sites established by Alfred Woodcock. (a) Picture of borehole site (29/2/1973): shaft (under the plywood) and thermograph location (Woodcock Archives Citation2007). In 2000, the base of the thermograph was still present (b) (photo taken on 5 February 2000 by K. Yoshikawa) and shaft (c) nearly 1-m depth excavated (photo taken on 5 February 2000 by K. Yoshikawa). Ice-bonded (cemented) permafrost was seen at the base of the shaft in 2000. These old structures were removed in the early 2000s.
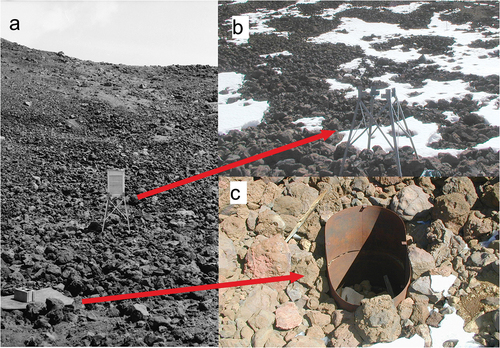
Figure 4. (a) Condensation (hoar) frost formed due to moving warm air escaping along large pore spaces in early winter. Upper part of active layer has dynamic air convection layer (photo taken in October 2018 by K. Yoshikawa). (b) Drill core bit (25 mm diameter) with ice-rich permafrost at BH6 drill site at 5-m depth on 4 November 2020.
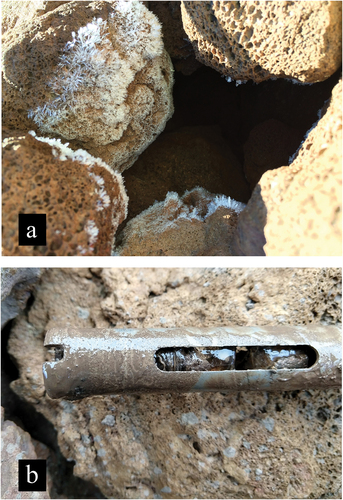
Table 1. Current and historical boreholes site information at the top of Maunakea area.
According to the unpublished field books from Alfred Woodcock, BH3 was drilled on 15 to 16 December 1971 (11.3 m deep, 38 mm diameter), and he measured temperatures from April 1972 to September 1973 (Woodcock Archives Citation2007). He used three thermistor cables of different length but only one thermistor cable at a time for the different depths, which took several hours (one depth to measure temperature to another depth typically waiting 5–10 minutes each depth and serious drifting occurred). Measurements stopped in September 1973 because the hole wall was corrupted. Casing was installed only in the upper few meters. BH2 was drilled to 13.4 m on 10 to 16 October 1972. Woodcock did not find any ice in this core; however, the temperature was very close to or possibly below zero up to 2- to 6-m depth (Woodcock Archives Citation2007; ).
Instrumentation
Active layer and permafrost temperature were recorded with dataloggers at multiple depths over the years 2012 to 2022. Permafrost monitoring temperature sensors were installed at depths of 0 to 40 m (1-cm intervals), 0.5 to 1 m (10-cm intervals), and 2, 3, 4, and 5 m. The digital integrated circuit temperature sensors were installed at 1-cm intervals for active layer monitoring in the upper 40 cm at borehole 3 and at Pu’uhaukea. Deep permafrost temperatures were measured with thermistors and logged hourly, primarily with Onset dataloggers (model U12-008 12-bit, changed to UX120-006 14-bit in August 2021). The accuracy of the temperature measurements was around 0.06°C after calibration (0.20°C from 0°C to 50°C at factory specification). Active layer temperatures were measured with forty to fifty DS18B20 sensors. DS18B20 digital thermometers provide 12-bit Celsius temperature measurements (0.06°C resolution). The DS18B20 sensor’s factory-based accuracy information is insufficient (0.5°C accuracy from −10°C to +85°C); however, after ice bath calibration the sensor provided better accuracy of around 0.12°C to 0.30°C. The DS18B20 communicates over a one-wire bus that by definition requires only one data line (and ground) for communication with a central microprocessor that is programmable with Arduino Pro Mini. Freeze–thaw frequencies were calculated above and below 0°C based on BH5 (5 m away from the permafrost boundary), where temperatures have been continuously monitored at the ground surface and at 50-cm depth since November 2013.
Woodcock also established boreholes in a nearby cinder cone, Pu’upōhaku, and in Lake Waiau sediment. Neither location has permafrost, but the measurements provide historical temperature information (Woodcock and Groves Citation1969; Woodcock Archives Citation2007). We briefly monitored temperatures in a 15-m-deep borehole at the construction site of the Thirty Meter Telescope.
Photogrammetric analysis and field surveys
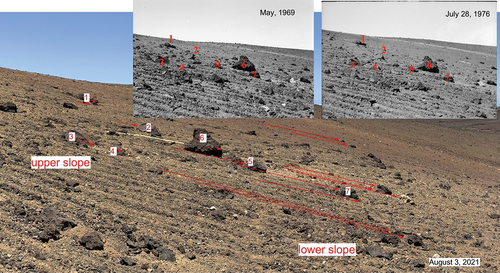
Annual stone movements and mass wasting were measured by photogrammetric analysis using a Sony α6300 camera with a 20mm lens in 2021. Pictures taken included an additional in situ 1-m-long scale along the seven target stone tracks. This focal length reproduced the perspective in Woodcock’s pictures taken in 1965, 1969 (), 1970, 1971, 1972, 1975, 1976 (), and 1977 (Woodcock Archives Citation2007) but with measurement accuracy confirmed through use of a reference meter stick in the picture. All pictures were taken from the same stable benchmark in Waiau Crater. A total of four aligned benchmarks were established in the 1960s at sites that resisted frost heaving or slope wasting over the last fifty years. We otherwise followed Woodcock’s photographic methods. The sizes of seven identified stones were measured (length, width, height) and pictures from 1969, 1976, and 2021 were used. Several white pumice stones weathered and broke down in the span of over fifity years. The slope angle was measured using hand level and distance and was between 14° to 15° with a 2° aspect (almost north-facing). This study location has one of the most developed stone stripes and the most frequent freeze–thaw cycles observed worldwide. It is an ideal monitoring site, with observations starting in the 1960s.
Figure 5. Photos from 1969 and 1976 (upper right; Woodcock Archives Citation2007) and on 3 August 2021 with a similar perspective. Seven of the rocks are recognized in all three pictures and are also seen in additional archived pictures (). Rock ID is referenced on .
A general field survey was employed mainly for mapping stone stripes and other periglacial-related geomorphology in the summit area. In addition to stone stripes, solifluction lobes, nonsorted circles, and brock slopes were observed. The occurrence of these periglacial features is based on availability of moisture; for example, snowbanks or lacustrine sediments.
Results
Borehole temperature and active layer dynamics
Borehole temperatures of the Maunakea summit area are shown in , including borehole data from the 1960s to 1970s from Woodcock’s field notebooks. The zero annual amplitude temperature (ZAAT) varies between +6.5°C and −0.15°C among nine boreholes (3- to 21-m depth depending on the thermal properties of soil and moisture contents; ). The mean annual air temperature on the summit of Maunakea is +4°C (Giambelluca et al. Citation2013). Ground temperature at 15-m depth was +5.35°C in the borehole on the north side of the summit plateau (4,014 m.a.s.l., Thirty Meter Telescope construction site). This temperature can be considered typical ground temperature at the flat surface of the mountain’s summit area. Similar ground temperatures were measured in the water-saturated ground beneath Lake Waiau and at Pu’upōhaku where the ZAAT is +6.5°C and +4.2°C, respectively (; Woodcock and Groves Citation1969). The density of water is highest at about 4°C, and at this depth the temperature of the stagnant water will match the ground temperature. Toward the bottom of the crater boreholes, at Pu’uwēkiu (4,100 m.a.s.l.) and Pu’uhaukea (4,000 m.a.s.l.), colder conditions prevail and mean annual ground surface temperature (MAGST) is +2.49°C to +4.74°C. This is the result of less incoming solar radiation (north-facing slopes and shadowing from the crater walls) that lower annual temperatures by 2°C to 3°C compared to the surrounding summit area.
Figure 6. Borehole temperature records (envelope of annual temperature) at multiple summit sites. Red dots mark the mean annual ground temperature (MAGT). Permafrost is recognized in the upper plots (Pu’uhaukea, BH3, BH6), although all three borehole temperatures were only slightly below zero. Pu’uwēkiu crater floor holes (BH1 and BH2) are not perennially frozen (lower left). BH2 was about zero curtain in 1972 up to 6-m depth but is at around 1°C today. Zero annual amplitude temperature (ZAAT) of the other non-permafrost boreholes are between 1°C and 6°C (lower middle and right). Pu’upōhaku borehole (ZAAT: 4.2°C) coincides with the heaviest water density; the water level fluctuates. Lake Waiau plot shows 2.75 m of water body (blue shaded) and ZAAT below the lake is about 6.5°C at 7-m depth.
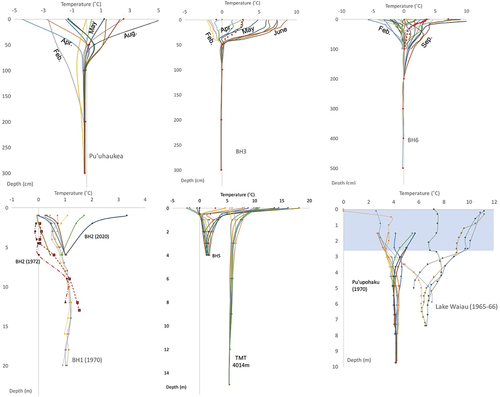
Geothermal gradients are not easily measured at such shallow boreholes, but Woodcock’s measurements at Pu’uwēkiu beneath the permafrost, at 11 and 13 m below the surface, suggest a temperature gradient of about 66°C/km. Compared with the 1970s, permafrost temperatures at 3-m depth may be a few tenths of a degree (0.1°C–0.15°C) warmer today; however, the difference is not significant, because the accuracy and drift of the thermistors during the 1970s are uncertain ().
Figure 7. Temperatures at BH3 in 1972–1973 (dotted lines) and 2021 (solid lines). At 3-m depth, temperatures were about 0.1°C warmer in 2021, but this is within the uncertainty of the thermistor measurements in the 1970s. Mean annual ground surface temperature (MAGST) of −1°C for subpermafrost geothermal gradient (66°C/km) is extrapolated to the surface, assuming the thermal conductivity of the subpermafrost layer (red dashed line).
Active layer thickness was 0.7 m to 1.4 m in November 2021 (; BH3 and BH5). At BH3 it appears to have been shallower (around 1 m in 1972), but the difference may again not be significant. The constraints on the size of the permafrost body () are in good agreement with what was inferred from geophysical surveys (Schorghofer, Leopold, and Yoshikawa Citation2017). More than 80 percent of the active layer was filled with refrozen snowmelt every year, and that mainly controlled the following summer’s active layer thickness ( and ). MAGST was higher (+4.74°C and +2.95°C) in El Niño years (2015–2016 and 2018; ). Given the large offset, the active layer has strong thermal resistance. The active layer was dry at the end of summer; however, an ice-filled (bonded) active layer was seen at the beginning of spring. shows an example of high-resolution active layer temperature dynamics in 30-minute intervals on 3 August 2021. The highest surface temperature was +25°C and the lowest was slightly below freezing; the mean diurnal temperature was about +10°C, and a strong temperature difference (offset) at depths between 30 and 50 cm was apparent. Spring (April to June) active layer deepening depends on the melting rate of ice in the pore spaces (). The ice originated from snowmelt water during winter months or early spring snow when ground temperature was still below freezing. Recent frequent satellite images captured detailed snow conditions at least every week, and Terra and Sentinel-2 satellites have been calculating the Normalized Difference Snow Index. The Normalized Difference Snow Index for Maunakea usually reaches its peak in the first week of February; then a sun crust layer develops at the surface, and the snow disappears in April to early May. Small penitentes develop in very limited areas where snow remains in drifts along a ridge area into May. The ground begins thawing immediately after the snow disappears and remains unfrozen through August (). However, in El Niño years, hardly any snow covers the ground surface, whereas in strong La Niña years snow sometimes stays until the end of July (in 1975; Woodcock Archives Citation2007).
Figure 8. High-resolution (1-cm intervals) temperature logging reveals active layer dynamics at BH3. These examples represent typical days (red filled circle: mean annual ground temperature (MAGT); red empty circle: mean diurnal ground temperature (MDGT)). 3 August 2021 is a typical summer day; most of the day had positive temperatures at the upper 40 cm. 14 January 2022 is a typical winter day and the day before the snow cover formed; all depths fluctuated between positive and negative temperatures. 15 February 2022 represents a typical snow-covered period; minimal diurnal fluctuation at all depths and persistent negative temperatures. 16 March 2022, the day after the snow cover disappeared, the ice-bonded (cemented) active layer began to thaw. 16 April 2022, one month after snow cover disappeared and an early spring day, 17 cm had already thawed. 16 May 2022, two months after snow had melted, 32 cm of thawed active layer.
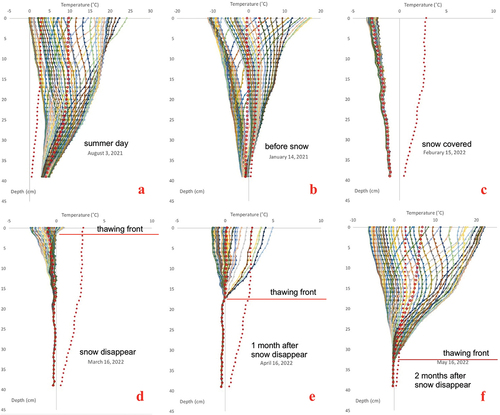
Figure 9. Active layer diurnal temperature structure on 3 August 2021 at BH3 and physical structure of the ground. Temperature profiles suggest convection and the high soil conductivity indicates ice content. MAGST = mean annual ground surface temperature.
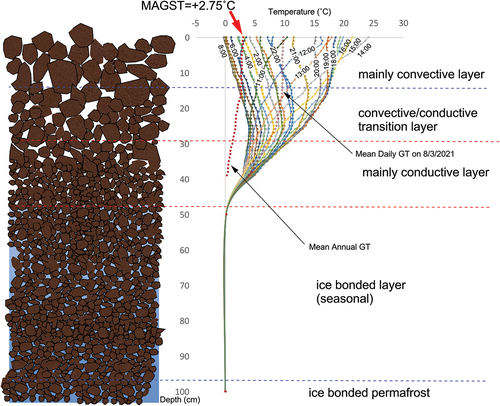
Figure 10. (a) Time-averaged temperature profiles at different times of the year. Thermal offset (red circle) at BH3 site is 2.49°C in 2021–2022. A strong seasonal offset is seen in winter (orange), in summer (blue), and during the spring thawing period (green). The time period with a snow cover (gray) has the opposite temperature gradient. (b) Five years of the mean daily temperature difference between permafrost table and the near surface at BH3. The mean annual ground surface temperature (MAGST) (thermal offset) is typically 2.5°C to 3°C and higher (>4.5°C) in El Niño years.
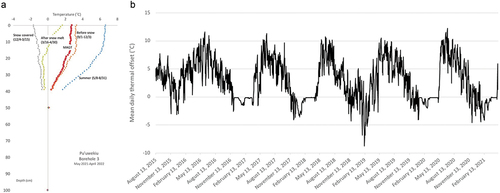
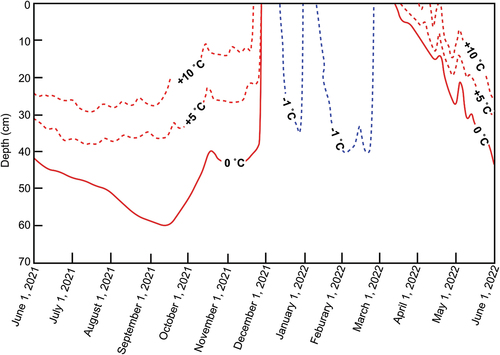
Figure 11. Isotherms (−1°C, 0°C, +5°C, +10°C) of the daily maximum temperature profile in the active layer at BH3 as a function of time (1 June 2021–31 May 2022). The thawing front slowly deepens in spring–summer (April–September) by consuming latent heat of ice-cemented active layer and then rapidly changes to negative over the entire layer in fall (end of November), something not readily seen in daily temperature profiles at higher latitude permafrost areas.
Diurnal active layer temperature fluctuations, mean diurnal ground temperature (MDGT), and mean annual ground temperature (MAGT) at each depth are shown in at different times of the year. In the middle of summer, the MDGT was over 10°C on the surface. For comparison, the (annual mean) thermal offset was 2.78°C (in 2021–2022). The difference in MAGT across the upper 16 cm was only 0.2°C, and this layer is interpreted as freely convecting. provides an interpretation of the role of each layer. The transition and conductive layers (total about 33 cm thick between 16- to 49-cm depth), with a difference of 2.46°C in MAGT, contributed most to the thermal offset (). In the last five years, the mean diurnal thermal offset was largest typically after snowmelt to early summer months (), which suggests that latent heat effects may contribute to the thermal buffering (Nelson et al. Citation1985).
Tropical storm impact (tropical hurricane)
Active layer deepening has been observed as a result of intense summer rainstorms in the Arctic (Douglas, Turetsky, and Koven Citation2020). Summer storms can trigger thawing of near-surface ground and provide extra heat to consume latent heat. We had the unusual, yet fortunate, opportunity to evaluate this process for the tropical hurricane event during late August 2018 (Beven and Wroe Citation2019). Hurricane Lane approached Hawaiʻi, and this powerful tropical storm brought torrential rainfall to Maunakea as well as other islands. The storm was the wettest on record in Hawaiʻi, with peak rainfall accumulations of 1,473 mm/day along the eastern slopes of Maunakea, and an uncalibrated summit telescope weather station recorded 200 mm/day. Lane reached an initial peak as a Category 4 hurricane on 18 August 2018. The hurricane weakened slightly before regaining strength and reaching Category 5 status on 22 August to the south of Hawaiʻi Island. Thereafter, the hurricane turned north and slowed. During this period, heavy rains battered much of the Hawaiian Islands. The hurricane degraded to a tropical depression by 28 August before dissipating the following day. Lane did not make landfall; however, Lane’s peak rainfall total was the second highest recorded from a tropical storm within the United States, surpassed only by Hurricane Harvey in the Caribbean Sea in the preceding year.
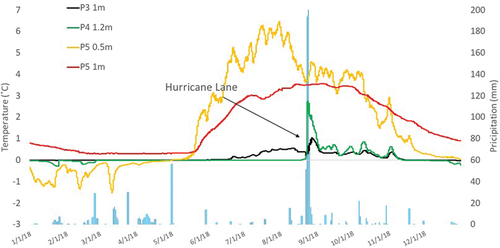
shows Hurricane Lane’s rain impact of permafrost area at Pu’uwēkiu. Borehole P3 (about 30 cm from BH3) is located on permafrost and the 1-m-depth sensor was already thawed when Lane approached on 24 August. At the P3 site, temperature jumped by about 0.7°C (from 0.3°C to 1°C) in four days and then returned to “normal” over the next ten days. P4 (near the edge of permafrost, 5 m higher elevation than P3) showed a stronger and more sudden increase from zero curtain to +2.5°C within a day and back in ten days as well. P4 at 1.2-m depth was already partially thawed on 19 August, with hurricane-related pre-rain (8 mm of precipitation on this day). No temperature change was observed at P5 (BH5 with an absence of permafrost) on 24 August. These three monitoring sites are within 10-m distance and temperature signals varied greatly, perhaps due to different amounts of water entering the boulder-covered pipes. As a result of this exceptional tropical storm, the active layer was somewhat impacted by the storm precipitation. However, no significant deepening of the active layer was observed. After September 2018, ground thermal characteristics returned to “normal” behavior, with freezing trends and subsequent seasonality of ground thermal characteristics similar to other years. Thus, heavy precipitation is not expected to degrade the permafrost on Maunakea or considerably increase its active layer dynamics.
Figure 12. Hurricane Lane’s rain impact on permafrost area at Pu’uwēkiu. Over 200 mm of liquid precipitation was recorded on 24 August 2018, and P3 (next of the BH3) and P4 (between BH3 and BH5) temperatures jumped at this time but not at P5 (next of the BH5). P3, 4, and 5 sites stand for the temperature sensors outside of the borehole casing.
Geomorphology
Mass wasting is the gravity-driven downslope movement of surficial materials. A simple classification of common mass wasting processes is applied to examine slow movements such as creep and solifluction, and more rapid movements including active layer detachment failures. Both types of mass wasting, slow and rapid, are observed in the area of the summit craters.
Periglacial geomorphological mapping was employed at the summit area of Maunakea (). Small (a few centimeters) to medium-size (30- to 50-cm stripe intervals) stone stripes are widely seen in this area and are mainly caused by diurnal ice needles. Highly developed needle ice requires: (1) a fine- to coarse-grained mixture of soil, such as volcanic loam soil–type composition; (2) frequent freeze–thaw actions near the surface where cryo-suction moves soil moisture to the freezing front; and (3) moderate moisture that supplies near-surface soil, ideally near snowbanks or after storm events (Noguchi, Tabuchi, and Hasegawa Citation1987). The Maunakea summit area has ideal conditions for these three ice-forming requirements, especially above 3,500 m.a.s.l. shows 137 (2019–2020) to 258 (2018–2019) freeze–thaw cycles near the permafrost site (BH 5) at 4,100 m.a.s.l. Seasonal frost layer depth was 40 to 60 cm at non-permafrost areas such as the Pu’uwēkiu crater rim, Pu’uwaiau, and Pu’upōhaku. Inside Pu’uwēkiu, more freeze–thaw cycles are counted during El Niño years (2015–2016 and 2018–2019) because of the lack of winter snow. However, this is not advantageous to the formation of stone stripes, because generally no moisture is available from the drier surface in El Niño years (, ). There are freeze–thaw cycles in summer months (e.g., June–September: yellow graph lines in ); however, these summer months are relatively warmer, and the drier ground surface precludes formation of needle ice.
Figure 13. Oceanic Niño Index (ONI; right axis; orange graph lines) and freeze–thaw cycles (left axis; bars) at BH5 site. Yellow bars are for June to September, and blue bars represent the remaining eight months. ONI values are from the National Weather Service website (Citation2022): https://origin.cpc.ncep.noaa.gov/products/analysis_monitoring/ensostuff/ONI_v5.php. El Niño corresponds to an ONI of more than +0.5°С (red screen) and La Niña to less than −0.5°C (blue screen). In general, El Niño–Southern Oscillation (ENSO) was strongly affected by low-pressure system in Hawaiʻi, which affected winter snow cover (black arrow at top). Snowless winters had increased freeze–thaw frequency.
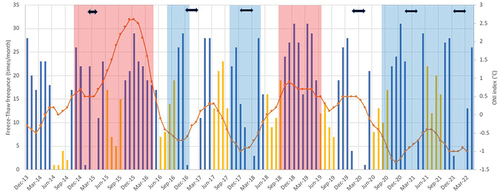
Table 2. Over eight years of monthly and annual frequency of the freeze–thaw cycles at Pu’uwēkiu crater.
The seasonal frost layer acts as an impermeable layer after the snow melts. After meltwater saturates the diurnally thawed layer, the excess water plays a special role for development of the needle ice. Moisture is efficiently supplied to the needle ice on the surface () by the cryo-suction process. At this time of the year, surface temperature frequently reaches 0°C and cryo-suction occurs near the ground surface, which moves soil moisture and generates needle ice. This will typically occur until three to four weeks after the last snow melts.
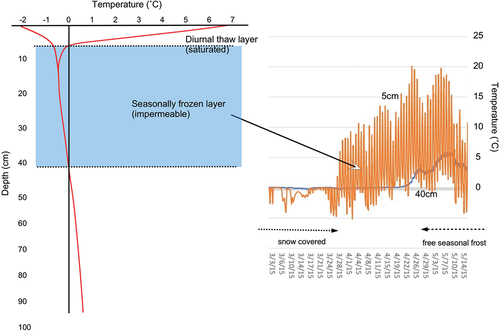
Figure 14. Surface (−5 cm) and 40 cm annual ground temperatures and underground seasonal frost structure at Pu’uwaiau slope site. Maximum frost depth is typically 40 to 60 cm and the diurnal thaw layer is <10 cm thick. This diurnal thaw layer becomes fully saturated with snowmelt and forms an impermeable seasonal frost layer. This period is ideal for the development of stone stripes and, on steep slopes, also for active layer detachments.
In addition to stone stripes, oversaturation of the diurnal thaw layer can occasionally cause active layer detachment () in spring. Needle ice also formed small patterned ground in flat areas () instead of stripes. Solifluction lobes are well-developed on north-facing slopes by the fine to coarse soil materials (). Also, nonsorted circles (frost boil) were observed at several places at the bottom of the crater or the base of the valley with previously lacustrine sediments ().
Figure 15. Geomorphologic features at the summit area. (a) Nonsorted circles (frost boil) at clay-rich crater floor. (b) Needle ice along the stripes at base of Pu’uhaukea on 6 February 2011. Image credit: OMKM Ranger. (c) Stone stripes. (d) Gelifluction slope of north-facing cone. (e) Active layer detachment at steep slopes. (f) Heterogeneous frozen table just beneath stripes. The frost table is deeper at the sections with bigger pebbles. (g) Unusual larger (1-m intervals) stripes. (h) Small patterned ground at flat area with needle ice. (i) Stripes and moisture source.
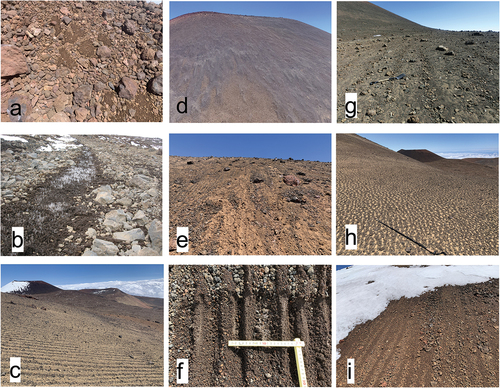
Photo analysis of the mass wasting (stone velocity) of the seven stones showed 23.4 to 223.8 cm (about 0.5–4.3 cm/year) movement over the last fifty-two years at 14° to 15° north-facing slopes at Pu’uwaiau crater (, ). Sixteen uniquely shaped stones were identified in Woodcock’s 1969, 1976, and 2021 pictures. Seven of the sixteen stones were selected and examined in detail for detentions and moving distance over the last fifty-two years (). These stones are large enough to be recognized even after fifty years, whereas several white pumices were completely broken down to pebbles. The lower slope stone velocity was faster than the upper slope velocity, but the slope gradient was similar, as seen in . Surface area and pressure to the ground were calculated for each stone and compared with velocity (). However, we did not see a strong relationship between the two.
Table 3. Fifty-six years of slope mass wasting records of seven stones at Pu’uwaiau cone.
Embryonic rock glacier–type rock fields or coarse blocky material was seen near the steep side of the bottom of Pu’uwekiu and Pu’uhaukea craters. These rock fields have large pore spaces and, in general, seasonal and perennial ice-rich conditions. These are the only places on Maunakea where we confirmed permafrost today (Schorghofer, Leopold, and Yoshikawa Citation2017). The origin of the rocks is unknown, however. They are most likely rock falls and mass movement (gelifluction) during the deglaciated period since the last ice age. The thickness of this rock field is relatively thin (<1 m) and narrow and stretches only 10 to 20 m from the crater slope. Under the rocky materials, no boulders were encountered during drilling operations.
Discussion
Permafrost development and chronology
Outside of Hawaiʻi, most tropical mountain permafrost is protected from strong solar radiation during summer months by snow cover (Vizoto Citation2018; Mena et al. Citation2021; Yoshikawa et al. Citation2021). On Maunakea, no such protection from strong shortwave (solar) radiation occurs, which contributes additional heat to the ground during summer months. Instead, on Maunakea, cold winter air may be inhibited from releasing the ground heat to the atmosphere by blocking snow cover. Due to these opposite conditions, Hawaiʻi would not appear to be favorable for permafrost formation.
Another thermal characteristic is the large thermal offset of about 3°C to 5°C at the permafrost sites on Maunakea. Typical high-latitude (strong seasonal) thermal offset is 1°C to 5°C due to the difference between frozen and unfrozen states of the thermal conductivities of the active layer materials (Williams and Smith Citation1989). shows seasonal thermal offsets during different periods of the year at BH3 in 2021–2022. The “before snow” period of the ground temperatures has a similar trend as the MAGT, which is also the case for the “summer” period. These two periods have a deeper and drier active layer. This is interpreted as an upper free convective layer that immediately cools the ground and exhausts warm air from pore spaces, which then causes condensation near the surface (). Especially during colder radiant nights without wind, cooler temperatures quickly penetrate the lower ground, as is typically seen in October or November. In contrast, during winter “snow-covered” months, the seasonal offset is negative, and this is the only time period with temperature gradients opposite to the trend of the annual mean temperature curve. The thermal offset is close to 3°C (and about 4.7°C during El Niño years; ). This is one of the highest thermal offsets in the world, and the structure of the ground surface is well protected by thermal resistance combined with conductive and nonconductive heat transfer involving latent heat () from the deeper ice-rich permafrost layer (Nelson et al. Citation1985). MAGST is around +1°C to +2°C in the colder areas of the summit such as north-facing slopes. MAGST was almost the same in BH3 (presence of permafrost) and BH5 (absence of permafrost); see . Thermal offset of the adjacent non-permafrost site (BH5) was +1°C to +2°C. The large thermal offset (>2°C) maintains permafrost conditions, and this is related to the physical structure of the ground, such as ice-bonded (cemented) permafrost and recharging snowmelt in the active layer with an impermeable permafrost layer.
When the permafrost formed, the MAGST could have been at most −1°C lower than today. Current MAGST is +2.7°C but is −1°C when the geothermal gradient (66°C/km) is extrapolated to the surface, assuming the same thermal conductivity as the underlying subpermafrost layer (, red dashed line). The thermal conductivity of the ice-rich permafrost must have been higher than that of the unfrozen subpermafrost layer, and the geothermal gradient therefore smaller, so the 11 m of permafrost formed at an MAGST higher than −1°C. The ground must have been at negative temperatures over at least 11-m thickness for the frozen layer to be established.
Ice-rich (bonded) permafrost can form when there is an impermeable layer underneath or a higher groundwater level. Hawaiian basalt is extremely porous (Maciolek Citation1969), but one perennial and two ephemeral ponds are known on the Maunakea summit plateau (Leopold, Morelli, and Schorghofer Citation2016; Schorghofer, Leopold, and Klasner Citation2023). Both permafrost sites on Maunakea might have had somewhat impermeable layers under the ice-rich permafrost (). Also, there could have been a higher groundwater level at the Pu’uwēkiu crater floor based on current groundwater level, occasionally observed at BH2, and adjacent lacustrine sediments.
Drilling operations in the 1970s and today found more than 20 m of materials of low hydraulic conductivity (hydrothermally altered) near the permafrost site at Pu’uwēkiu and also a very hard layer (possibly lava) 3 m belowground at Pu’uhaukea’s permafrost borehole. These potentially impermeable layers beneath the porous boulder and rock materials might have helped preserve a relict ice body. Within a sediment, it is possible to have a water or air density gradient that is generated by the temperature gradient. In this case, free convection can potentially occur when there are colder temperatures at the surface and relatively warmer temperatures at depth, sometimes for water but certainly for air. shows active layer thermal dynamics profiles throughout the year (1 June 2021–31 May 2022). Once snow covered the surface on 28 November 2021, diurnal temperature fluctuations were minimal and subzero temperatures prevailed in all layers. This rapid freezing of the ground is an unusual feature of this site. Elsewhere the freezing front typically deepens much slower. Even at this site, after snow melts in spring, the zero temperature isotherm penetrates only slowly, and this thawing process is typically explained by conductive heat transfer while consuming latent heat. However, on Maunakea, the fall freezing process is unique and homogenous in depth. The large thermal offset may be caused by nonconductive (freezing) and conductive (thawing) heat transfer differences and block field pore space geometries.
Woodcock (Citation1974) recognized that radiatively cooled air pools in Pu’uwēkiu during calm nights, resulting in air temperatures far below those outside the crater. Based on air temperature time series from a temporary weather station on the crater floor, Schorghofer, Businger, and Leopold (Citation2018) estimated that these events occur about 3 percent of the time and lower the mean annual air temperature by only 0.1°C. Even if this translated directly into a lowering of the MAGST by the same amount, it would be an insignificant contribution to permafrost conditions. However, micromorphology (block fields) can be a more important cooling phenomenon than macromorphology (crater; Harris and Pedersen Citation1998).
Vapor transport is very common in porous and permeable materials such as in the upper part of the active layer (Nelson et al. Citation1985). Snow also demonstrates the effects of vapor transport during winter (Sturm Citation1991). Vapor transport is difficult to monitor (Woo Citation1982; Smith and Burn Citation1987), but there is clear evidence of vapor emission from the ground and the production of hoarfrost crystals at the base of the snowpack or in the mouth of rocks pore spaces (; Mackay Citation1983; Hinkel et al. Citation1996). Convection occurring in association with the movement of moist pore air or soil water can produce significant heat transfer that is not driven directly by temperature gradients. Consequently, it is generally not possible to account for these convective effects using a conduction-only model (Kane et al. Citation2001). This unique thermal offset on the tropical mountain may be associated with convection and heterogeneous geometry of the latent heat–driven process in addition to conventional conductivity differences.
A survey of historical accounts, mostly writings by eyewitnesses, suggests that in the first half of the nineteenth century, snow covered Maunakea typically many months of the year, often even in summer (Schorghofer, Kantar, and Nogelmeier Citation2014). For example, Brigham (Citation1909) noted that the summit of Maunakea “is covered with cinder cones, most of them with deep craters filled all the year with snow …” based on observations over the preceding decades (Schorghofer, Kantar, and Nogelmeier Citation2014). James Macrae reported snow on the summit during his visit in June 1825. James Jarves visited the summit in the summer of 1840, reporting that “snow or rather ice lay in the chasms, in spots in masses ten feet deep. … Snow falls during storms throughout the summer, but rarely remains long. Some, doubtless, in sheltering situations, survives the season” (Schorghofer, Kantar, and Nogelmeier Citation2014).
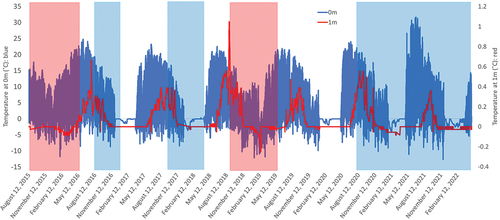
Also, historical investigations indicate fewer El Niño events between 1920 and the 1940s (Webb and Magi Citation2022), coincident with reports of long periods of snow cover (Martin et al. Citation2019). Snow often covered Pu’uwēkiu crater even in summer in the mid-nineteenth century (Martin et al. Citation2019), and Lake Waiau was frequently frozen thick enough for ice skating between 1900 and the 1960s (Bryan Citation1935; Woodcock Archives Citation2007). In contrast to the present-day climate, snow once filled these craters far more often and reflected sunlight from the crater interiors, which may have created stable permafrost conditions as recently as in the first half of the twentieth century. Regional climate model calculations by Zhang, Hamilton, and Wang (Citation2017) suggested that snowfall will be increasingly rare on Maunakea in the future. Martin et al. (Citation2019) pointed out an increase in ground temperature in the summer of 2016, following a snowless winter, compared to winters with significant snow cover. and show seven years of simultaneous ground temperature data and overlaying El Niño–Southern Oscillation (ENSO) cycles. ENSO cycles may affect near-surface ground temperature and hydrological condition due to different precipitation patterns. Snow cover and snow meltwater are important processes that can decide the presence or absence of permafrost. During El Niño years, typically no or little snow falls in winter, and bare ground is exposed most of the winter months on Maunakea. At other times (ENSO neutral or La Niña periods), snow covered the permafrost area typically from December to April. During or between snowmelt periods, the active layer was cold enough to refreeze snow meltwater in areas with an impermeable permafrost layer below the ice-bonded (cemented) active layer. This helps the ground freeze quicker, due to higher thermal conductivity of ice compared to air in pore spaces, which contributes to the offset. During El Niño years (2015–2016 and 2018), ground surface was significantly warmer (about 2°C warmer than average) due to a lack of snow cover ().
Figure 16. Seven years of simultaneous ground temperature data at P3 (colored lines) and El Niño–Southern Oscillation (ENSO) cycles (red and blue screens). El Niño years (red screen), which usually have no winter snow cover.
Diurnal and seasonal mass wasting
The benefit of using Woodcock’s 1960s to 1970s slope pictures, when compared to recent ones, is that they provide the longest stone movement record reported in the published literature. Stone velocity (Vs) has been observed and reported all over the world over relatively short durations (less than a few years). Three types of mass wasting are recognized on Maunakea: (1) rapid process: active layer detachment () that occurs after snowmelt each year (Vs: a few centimeters to over 10 m per day or per event); (2) slow process: stripes () and small patterned ground () by needle ice heaving (Vs: 15–20 cm/year max.); (3) entire slope creeping or gelifluction () or over 1-m large-scale stripes () by seasonal and diurnal ice lenses (Vs: 0.45–4.3 cm/year) based on fifty-two years of movement of seven big stones. The largest stone (45 × 50 × 35 cm) moved 23.4 cm in the last fifty-two years (0.45 cm/year), indicating that less moisture is underneath the stone, with fewer ice lenses forming from a limited seasonal frost layer supply of moisture (). Small pebbles and stones along the stripes are lifted by about 10 to 20 mm by needle ice forming in the morning during winter periods () but not necessarily every day. Based on the following equation, 2 cm of needle ice forming daily over thirty days is able to move stones about 15 cm per year. This is consistent with what is observed in the study area. Stripes (needle ice heaving) are important to have freeze–thaw actions and moisture supply that intensely and efficiently satisfy the request after snowmelt periods (). The stone velocity of the surface movements can be expressed by the following formula (Matsuoka Citation2001):
where VS gives the annual surface velocity (cm/yr) and the annual sum of heave amounts perpendicular to the slope surface (cm), θ is slope angle, and C is a constant (Higashi and Corte Citation1971; Washburn Citation1979; Matsuoka Citation1998) that is smaller than 1, because the soil cohesion yields some retrograde movement that reduces Vs. Where needle ice activity prevails, rotational movement or toppling of ice needles intensifies the effect of the inclination.
There are large differences for seven of the long-term monitored stone velocities over the last fifty-two years (see ). The slowest stone is the largest (stone 6) and only moved 23.4 cm, whereas the smallest stone (stone 4) moved 43.2 cm. The fastest stone (stone 7) is relatively small and moved 223.8 cm. No relations between size, surface area, weight of the stones, or pressure to the ground versus velocity were observed (), but stones on somewhat lower slopes are faster moving. Two types of mass wasting are recognized in these movements. Slower stones are moving mainly due to heaving by the ice lenses. Ice lenses are found in the diurnal freezing layer (5–10 cm) as well as in the seasonal frost layer (40–60 cm). Both types of ice lenses have the same genesis: a freezing front moves slowly down from the surface, but their lifetimes are quite different. In the permafrost area some ice lenses form bottom-up, by freezing from the permafrost table toward the surface, but this is not the case in the permafrost-free area. The freezing front in segregation ice (ice lenses or needle ice) creates suction for moisture. For needle ice, the freezing front stays on the surface. In this case, surface materials (loam, pebble, or sand) greatly affect the heaving, whereas ice lens formation is less sensitive to the properties of the surface material. Faster moving stones were considered due to ice lens and needle ice both mixing heaving processes.
Summary
Permafrost and active layer dynamics were evaluated on Maunakea, Hawaiʻi. The presence of permafrost has been established in this unique tropical mountain for over fifty years. Unlike on other tropical mountains, the permafrost on Maunakea is about 1000 m lower than the LLAP and the MAGST is always positive (+1°C to +3°C). The presence of permafrost implies unique ground conditions and snow cover patterns. This article is dedicated to understanding the current and past thermal state of the permafrost on Maunakea and the history of permafrost research on the mountain.
Currently, permafrost is present at the base of the north-facing crater walls of Pu’uwēkiu and Pu’uhaukea (Woodcock, Furumoto, and Woollard Citation1970; Schorghofer, Leopold, and Yoshikawa Citation2017). Permafrost thickness was about 11 m in 1972; however, based on BH2 and 1-m-depth shaft locations, it shrank vertically and horizontally in the last fifty years, in agreement with geophysical results (Schorghofer, Leopold, and Yoshikawa Citation2017). The 11-m-thick permafrost was already relict, because it would not be able to form in current climate conditions. ZAAT could have been as low as −1°C for 11 m of perennial ice to form based on the current subpermafrost geothermal gradient. This is not unexpected; it could have occurred during the LIA or with brief cool periods as recent as the early twentieth century. Once cold enough to establish 11-m-thick ice-bonded (cemented) permafrost, modern climate can keep it frozen even though the MAGST is always positive (up to +5°C). The permafrost site has strong thermal resistance. The highest thermal offset measured was +4.7°C in 2015–2016 (El Niño year). In typical years, thermal offsets were close to +3°C. MAGSTs were similar at adjacent non-permafrost sites (+2°C to +5°C), where zero annual amplitude ground temperatures were slightly above 0°C. Outside the cinder cones, annual mean ground and air temperatures are around +4°C to +6°C at this elevation; however, north-facing slopes, nocturnal cold air trapping, and the albedo effect of the snow cover make ground temperatures 2°C to 3°C lower at the base of the north-facing slopes. The remaining, unusually large, difference (the thermal offset between MAGST and the top of the permafrost) must be due to processes in the active layer. Temperature profiles and convection inferred from condensation (hoar) frost suggest that nonconductive heat transfer plays a major role for the thermal offset. Snow cover is an important contributor to the thermal offset, leading to an ice-cemented active layer from snowmelt and reducing solar radiation to sustain a cool surface more so than due to its insulation effect.
Typical seasonal frost depth is about 0.4 to 0.6 m in summit areas today, and the diurnal freeze–thaw depth reaches 5 to 15 cm after the snow disappears. This water-saturated diurnal freeze–thaw layer supplied water to the surface freezing front observed every night during April and May 2021 and 2022. This period of water saturation is the most efficient time to form needle ice and stone stripes; with pebbles moving 15 to 20 cm/year. Seasonal and diurnal frost creeping (mainly by ice lenses) moved rocks downslope 0.45 to 4.3 cm/year between 1969 and 2021. These values are based on the photogrammetry analysis. An exceptional summer rainstorm in 2018 had no lasting impact on permafrost conditions, and such storms are not expected to be an important factor for the absence or presence of the permafrost.
Data sharing statement
Temperature time series data are available at https://zenodo.org/record/6727701.
Acknowledgments
We thank the Office of Maunakea Management (OMKM), the Department of Land and Natural Resources (DLNR), and the Natural Area Systems (NARS) commission for permits to conduct this research. We are also indebted to Jessica Kirkpatrick, Robert Madrigal, Stephanie Nagata, Professor Donald Thomas (University of Hawaii), Mik Vincent, and Joy Yoshina for help with logistics and fieldwork. We appreciate development and testing of the prototype of the Arduino hardware and high-density thermal sensors that were designed and programmed at Austral University, Chile (Pablo Iribarren); Atacama Environment, Chile (Guillermo Azocar); and Hokkaido University, Japan (Toshio Sone). We also thank the three anonymous reviewers who provided insightful comments and suggestions that improved this article.
Disclosure statement
No potential conflict of interest was reported by the author(s).
Additional information
Funding
References
- Balch, E. S. 1900. Glaciers or freezing caverns. Philadelphia, PA: Allen, Lane, and Scott.
- Beven, J. L., II, and D. Wroe. 2019. National Hurricane Center tropical cyclone report: Hurricane lane. Technical Report EP142018, NOAA National Hurricane Center.
- Blumenstock, S., and S. Price. 1967. Climate of Hawaii. Washington, DC: Climates of the States, US Department of Commerce.
- Brigham, W. T. 1909. The Volcanoes of Kilauea and Maunaloa on the Island of Hawaiʻi. Memoirs of the Bernice Pauahi Bishop Museum Memorandum (Vol. No.4, pp. 222).
- Bryan, E. H., Jr. 1935. Climbing Hawaii’s highest mountain. In Paradise of the Pacific, September issue, 17–21. Honolulu, Hawaiian Islands: Press Pub. Co.
- Burn, C. R. 1998. Field investigation of permafrost and climatic change in Northwest North American. Proceedings of the 7th International Conference on Permafrost, 107–20, Yellowknife, Canada, Nordicana, Quebec.
- Burn, C. R., and C. A. S. Smith. 1988. Observations of the “thermal offset” in near-surface mean annual ground temperatures at several sites near Mayo, Yukon Territory, Canada. Arctic 41:99–104. doi:10.14430/arctic1700.
- Caruso, S. J., and S. Businger. 2006. Subtropical cyclogenesis over the Central North Pacific. Weather and Forecasting 21:193–205. doi:10.1175/WAF914.1.
- Douglas, T. A., M. R. Turetsky, and C. D. Koven. 2020. Increased rainfall stimulates permafrost thaw across a variety of interior Alaskan boreal ecosystems. npj Climate and Atmospheric Science 3:28. doi:10.1038/s41612-020-0130-4.
- Eaton, L. A., and S. Businger. 2014. Using a snow drift model to simulate eolian drift and snowfall on the summit of Maunakea, Hawaii. Arctic, Antarctic, and Alpine Research 46:719–34. doi:10.1657/1938-4246-46.4.719.
- Giambelluca, T. W., Q. Chen, A. G. Frazier, J. P. Price, Y.-L. Chen, P.-S. Chu, J. K. Eischeid, and D. M. Delparte. 2013. Online rainfall atlas of Hawaiʻi. Bulletin of the American Meteorological Society 94:313–16. doi:10.1175/BAMS-D-11-00228.1.
- Goering, D. J., and P. Kumar. 1996. Winter-time convection in open-graded embankments. Cold Regions Science and Technology 24:57–74. doi:10.1016/0165-232X(95)00011-Y.
- Goodrich, L. E. 1978. Some results of a numerical study of ground thermal regime. Proceedings of the Third International Conference on Permafrost, 29–34, National Research Council of Canada, Ottawa.
- Goodrich, L. E. 1982. The influence of snow cover on the ground thermal regime. Canadian Geotechnical Journal 19:421–32. doi:10.1139/t82-047.
- Harazono, Y., M. Yoshimoto, A. Miyata, Y. Uchida, G. L. Vourlitis, and W. C. Oechel. 1995. Micrometeorological data and their characteristics over the Arctic Tundra at Barrow, Alaska during the summer of 1993. Miscellaneous Publication of the National Institute, Agro-Environmental Sciences 16:1–215.
- Harris, S. A., and D. E. Pedersen. 1998. Thermal regimes beneath coarse blocky material. Permafrost and Periglacial Processes 9:107–20. doi:10.1002/(SICI)1099-1530(199804/06)9:2<107::AID-PPP277>3.0.CO;2-G.
- Higashi, A., and A. E. Corte. 1971. Solifluction: A model experiment. Science 171:480–82. doi:10.1126/science.171.3970.480.
- Hinkel, K. M., F. E. Nelson, Y. Shur, J. Brown, and K. R. Everett. 1996. Temporal changes in moisture content of the active layer and near-surface permafrost at Barrow, Alaska: 1962-1994. Arctic and Alpine Research 28 (3):300–10. doi:10.2307/1552109.
- Kane, D. L., R. E. Gieck, and L. D. Hinzman. 1990. Evapotranspiration from a small Alaskan Arctic watershed. Nordic Hydrology 21:253–72. doi:10.2166/nh.1990.0019.
- Kane, D. L., K. M. Hinkel, D. J. Goering, L. D. Hinzman, and S. I. Outcalt. 2001. Non-conductive heat transfer associated with frozen soils. Global and Planetary Change 29:275–92. doi:10.1016/S0921-8181(01)00095-9.
- Leopold, M., A. Morelli, and N. Schorghofer. 2016. Subsurface architecture of two tropical alpine desert cinder cones that hold water. Journal of Geophysical Research 121:1148–60. doi:10.1002/2016JF003853.
- Maciolek, J. A. 1969. Freshwater lakes in Hawaii. Verhandlungen der Internationalen Vereinigung für Theoretische und Angewandte Limnologie 71:386–91.
- Mackay, J. R. 1983. Downward water movement into frozen ground, western Arctic Coast, Canada. Canadian Journal of Earth Sciences 20:120–34. doi:10.1139/e83-012.
- Martin, J., N. Schorghofer, K. Yoshikawa, and F. L. Klasner. 2019. Snow cover in Hawaii (1893-1953) and its effect on ground temperature. Arctic, Antarctic, and Alpine Research 51:148–54. doi:10.1080/15230430.2019.1600963.
- Matsuoka, N. 1998. Modelling frost creep rates in an alpine environment. Permafrost and Periglacial Processes 9:397–409. doi:10.1002/(SICI)1099-1530(199810/12)9:4<397::AID-PPP302>3.0.CO;2-Q.
- Matsuoka, N. 2001. Solifluction rates, processes and landforms: A global review. Earth-Science Reviews 55:107–34. doi:10.1016/S0012-8252(01)00057-5.
- Mena, G., K. Yoshikawa, N. Schorghofer, C. Pastén, F. A. Ochoa, Y. Yoshii, M. Doi, T. Miyata, H. Takahashi, G. Casassa, et al. 2021. Freeze–thaw cycles and snow impact at arid permafrost region in Chajnantor Volcano, Atacama, northern Chile. Arctic, Antarctic, and Alpine Research 53 (1):60–66. doi:10.1080/15230430.2021.1878739.
- National Weather Service (NWS). 2022. https://origin.cpc.ncep.noaa.gov/products/analysis_monitoring/ensostuff/ONI_v5.php. Accessed October 1, 2022.
- Nelson, F. E., S. I. Outcalt, C. W. Goodwin, and K. M. Hinkel. 1985. Diurnal thermal regime in a peat-covered palsa, Toolik Lake, Alaska. Arctic 39 (4):310–15. doi:10.14430/arctic2150.
- Noguchi, Y., H. Tabuchi, and H. Hasegawa. 1987. Physical factors controlling the formation of patterned ground on Haleakala, Maui. Geografiska Annaler. Series A, Physical Geography 69 (2):329–42. doi:10.1080/04353676.1987.11880219.
- O’Connor, C. F., P.-S. Chu, P. Hsu, and K. Kodama. 2015. Variability of Hawaiian winter rainfall during La Niña events since 1956. Journal of Climate 28:7809–23. doi:10.1175/JCLI-D-14-00638.1.
- Pflitsch, A., N. Schörghofer, S. M. Smith, and D. Holmgren. 2016. Massive ice loss from the Mauna Loa Icecave, Hawaii. Arctic, Antarctic, and Alpine Research 48:33–43. doi:10.1657/AAAR0014-095.
- Porter, S. C. 1979. Hawaiian glacial ages. Quaternary Research 12 (2):161–87. doi:10.1016/0033-5894(79)90055-3.
- Porter, S. C. 2005. Pleistocene snowlines and glaciation of the Hawaiian Islands. Quaternary International 138-139:118–28. doi:10.1016/j.quaint.2005.02.009.
- Porter, S. C., M. Stuiver, and I. C. Yang. 1977. Chronology of Hawaiian glaciations. Science 195:61–63. doi:10.1126/science.195.4273.61.
- Romanovskii, N. N., V. N. Zaitsev, S. Yu Volchenkov, D. D. Zagryazkin, and D. O. Sergeyev. 1991. Alpine permafrost temperature zonality, Northern Trans-Baikal region, USSR. Permafrost and Periglacial Processes 2:187–95. doi:10.1002/ppp.3430020303.
- Romanovsky, N. N., and T. E. Osterkamp. 1995. Interannual variations of the thermal regime of the active layer and near-surface permafrost in Northern Alaska. Permafrost and Periglacial Processes 8:1–22. doi:10.1002/(SICI)1099-1530(199701)8:1<1::AID-PPP243>3.0.CO;2-U.
- Sawada, Y., M. Ishikawa, and Y. Ono. 2003. Thermal regime of sporadic permafrost in a block slope on Mt. Nishi-Nupukaushinupuri, Hokkaido Island, Northern Japan. Geomorphology 52:121–30. doi:10.1016/S0169-555X(02)00252-0.
- Schorghofer, N., S. Businger, and M. Leopold. 2018. The coldest places in Hawaiʻi: The ice-preserving microclimates of high-altitude craters and caves. Bulletin of the American Meteorological Society 99:2313–24. doi:10.1175/BAMS-D-17-0238.1.
- Schorghofer, N., E. Kantar, and P. M. Nogelmeier. 2014. Snow on the summits of Hawaiʻi Island: Historical sources from 1778 to 1870. Hawaiian Journal of History 48:89–113.
- Schorghofer, N., M. Leopold, and F. L. Klasner. 2023. A third pond on the Mauna Kea summit plateau. Pacific Science 76, 76 (3):277–287. doi:10.2984/76.3.3.
- Schorghofer, N., M. Leopold, and K. Yoshikawa. 2017. State of high-altitude permafrost on tropical Maunakea volcano, Hawaiʻi. Permafrost and Periglacial Processes 28:685–97. doi:10.1002/ppp.1954.
- Schorghofer, N., and K. Yoshikawa. 2022. Multi-year temperature time series from cinder cones on the Mauna Kea summit plateau, Hawaii [Data set]. Zenodo. doi:10.5281/zenodo.883469.
- Sergeev, D. O., J. V. Stanilovskaya, G. Z. Perlshtein, V. E. Romanovsky, A. P. Bezdelova, D. M. Alexutina, M. M. Bolotyuk, A. N. Khimenkov, V. N. Kapralova, R. G. Motenko, et al. 2016. ФОНОВЫЙ ГЕОКРИОЛОГИЧЕСКИЙ МОНИТОРИНГ В СЕВЕРНОМ ЗАБАЙКАЛЬЕ (Background geocryological monitoring in Northern Transbaikalia Region). Криосфера Земли XX (3):24–32. (in Russian). doi:10.21782/KZ1560-7496-2016-3(24-32).
- Sergueev, D. O., J. A. Ukhova, J. V. Stanilovskaya, and V. E. Romanovsky. 2007. Температурный режим многолетнемерзлых толщ и сезонноталого слоя в горах Северного Забайкалья (возобновление стационарных наблюдений) (Temperature regime of the permafrost and the active layer in Northern Transbaykalia Mountains (recommencement of fixed-site observations)). Криосфера Земли XI (2):19–26. (in Russian).
- Smith, M. W., and C. R. Burn. 1987. Outward flux of vapour from frozen soils at Mayo, Yukon, Canada: Results and interpretation. Cold Regions Science and Technology 13:143–52. doi:10.1016/0165-232X(87)90052-8.
- Sturm, M. 1991. The role of thermal convection in heat and mass transport in the subarctic snow cover. CRREL Report 91-19, 93, U.S. Army Cold Regions Research and Engineering Laboratory, Hanover, NH.
- Teehera, K. B., S. P. Jungbluth, B. P. Onac, T. E. Acosta-Maeda, E. Hellebrand, A. K. Misra, A. Pflitsch, M. S. Rappe, S. M. Smith, M. Telus, et al. 2018. Cryogenic minerals in Hawaiian lava tubes: A geochemical and microbiological exploration. Geomicrobiology Journal 35:227–41. doi:10.1080/01490451.2017.1362079.
- Vizoto, V. 2018. Estado del arte de la investigacion periglaciar en Mexico. Investigaciones Geográficas 97. doi:10.14350/rig.59811.
- Washburn, A. L. 1979. Geocryology: A survey of periglacial processes and environments. London: Edward Arnold.
- Webb, E. J., and B. I. Magi. 2022. The ensemble Oceanic Niño Index. International Journal of Climatology 1–21. doi:10.1002/joc.7535.
- Williams, P., and M. Smith. 1989. The frozen earth: Fundamentals of geocryology, 306. Cambridge: Cambridge University Press.
- Woo, M. K. 1982. Upward flux of vapor from frozen materials in the high Arctic. Cold Regions Science and Technology 5:269–74. doi:10.1016/0165-232X(82)90020-9.
- Woodcock, A. H. 1974. Permafrost and climatology of a Hawaii volcano crater. Arctic and Alpine Research 6:49–62. doi:10.2307/1550369.
- Woodcock Archives. 2007. Alfred H. Woodcock papers, 1930–1995. M. E. Grenander Department of Special Collections and Archives, University Libraries, University at Albany, State University of New York.
- Woodcock, A. H., A. S. Furumoto, and G. P. Woollard. 1970. Fossil ice in Hawaii? Nature 226:873. doi:10.1038/226873a0.
- Woodcock, A. H., and G. W. Groves. 1969. Negative thermal gradient under alpine lake in Hawaii. Deep Sea Research 16:393–405.
- Yoshikawa, K. 2017. Вечная мерзлота в наше время (Permafrost in our time –Siberian communities)” (in Russian), 211. Yakutsk, Russia: North-eastern Federal University.
- Yoshikawa, K., D. R. Hardy, K. Narita, W. R. Bolton, J. Stanilovskaya, and E. B. Sparrow. 2021. Ground thermal regimes and implications for permafrost distribution on Kilimanjaro, Tanzania. Arctic, Antarctic, and Alpine Research 53 (1):127–45. doi:10.1080/15230430.2021.1903375.
- Yoshikawa, K., J. Ubeda, P. Masias, W. Pari, F. Apaza, P. Vasquez, B. Ccallata, R. Concha, G. Luna, J. Iparraguirre, et al. 2020. Current thermal state of permafrost in the southern Peruvian Andes and potential impact from El Niño–Southern Oscillation (ENSO). Permafrost and Periglacial Processes 31 (4):598–609. doi:10.1002/ppp.2064.
- Zhang, C., K. Hamilton, and Y. Wang. 2017. Monitoring and projecting snow on Hawaiʻi Island. Earth’s Future 5:436–48. doi:10.1002/2016EF000478.