
ABSTRACT
Arctic vegetation is crucial for fauna and the livelihoods of Northern peoples and is tightly linked to climate, permafrost soils, and water. Yet, a comprehensive understanding of climate change effects on Arctic vegetation is lacking. Protected areas cannot halt climate change but could reduce future pressure from additional drivers, like land use change and local industrial pollution. Therefore, it is crucial to understand the contribution of protected areas in safeguarding threatened Arctic vegetation types. We compare the present baseline with 2050 predictions of circumpolar Arctic vegetation type distributions and demonstrate an overrepresentation of dominant vegetation types and an underrepresentation of declining vegetation types within protected areas. Our study predicts five of eight assessed tundra vegetation types to be threatened by 2050, following International Union for Conservation of Nature criteria. Further, we mapped potential climate change refugia, areas with the highest potential for safeguarding threatened vegetation types. This study provides an essential first step assessing vegetation type vulnerability based on predictions covering 42 percent of Arctic landscapes. The co-development of new protective measures by policymakers and Indigenous peoples at a pan-Arctic scale requires more robust and spatially complete vegetation predictions, as increasing pressures from resource exploration and infrastructure development threaten the sustainable development of the rapidly thawing and greening Arctic.
Introduction
The Arctic experiences rates of climate warming up to four times the global mean (Chylek et al. Citation2022; Rantanen et al. Citation2022), leading to observed shifts in the distribution and composition of Arctic tundra vegetation (Serreze et al. Citation2000) that are projected to intensify in the future (Pearson et al. Citation2013b). These changes may threaten not only endemic plant species but entire vegetation types and associated ecosystem functions. Vegetation types provide habitats for sessile and migratory animal species (Wheeler, Høye, and Svenning Citation2018), support livelihoods of Northern peoples (Conservation of Arctic Flora and Fauna [CAFF] 2013), and take part in various feedbacks involving climate (Swann et al. Citation2010; Loranty, Goetz, and Beck Citation2011; Myers-Smith et al. Citation2011; Juszak et al. Citation2014), permafrost soils (Myers-Smith et al. Citation2011; Bonfils et al. Citation2012; Juszak et al. Citation2014), lakes, rivers, and the ocean through water, energy, and carbon fluxes (Lunt, de Noblet-Ducoudré, and Charbit Citation2004; Woo and Young Citation2006; Oehri et al. Citation2022).
Under the intermediate and high carbon emission scenarios (RCPs [Representative Concentration Pathways] 4.5 and 8.5), a recent long-term modeling study predicted that the tundra area in Siberia will be reduced to 5.7 percent of its current value by 2500 (Kruse and Herzschuh Citation2022). The tree line at the southern border to the Arctic tundra has been both observed and projected to advance northwards, decreasing the total extent of the tundra while simultaneously displacing southern Arctic vegetation types (Chapin and Starfield Citation1997; Lloyd et al. Citation2002; Rundqvist et al. Citation2011; Bjorkman et al. Citation2020). Due to decreasing snow cover and phenological changes, primary productivity and vascular plant biomass have been increasing, specifically that of tall shrubs (Myers-Smith et al. Citation2011). This shrubification of the tundra has been widespread, resulting in a reduction in the abundance of less productive lichen- and moss-dominated vegetation types (Sturm, Racine, and Tape Citation2001; Blok et al. Citation2010; Myers-Smith et al. Citation2011; Elmendorf et al. Citation2012; Loranty and Goetz Citation2012; Bjorkman et al. Citation2020). Widespread greening of the Arctic due to climate warming has long been identified (Myneni et al. Citation1997; Myers-Smith et al. Citation2020). However, spectral browning and increased heterogeneity of Arctic greening at the circumpolar scale have also been observed in recent years (Phoenix and Bjerke Citation2016; Bjorkman et al. Citation2020), further complicating our understanding of changes in the highly heterogenous vegetation of the Arctic tundra.
Arctic vegetation is characterized by small vascular plants, bryophytes, and lichens forming distinct plant communities. The zonal vegetation can be classified into five physiognomic classes (barrens, graminoid-dominated tundras, prostrate shrub–dominated tundras, erect shrub–dominated tundras, wetlands) and further divided into sixteen vegetation types based on the dominant plant functional types (D. A. Walker et al. Citation2005; Raynolds et al. Citation2019). The plant functional types are distinguished by plant traits such as growth form (e.g., graminoids, shrubs), size (e.g., dwarf or low shrubs), taxonomical status (e.g., sedges, rushes, grasses), and stature of woody shrubs. The resulting units include vegetation types such as cryptogam-dominated barren, graminoid-dominated, prostrate dwarf shrub, low-shrub tundra, and sedge-dominated wetlands. They serve as the fundamental units of the Circumpolar Arctic Vegetation Map (CAVM; D. A. Walker et al. Citation2005) and its successor, the raster version of the CAVM (Raynolds et al. Citation2019), a project within the CAFF group of the Arctic Council (Circumpolar Flora Group Citation2022). As classified by the CAVM approach, Arctic vegetation types relate to their ecological function in the Arctic system, using a standardized approach across the entire Arctic tundra biome. Hence, the CAVM approach has been widely applied to study very diverse processes relying on plant functional types, including biogeochemical fluxes (Virkkala et al. Citation2022; Zona et al. Citation2022), land surface energy fluxes (Oehri et al. Citation2022; Yu, Leng, and Python Citation2022), land surface modeling improvements (Sulman et al. Citation2021), Alaskan tundra wildfire activity (Masrur et al. Citation2022), and studies investigating impacts of increasing shrub abundance on migratory songbirds (Boelman et al. Citation2015). The original map has also been used in a modeling study that projected that 48 to 84 percent of Arctic vegetation types will have shifted by 2050 due to the effects of climate change (Pearson et al. Citation2013b).
Novel pressures on vegetation beyond those posed by warming are arising in the Arctic because of increasing anthropogenic presence. Historically, human land use and modification have been relatively low or nonexistent in the Arctic biome. The human footprint map classifies most of the Arctic as under low pressure, and the human modification index demonstrates that the tundra remains thus far one of the last true terrestrial wild places on Earth (Venter et al. Citation2016; Kennedy et al. Citation2019). However, human interest in Arctic commodities—such as oil and gas—is increasing because of rising global energy needs and with it the extent of disturbances that terrestrial ecosystems experience because of exploration and infrastructure development (Kumpula et al. Citation2011; CAFF 2013). Vegetation distribution and composition over time are affected by human disturbances and climate and landscape processes such as permafrost thaw and biota shifts. These factors must be explicitly included in effective conservation efforts. Vegetation in the Arctic is more fragile and requires longer times to recover from perturbation in comparison to southern vegetation (Kumpula et al. Citation2011). Thus, it is an ecological, political, and economic imperative to have plans in place to mitigate and minimize these disturbances to provide a path toward the sustainable development of the Arctic.
As of 2016, 20.2 percent of the terrestrial Arctic area is protected to some degree (Conserviation of Arctic Flora and Fauna and Protection of the Arctic Marine Environment [CAFF and PAME] 2017). Although conservation efforts in the Arctic are well developed, their focus is generally at the species level rather than the scale of ecosystems (Chapin et al. Citation2015). In other biomes, the impact of climate change–induced biota shifts on conservation efforts has been recognized, and adaptive conservation strategies have been developed, though not widely implemented (Heller and Zavaleta Citation2009). A recent systematic study identified areas with high potential for the persistence of multiple biodiversity elements under climate change in North America and demonstrated that at the biome scale, ~80 percent of areas within the top quintile of future conservation importance lacked formal protection, though this study excluded the High Arctic because of a lack of data (Stralberg, Carroll, and Nielsen Citation2020). Additionally, conservation needs in the North are influenced by rapid change at global scales and can no longer be addressed solely by local actions (Chapin et al. Citation2015). Indeed, local studies of Arctic plant communities do not always capture observational trends over extended spatiotemporal extents, which unlike local changes tend to be more heterogeneous and complex (Bjorkman et al. Citation2020; Myers-Smith et al. Citation2020). Conservation actions that operate at various scales of space, time, and biological organization may be required to effectively prevent the loss of potentially vulnerable ecosystems and their functions.
Refugia have become a focus of interest in conservation, because they have been demonstrated to enable the persistence of biodiversity over longer temporal scales and changing climates while retaining ecosystem and habitat functions (Tzedakis et al. Citation2002; Morelli et al. Citation2016). Vegetation refugia can be defined as areas where existing vegetation will remain within current suitable climate conditions (Thorne et al. Citation2020). In this study, we consider refugia as areas where threatened vegetation types already occur, where the climatic envelope is predicted to remain suitable, and where competing vegetation types might still be absent due to dispersal limitations. Refugia may serve as a means for giving plant communities the time needed to allow for local adaptation to new environmental states by providing habitats where the effects of climate change are least felt in the short term (Morelli et al. Citation2020). The identification and protection of refugia may facilitate the persistence of retreating vegetation types under projected anthropogenic climate change (Noss Citation2001; Taberlet and Cheddadi Citation2002).
Presently, protected areas in the Arctic have not been established with climate change–induced vegetation shifts in mind (CAFF 2013). Consequently, there is no consensus on the current state of vegetation vulnerability in the Arctic. Additionally, as Arctic vegetation shifts, today’s protected areas may no longer protect the same vegetation to the same extent in the future. Vegetation changes lead to trophic cascades, which alter the fundamental structures and functions of ecosystems (Wookey et al. Citation2009). Vegetation distribution projections provide the opportunity to locate vegetation refugia in the Arctic. Therefore, the conservation of potential vegetation refugia could, in effect, protect species at higher trophic levels as well. However, a comprehensive overview of vegetation refugia and their protected status in the Arctic has been unavailable to date.
This study aims to establish an overview of vegetation type abundance in Arctic protected areas and assess their vulnerability. For this purpose, we utilized the current distributions of Arctic vegetation types described in the CAVM raster map (Raynolds et al. Citation2019) to derive baseline abundance of Arctic vegetation types within and outside current protected areas. We then predicted the distribution of Arctic vegetation types within protected areas using 2050 vegetation scenarios derived from previously established methods (Pearson et al. Citation2013a). Furthermore, we assessed the risk of collapse of the vegetation types following the IUCN Red List of Ecosystems criteria for the baseline and the future abundance of vegetation types (Bland et al. Citation2015). Lastly, to inform conservation efforts, we located potential refugia for the vegetation types that had been identified as threatened.
Materials and methods
Baseline status of vegetation type abundance in protected areas
For this study, we defined the Arctic as the terrestrial area north of the CAVM-defined tree line (Raynolds et al. Citation2019). We additionally defined the network of protected areas in the Arctic according to their extent in the Map of Arctic Protected Areas (MAPA; CAFF and PAME 2017). The protected areas were treated as one network regardless of the six management categories within the map, because our focus was on the collective pan-Arctic protection status. We utilized the CAVM to determine the baseline distribution of Arctic vegetation types within protected areas, which included sixteen distinct vegetation types (Appendix A) as well as the nonvegetative glacier class (Raynolds et al. Citation2019). We intersected the CAVM with MAPA and computed a zonal histogram, from which we derived the pixel count of each vegetation type in the Arctic, as well as within the protected areas. Because each pixel represented a 1 × 1 km square, we used them to represent the area in square kilometers. Maps were converted into the Lambert Azimuthal Equal Area Polar Projection to preserve area, a crucial feature for this analysis. Spatial data were analyzed using ArcMap 10.5.1 (ESRI Citation2017) and R (R Development Core Team Citation2017).
Maps of future Arctic vegetation distribution (henceforth vegetation projections)
The CAVM has already been used to predict climate change–induced vegetation shifts for 2050 (Pearson et al. Citation2013a). Two machine learning methods for ecological niche modeling, three climate models, two emissions scenarios, and three tree dispersal scenarios were applied to create the thirty-six predictions (Pearson et al. Citation2013b). Areas covered by glaciers, barren lands, and wetlands were excluded from the predictions, but tree cover was incorporated to illustrate the northward tree line shift of the taiga. However, these predictions were created using the previous version of the CAVM, which was provided in vector format with a minimal mapping unit size of 14 km (D. A. Walker et al. Citation2005). Since then, its successor has been released, a raster format map with a 1-km resolution and a 70 percent accuracy rate, up from 39 percent (Raynolds et al. Citation2019). Additionally, Pearson et al.’s (Citation2013a) models utilized the CMIP3 climate models, whereas the current CMIP6 models have more advanced parameterizations and a higher spatial resolution (Eyring et al. Citation2016). Therefore, we re-created the vegetation predictions of Pearson et al. (Citation2013a) using the same methodology but with the most up-to-date climate models, emissions scenarios, and a vegetation map at 1-km resolution.
We followed the methods described by Pearson et al. (Citation2013b) as closely as possible and classified the baseline vegetation based on the current bioclimate variables and soil substrate and predicted future vegetation classes based on future bioclimate variables and the same soil substrate. We utilized nineteen bioclimate variables from the WorldClim database (Fick and Hijmans Citation2017) using historical climate data (1970–2000) as a baseline and predictions of three CMIP6 climate models at 30-second (ca. 1-km) resolution for 2041–2060 climate as a proxy for 2050 climate. We chose the EC-Earth3-Veg, IPSL-CM6A-LR, and MRI-ESM2-0 climate models because their simulations of sea-ice dynamics (sea-ice cover and rate of melting) were in line with observations (Notz and Community Citation2020). We additionally chose the lowest and highest emission scenarios, SSP126 and SSP585, respectively. We also used the same tree dispersal rate scenarios used by Pearson et al. (Citation2013b): unrestricted, 20-km, and 5-km dispersal rates. We used only the random forest classification approach, because it showed higher accuracy in the original study and the resulting predictions were very similar between the two machine learning approaches. We additionally used the R package “ranger” instead of the originally used “RandomForest,” because it was capable of classifying larger data sets (above 5,000,000 rows). Subsequently, we produced eighteen vegetation projections by crossing the two emission scenarios with the three climate models and the three tree dispersal scenarios. All code and resulting data have been made publicly available (see Data and Code Availability section). However, there was a data gap in the future climate predictions for the scenarios using the combination of the EC-Earth3-Veg model and the high-emission scenario, so we excluded the three affected vegetation projections from our area-based analysis to avoid biases associated with unequal vegetation distribution in the present and missing areas.
Future (2050) status of vegetation type abundance in protected areas
We intersected all fifteen vegetation projections with MAPA to obtain the complete range of possible outcomes. We selected a vegetation projection that we deemed most realistic (hereafter, “realistic model”) as follows: we chose the IPSL-CM6A-LR model because its range showed the best model congruence to observed sea-ice sensitivity to temperature, September sea-ice loss per degree of global warming, and absolute sea-ice area in September and March (Notz and Community Citation2020). We also chose the higher emission scenario (SSP585) and the intermediate tree dispersal rate of 20 km, because it represents the highest rate at which trees have been observed to disperse northward in Alaska and Canada (Lescop-Sinclair and Payette Citation1995; Lloyd et al. Citation2002). To assess the future distribution and protection status of Arctic vegetation, we converted MAPA from a polygon to a 1-km resolution raster to match the spatial resolution of the vegetation projections and attributed the protection status to every pixel. Finally, we summed the pixels and obtained the total number of pixels as well as the number of pixels per protected area for each vegetation type. We analyzed the eight vegetation types available in the vegetation projections out of the sixteen originally present in the CAVM. Barrens (five classes) were excluded, because we focused on the distribution shifts across land surface areas with adequate soil to support vegetation growth. Additionally, wetlands (three classes) were excluded because we, like Pearson et al. (Citation2013b), did not attempt to model the complex hydrological processes operating in the Arctic tundra.
Vulnerability of Arctic vegetation types following IUCN criteria
We applied the IUCN Red List of Ecosystems Categories and Criteria to quantify the vulnerability of Arctic vegetation types (Bland et al. Citation2015). The IUCN provides guidelines to assess the risk of ecosystem collapse, designed to be applicable to various ecosystems. Here, we defined ecosystems as the CAVM vegetation types, representing over 400 plant communities classified into broader functional groups (D. A. Walker et al. Citation2005). The IUCN assigns one of three graded categories to threatened ecosystems: “vulnerable,” “endangered,” and “critically endangered.” We did not differentiate here between the two graded categories for unthreatened ecosystems (“not threatened” and “least concern”) and instead summarized them as “not threatened.”
Five criteria are used to determine the IUCN risk category of the ecosystem: “reduction in geographic distribution,” “restricted in geographic distribution,” “environmental degradation,” “disruption of biotic processes or interactions,” and “quantitative analysis that estimates the probability of ecosystem collapse” (Bland et al. Citation2015). It is recommended that as many criteria as possible be assessed, because the ultimate risk classification is determined as the highest of the five criteria (Bland et al. Citation2015). At the pan-Arctic scale, data were only available for “reduction in geographic distribution” and “restricted in geographic distribution”; therefore, this study could only assess these two criteria. Hence, our results represent the minimum risk status for each vegetation type. Analyses of the remaining three criteria could potentially result in a higher risk category.
To determine the “restricted in geographic distribution” criterion classification according to the IUCN criteria, the number of 10 × 10 km grid cells occupied by the ecosystem must be calculated. An ecosystem is classified as “vulnerable,” “endangered,” or “critically endangered” if it occupies at most fifty, twenty, or two grid cells, respectively (Dudley Citation2008). After the total extent of each vegetation type within the baseline vegetation distribution was calculated in square kilometers using the pixel counts (see Materials and Methods: baseline status of vegetation type abundance in protected areas), the extents were divided by 100 to determine the number of 10 × 10 grid cells occupied by the vegetation type across the pan-Arctic extent. The “reduction in geographic distribution” criterion was determined by the predicted relative reduction in the distribution of an ecosystem over fifty years (i.e., the relative reduction in the spatial extent of vegetation types in the 2050 scenarios compared to the current scenario). An ecosystem is classified as “vulnerable,” “endangered,” or “critically endangered” if the reduction in its spatial extent is at least 30, 50, or 80 percent, respectively (Dudley Citation2008). In this analysis, the relative changes in spatial extent covered by vegetation types were calculated according to the changes between the CAVM baseline, which is representative of present-day vegetation distribution (Raynolds et al. Citation2019), and the 2050 vegetation projections.
Identification of potential refugia for threatened vegetation types
For the threatened vegetation types, we identified areas that may serve as refugia; that is, where a vegetation type is present in the baseline and is predicted to persist until 2050. We overlaid the realistic future vegetation distribution with the baseline vegetation distribution and selected the areas where the pixels remained unchanged to create a map of areas with persistent vegetation types. We did not consider areas where these vegetation types had been predicted to shift to and only considered the areas where the vegetation remained the same, because (1) the predictions of present and future vegetation distribution contain a measure of uncertainty, (2) there is evidence of lag effects in species-scale responses to climate change (Stewart et al. Citation2016), and (3) considerable variability in their ability to track new climatic niches exists (La Sorte and Jetz Citation2012). To better understand the uncertainty in vegetation classification predictions, we computed the model agreement between our realistic model and the other fourteen models using the Equal to Frequency calculator in ArcMap (ESRI Citation2017). The output indicates how many of the other fourteen models predicted the same vegetation type as the most realistic model for each refugia pixel.
Results
Baseline status of vegetation type abundance in protected areas
The terrestrial pan-Arctic region covers over 7.1 million km2, 20.2 percent of which is protected. Of the vegetated areas (4.7 million km2), 21 percent—or approximately 977,000 km2—fall within protected areas. Additionally, a significant portion of the protected areas encompasses glaciated areas (777,000 km2) but could not be considered within the scope of this study because of a lack of predictions.
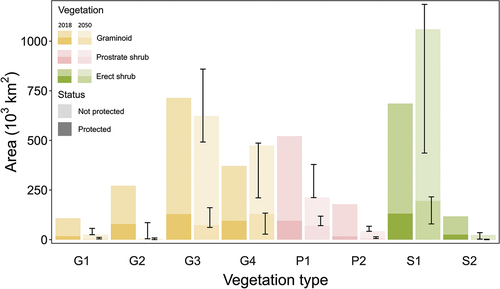
Our analysis demonstrates that the sixteen vegetation types have substantially different absolute and relative spatial abundances in the pan-Arctic tundra (). The most abundant vegetation type (G3: nontussock sedge, dwarf shrub, moss tundra) covers over six times more area than the least abundant vegetation type (W1: sedge/grass, moss wetland), 716,000 km2 and 18,000 km2, respectively. The abundances of the vegetation types within protected areas are generally proportional to their abundance at the pan-Arctic scale. For example, 2.5 percent of Arctic vegetation is composed of the S1 vegetation type (erect, dwarf shrub tundra), which accordingly covers 2.62 percent of protected areas. Notable exceptions do occur, such as the wetland types. In comparison to their total extents (W1: sedge/grass, moss wetland, 0.38 percent; W2: sedge, moss, dwarf shrub wetland, 2.31 percent; W3: sedge, moss, low-shrub wetland, 2.92 percent), they are overrepresented within protected areas (W1: sedge/grass, moss wetland, 0.5 percent; W2: sedge, moss, dwarf shrub wetland, 3.85 percent; W3: sedge, moss, low-shrub wetland, 5.87 percent). In contrast, though 10.30 percent of Arctic vegetation is composed of vegetation type B2a (cryptogam barren complex, bedrock), it spans only 4.06 percent of the protected area. In terms of absolute extents, the most abundant types at pan-Arctic scales are generally overrepresented in protected areas, whereas the least abundant types are underrepresented ().
Figure 1. The 2018 baseline abundance and protection status of Arctic vegetation types. The Arctic tundra encompasses approximately 4.7 million km2. The height of the bars represents the absolute extent of each vegetation type within and outside of protected areas. The percentages above the bars represent the relative abundance of the vegetation type within the pan-Arctic tundra. The percentages within the darker-colored bars (protected area) represent the relative abundance of each vegetation type in the protected area compared to the total protected area. The vegetation types can be summarized into barren tundra (B1: cryptogam herb barren; B2a: cryptogam barren complex [bedrock]; B2b: prostrate shrub/barren complex [bedrock]; B3: noncarbonate mountain complex; B4: carbonate mountain complex), graminoid tundra (G1: rush/grass forb, cryptogam tundra; G2: graminoid, prostrate dwarf shrub, forb tundra; G3: nontussock sedge, dwarf shrub, moss tundra; G4: tussock sedge, dwarf shrub, moss tundra), prostrate shrub tundra (P1: prostrate dwarf shrub, herb tundra; P2: prostrate/hemiprostrate dwarf shrub tundra), erect shrub tundra (S1: erect dwarf shrub tundra; S2: low-shrub tundra), and wetlands (W1: sedge/grass, moss wetland; W2: sedge, moss, dwarf shrub wetland; W3: sedge, moss, low-shrub wetland).
![Figure 1. The 2018 baseline abundance and protection status of Arctic vegetation types. The Arctic tundra encompasses approximately 4.7 million km2. The height of the bars represents the absolute extent of each vegetation type within and outside of protected areas. The percentages above the bars represent the relative abundance of the vegetation type within the pan-Arctic tundra. The percentages within the darker-colored bars (protected area) represent the relative abundance of each vegetation type in the protected area compared to the total protected area. The vegetation types can be summarized into barren tundra (B1: cryptogam herb barren; B2a: cryptogam barren complex [bedrock]; B2b: prostrate shrub/barren complex [bedrock]; B3: noncarbonate mountain complex; B4: carbonate mountain complex), graminoid tundra (G1: rush/grass forb, cryptogam tundra; G2: graminoid, prostrate dwarf shrub, forb tundra; G3: nontussock sedge, dwarf shrub, moss tundra; G4: tussock sedge, dwarf shrub, moss tundra), prostrate shrub tundra (P1: prostrate dwarf shrub, herb tundra; P2: prostrate/hemiprostrate dwarf shrub tundra), erect shrub tundra (S1: erect dwarf shrub tundra; S2: low-shrub tundra), and wetlands (W1: sedge/grass, moss wetland; W2: sedge, moss, dwarf shrub wetland; W3: sedge, moss, low-shrub wetland).](/cms/asset/567b34d5-d4e0-4bf1-afba-7b8300f8fb8b/uaar_a_2203478_f0001_oc.jpg)
Predicted vegetation type abundance in protected areas by 2050
We predicted eighteen vegetation projections for the eight vegetation types and calculated their extent within the Arctic and only within protected areas for 2050 (Appendix B). The results differed considerably between the fifteen vegetation projections: between 23,000 km2 (0.1 percent) and 1,184,000 km2 (25.1 percent) of the total area covered by tundra vegetation in the CAVM is predicted to be replaced by taiga (Appendix B). Hence, considerable differences also resulted in the predictions of single vegetation types as a function of vegetation projections. However, this was mostly driven by the vegetation projections with unlimited tree dispersal scenarios, which were significantly different from the other two dispersal scenarios (Appendix B). Thus, we restrict the presentation of results to our selected realistic model and present the results of the other vegetation projections as an envelope around this model result. Five of the eight vegetation types are predicted to decline in their total area according to the realistic model, accompanied by a proportional decline in their abundance within the protected area network (). In contrast, two southern vegetation types (S1: erect dwarf shrub tundra and G4: tussock sedge, dwarf shrub moss tundra) are predicted to gain in area, both within and outside of protected areas. Predictions for the vegetation types within the barren (29.3 percent of nonglaciated terrestrial protected areas, 287,000 km2) and wetland (10.2 percent of nonglaciated terrestrial protected areas, 100,000 km2) classes were unavailable. Additionally, because the nearly 777,000 km2 of glaciated protected areas were lacking in predictions, they were excluded from the study.
Figure 2. A comparison of the abundance and protection status of Arctic vegetation types at the baseline and in the future. The data presented refer to the realistic model scenario; error bars represent the envelope of the minimal and maximal abundances predicted by the different vegetation projections. The minimum and maximum values of the envelope are not always the result of the same vegetation projection. Different models predict the highest or lowest abundance depending on the vegetation type. The vegetation types can be summarized into graminoid tundra (G1: rush/grass forb, cryptogam tundra; G2: graminoid, prostrate dwarf shrub, forb tundra; G3: nontussock sedge, dwarf shrub, moss tundra; G4: tussock sedge, dwarf shrub, moss tundra), prostrate shrub tundra (P1: prostrate dwarf shrub, herb tundra; P2: prostrate/hemiprostrate dwarf shrub tundra), and erect shrub tundra (S1: erect dwarf shrub tundra; S2: low-shrub tundra). Barren and wetland vegetation types were not assessed, because predictions for 2050 were unavailable.
Vulnerability of Arctic vegetation types following IUCN criteria
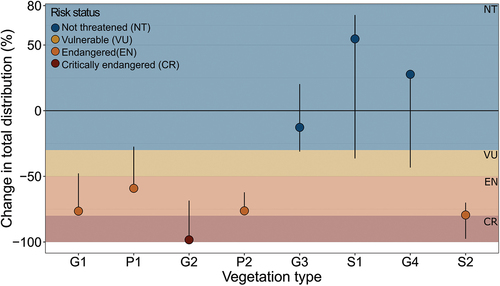
To determine the risk of collapse for the eight vegetation types, we analyzed two spatial criteria: “restricted in geographic distribution” and “reduction in geographic distribution”; we determined the higher of these two as the final assigned risk category (Dudley Citation2008). The “restricted in geographic distribution” criterion diagnosed none of the eight vegetation types as threatened because, presently, each vegetation type has an extent of at least 5,000 km2. The “reduction in geographic distribution” criterion assigned different results (). Depending on the vegetation projection, the specific risk status assigned to each type varied. Under the realistic model, one vegetation type (G2: graminoid, prostrate dwarf shrub, forb tundra) was classified as critically endangered. Four vegetation types were classified as endangered (G1: rush/grass forb, cryptogam tundra; P1: prostrate dwarf shrub, herb tundra; P2: prostrate/hemiprostrate dwarf shrub tundra; S2: low-shrub tundra) and three as not threatened (G3: nontussock sedge, dwarf shrub, moss tundra; G4: tussock sedge, dwarf shrub, moss tundra; S1: erect dwarf shrub tundra). The threatened vegetation types (i.e., those classified at least as endangered) are generally the more northern types with sparse, low-growing, nonvascular vegetation.
Figure 3. Risk status according to the “decline in distribution” criterion of the IUCN Red List of Ecosystems categories and criteria under the realistic model. The vegetation types are ordered along the bioclimatic subzones they occur in, from low to high summer temperatures (left to right). The data presented refer to the realistic model scenario; error bars represent the envelope of the minimal and maximal abundances predicted by the different vegetation projections. The minimum and maximum values of the envelope are not always the result of the same vegetation projections. Different models predict the highest or lowest abundance depending on the vegetation type. The vegetation types can be summarized into graminoid tundra (G1: rush/grass forb, cryptogam tundra; G2: graminoid, prostrate dwarf shrub, forb tundra; G3: nontussock sedge, dwarf shrub, moss tundra; G4: tussock sedge, dwarf shrub, moss tundra), prostrate shrub tundra (P1: prostrate dwarf shrub, herb tundra; P2: prostrate/hemiprostrate dwarf shrub tundra), and erect shrub tundra (S1: erect dwarf shrub tundra; S2: low-shrub tundra). Barren and wetland vegetation types were not assessed, because predictions for 2050 were unavailable.
Potential refugia for threatened vegetation types
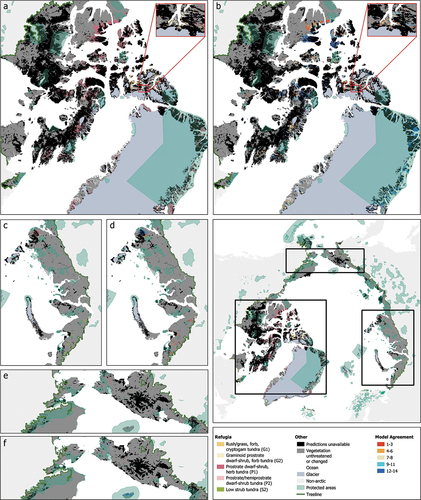
For the five out of eight vegetation types (G1: rush/grass forb, cryptogam tundra; G2: graminoid, prostrate dwarf shrub, forb tundra; P1: prostrate dwarf shrub, herb tundra; P2: prostrate/hemiprostrate dwarf shrub tundra; S2: low-shrub tundra) classified as threatened under the realistic model, we determined refugia, regions where these vegetation types are predicted to persist until 2050 (, Appendix C). The total area of refugia ranges from 245 km2 (G2: graminoid, prostrate dwarf shrub, forb tundra) to 99,000 km2 (P2: prostrate/hemiprostrate dwarf shrub tundra), of which 3 km2 (G2: graminoid, prostrate dwarf shrub, forb tundra) and 30,000 km2 (P2: prostrate/hemiprostrate dwarf shrub tundra) fall within existing protected areas. The refugia are scattered over Canada, Greenland, Norway, Russia, and the United States (, Appendix C). We computed the degree to which other vegetation projections agreed with the classification present in the realistic model (, Appendix C). The realistic model agreed with at least half of the other vegetation projections for 75 percent of the pixels and matched fully with the other vegetation projections (agreement = 14) for 39 percent of all pixels.
Figure 4. Refugia maps of threatened vegetation types in the Arctic based on the “realistic model” and magnified subsets centered on the (a) Canadian Archipelago; (c) Northwestern Siberia, Russia; and (e) Alaska, United States, and Northeastern Siberia, Russia, and level of model agreement with fourteen other future maps of vegetation predictions (b, d, and f, respectively). The vulnerable vegetation types presented here are G1: rush/grass forb, cryptogam tundra; G2: graminoid, prostrate dwarf shrub, forb tundra; P1: prostrate dwarf shrub, herb tundra; P2: prostrate/hemiprostrate dwarf shrub tundra and S2: low-shrub tundra. For a more detailed look at the refugia pixels, please refer to the PDF version of this map, provided in Appendix C.
Discussion
In this study, we evaluated the capability of the current Arctic network of protected areas for the conservation of Arctic vegetation types. Our results demonstrate that all Arctic vegetation types are found within the protected areas, and their relative abundance significantly varied but generally followed the same pattern as seen at the pan-Arctic scale. Noticeably, wetlands tend to be protected at an above-average rate, likely because of conservation efforts focusing on Wetlands of International Importance (Ramsar sites) related to their protection as breeding areas for migrating birds (CAFF and PAME 2017).
The impacts of climate change may demand the adaptation of protected areas (Hannah, Midgley, and Millar Citation2002; Heller and Zavaleta Citation2009), because they may no longer harbor the same vegetation types. Thus, we analyzed the protection and threat status of the vegetation type abundances predicted for the year 2050. Two vegetation types (G4: tussock sedge, dwarf shrub, moss tundra; S1: erect dwarf shrub tundra) occupying the lower southern bioclimatic zones were projected to increase in extent, and another southern vegetation type (G3: nontussock sedge, dwarf-shrub, moss tundra) declined only slightly. Conversely, one southern vegetation type (S2: low shrub tundra) was projected to decline drastically in extent; this may be attributed to its already reduced distribution in the Arctic, which was readily replaced by encroaching taiga. Four vegetation types (G1: rush/grass forb, cryptogam tundra; G2: graminoid, prostrate dwarf shrub, forb tundra; P1: prostrate dwarf shrub, herb tundra; and P2: prostrate/hemiprostrate dwarf shrub tundra) predicted to decline drastically currently occupy the three more northern bioclimatic zones and are characterized by sparse and low-growing vegetation (Raynolds et al. Citation2019). Our results demonstrate that these northern vegetation types also decrease in their representation within protected areas. We attribute this to three reasons. First, as seen for the baseline vegetation distribution (), generally, the more prolific vegetation types occupy more protected areas than those with lower abundances. Hence, as these vegetation types decrease in total abundance, it stands to reason that their representation within protected areas will decline. Second, protected areas are generally situated in more southern regions rather than the northernmost edges of the Arctic, where these northern vegetation types can find sanctuary. This interpretation is validated by the fact that the refugia we located are clustered around the northernmost edges of the terrestrial Arctic. In our realistic model, they are especially abundant in the Canadian Archipelago, which contains most of the terrestrial High Arctic. The climate will stay unsuitable for southern vegetation types in these regions at least until 2050. Lastly, Arctic protected areas were not established with the conservation of vegetation types in mind (CAFF 2013); therefore, it stands to reason that vegetation types of conservation importance have not been recognized and hence prioritized.
Implications for flora, fauna and Indigenous people if vegetation types are left unprotected
Vegetation shifts have been observed to have outcomes for species and communities across trophic levels (Myers-Smith et al. Citation2011; Wheeler, Høye, and Svenning Citation2018). Threatened vegetation types may lead to the increased vulnerability of endemic flora and fauna, especially those that occur only in the High Arctic, which are most at risk. For example, there is evidence that vegetation exerts bottom-up control on caribou populations, as increasing shrubification decreases pasture quality (Fauchald et al. Citation2017). This decline is exacerbated by the loss of lichen-rich vegetation types, which negatively affects caribou populations owing to a loss of winter foraging options (Cornelissen et al. Citation2001; Joly, Jandt, and Klein Citation2009). This reduction of lichen in their diets can lead to increased methane emissions (Hansen et al. Citation2018), which then contributes to the global greenhouse effect to exacerbate climate-driven pressures on vulnerable Arctic vegetation. Indigenous knowledge also shows that caribou populations have already adopted more northern migration patterns (Ksenofontov, Backhaus, and Schaepman-Strub Citation2019). This can, in turn, have negative consequences for Indigenous communities that depend on caribou for food and income (Nuttall et al. Citation2005; Joly, Jandt, and Klein Citation2009). Without focused conservation efforts on maintaining these vegetation types, the species depending on them will also become threatened with extinction.
Implications of land use change on threatened vegetation types if left unprotected
Climate warming and technological advances have opened up the Arctic as a new frontier in economic development. Increasing interest in commodities such as oil, gas, and mineral resources will naturally lead to increased infrastructure requirements in the Arctic, which may, in turn, intensify disturbances in Arctic ecosystems. Surface disturbances such as road networks and settlements have led to permafrost degradation through soil warming (Forbes, Ebersole, and Strandberg Citation2001). Off-road vehicles like tundra tractors can destroy endemic vegetation and leave the tracks visible for decades as vegetation struggles to recover (Forbes, Ebersole, and Strandberg Citation2001). A study of the Alaska North Slope demonstrated that 34 percent of the area was affected by oil development by 2010 (Raynolds et al. Citation2014). Further exploration has already been proposed, such as a 3D seismic survey covering 63,000 km of trails within the Arctic National Wildlife Refugia in Alaska (SAExploration Citation2018). A recent study demonstrated that this could result in mid- to high-level impacts on 122 km2 of the area in question, leading to increased thermokarst formation and erosion and negatively impacting moist vegetation types (Raynolds et al. Citation2020). Additionally, vehicle tires can significantly increase the dispersal distance of southern invaders, such as Salix lanata, which has been found to occur in many roadside areas, replacing lichen and moss cover (Raynolds et al. Citation2014). Local warming due to the settlements also generates pockets of suitable habitats in latitudes where southern vegetation could not otherwise persist (Forbes, Ebersole, and Strandberg Citation2001).
Permafrost thaw is critically threatening Arctic infrastructures (Hjort et al. Citation2018), and their collapse could lead to dramatic consequences for terrestrial ecosystems and Indigenous livelihoods. Because the vegetation projections did not account for human land use modification, this study severely understates their effects on vegetation shifts. At the pan-Arctic scale, a combination of economic, geopolitical, climatic, infrastructure, and ecological factors lead to uncertainty in the future spatial distribution of development pressures and their degree of impact (Scibilia et al. Citation2015). Therefore, it is essential to predefine conservation areas for the currently unprotected and threatened vegetation types before widespread development begins in the increasingly accessible Arctic. Complementing protected areas—biodiversity conservation schemes developed for other regions of the world, such as around mining sites (International Council on Mining & Metals Citation2010)—need to be adapted to Arctic conditions to prevent loss of vegetation where industrial development outside of protected areas is allowed.
Implications of using climate change refugia for land conservation and management
Globally, protected areas are 10.6 percent richer in species diversity than nonprotected areas (Gray et al. Citation2016). Nevertheless, conserving biodiversity using protected areas poses difficulties under climate change. A study assessing the protected areas of Canada found that climate change will lead to over 40 percent of the protected areas experiencing a change in biome type, with the total extent of the Canadian tundra standing to decline by 38 to 79 percent (Lemieux and Scott Citation2005). In order to use limited resources and protect threatened vegetation most effectively, efforts toward in situ management must be focused on areas where the vegetation is likely to persist under global change, such as climate change refugia for vegetation. There is skepticism over the use of refugia as areas where vegetation may retreat until conditions in the surrounding environment become more favorable (Morelli et al. Citation2020). Vegetation shifts due to climate warming are projected to continue and intensify; therefore, the time periods required until favorable conditions return may be longer than the existence of these refugia. However, they may serve a powerful purpose by buying time for the climate adaptation of vulnerable species and ecological communities (Morelli et al. Citation2020). Adjusting Arctic protection efforts in mitigating the consequences of global change with a focus on relatively transient climate change refugia may aid in a long-term transformation of these threatened vegetation types into novel community assemblages (i.e., ecological replacements) that have adapted to these environmental changes while performing the same ecological and habitat functions (Morelli et al. Citation2020). This process has been documented in the late Quaternary (Jackson and Overpeck Citation2000).
Limitations and urgent need for comprehensive predictions of Arctic vegetation type distribution
The aim of this study is to construct a first assessment of the protected status of Arctic vegetation types in light of climate change based on new vegetations based on existing methodology. The shifts in vegetation distribution were predicted under various assumptions about climate change and tree dispersal rate scenarios from an existing approach (Pearson et al. Citation2013b). However, the general pattern of abundant vegetation types being better represented within protected areas holds, regardless of the map or model used (Appendix B). Our vegetation projections only rendered predictions for 42 percent of the pan-Arctic area. Specifically, they excluded glaciers (including nunataks), barren lands, and wetlands. Subsequently, we were unable to assess the future distribution of wetland and barren vegetation types, classify their risk of collapse, and locate potential refugia. Therefore, our results do not consider the potential of the assessed vegetation types to disperse into areas currently covered by these unassessed vegetation types and vice versa. Novel approaches in vegetation modeling that take the complex hydrology of the Arctic go beyond the scope of this initial evaluation but are necessary to understand the future of barrens, glaciers, and wetlands.
Glaciers currently cover nearly one-third of the Arctic (D. A. Walker et al. Citation2005), but extensive climate change–induced glacier melt is predicted (Hinzman et al. Citation2005; Alley et al. Citation2010). Vegetation succession following retreating glaciers in the Arctic follows the same patterns as elsewhere; however, these processes occur at larger temporal scales and may be less relevant for the next thirty years (Hodkinson, Coulson, and Webb Citation2003; Raynolds and Walker Citation2009). Vegetation growth response to warming is slower in the High Arctic than in the Low Arctic due to lower growing season temperatures, seasonal length, and nutrient availability (M. D. Walker et al. Citation2006). In Svalbard, for instance, vascular plant establishment was highly limited for the first century after glacial retreat (Hodkinson, Coulson, and Webb Citation2003). Additionally, vegetation can take up to 500 years to reach equilibrium after glacial retraction in Greenland (Lunt, de Noblet-Ducoudré, and Charbit Citation2004). Therefore, the inclusion of glaciers would likely have had limited impacts on the results for threatened vegetation types shown here for 2050. Nevertheless, they would be crucial for imminent studies investigating the terrestrial Arctic’s future at longer timescales.
One-quarter of the terrestrial Arctic consists of barren lands (D. A. Walker et al. Citation2005), which were excluded from this analysis. Therefore, the northern vegetation types may be less threatened than indicated by this study because they may expand into currently barren areas. Including barren lands in future studies would likely lead to predictions of northern vegetation types being slightly more abundant and increasing over centennial periods. However, due to the slow response in the development of soils and vegetation, the timescales at which this northern expansion into barren lands occurs may be longer than the temporal span of our study, and this expansion may be further limited because barren lands lack soil sufficient enough to support vegetation (Pearson et al. Citation2013b).
Wetlands constitute 7 percent of the Arctic vegetated area (D. A. Walker et al. Citation2005). Predictions for future wetland distribution are particularly difficult due to the complexity of the hydrological processes regulating them (Walvoord and Kurylyk Citation2016). Permafrost thaw, increasing precipitation, ice melt, and evaporation due to warming influence the abundance and distribution of surface water, indirectly affecting wetlands (Woo and Young Citation2006; White et al. Citation2007). In the southern areas with discontinuous permafrost, ponds are generally in decline as permafrost thaw increases drainage (Yoshikawa and Hinzman Citation2003; Smith Citation2005; Riordan, Verbyla, and McGuire Citation2006). Conversely, the thawing of continuous permafrost in the High Arctic has increased the abundance of thaw ponds (Smith Citation2005). In the Canadian Arctic, this trend of thermokarst pond formation has been shown to occur at rapid paces (Farquharson et al. Citation2019). This pattern of wetland development means that, generally, southern vegetation types would have more potential areas of expansion, whereas northern areas may become further displaced by expanding wetland. We hypothesize that the inclusion of wetlands in this study could consequently have a reinforcing effect on the observed patterns of threatened vegetation types. Though wetlands are crucial because of the abundance of migratory birds dependent on them, they make up a relatively small portion of the vegetated pan-Arctic and are generally better protected than other vegetation types. However, this may change significantly in the future because of climate change. Our study highlights the need for further focus on these poorly understood vegetation types in longer-term predictions.
Due to limited data availability in the Arctic, we could only analyze two of the five IUCN criteria. Therefore, the assigned risk category only represents the minimal risk and could potentially be higher, both in the present and in the future. Though it is recommended that as many criteria as possible be assessed, the IUCN Red List of Ecosystems was created with the purpose of flexibility in the use of data containing variations in quality and coverage (Bland et al. Citation2015). Therefore, as data availability increases, this risk assessment will provide valuable information as a starting point for future assessments.
Uncertainties in future vegetation distributions are inherent to predictions based on climate models with many uncertain assumptions, where one model may be no more or less valid than the other (Intergovernmental Panel on Climate Change Citation2000). Our selection of the realistic future model with regard to climate and emission scenarios is therefore subjective. An alternative definition of refugia that is not limited to only the realistic model would be to consider all of the pixels in all vegetation projections that are unchanged and then classify them according to the number of models that agree with the refugia assignment (Appendix D). However, this creates a risk of overestimating true refugia, while also not considering that the models and scenarios used to predict the vegetation projections are, in fact, not equally valid. There is a large spread of the vegetation type abundances across the models, making the results, especially for the southern vegetation types G3 (nontussock sedge, dwarf shrub, moss tundra), G4 (tussock sedge, dwarf shrub, moss tundra), and S1 (erect dwarf shrub tundra), more uncertain ( and Appendix B). This spread seems to be driven by the unlimited tree dispersal models where the taiga encroaches rapidly into areas where these southern vegetation types are present. Yet this is less likely than the other models, because tree dispersal rates have only been observed up to 20 km in the Arctic (Lescop-Sinclair and Payette Citation1995; Lloyd et al. Citation2002). Nonetheless, 75 percent of the pixels in the realistic model showed a model agreement with at least half of the models. Additionally, the general trend of increase in southern vegetation types and decrease in northern vegetation types still holds within and outside of protected areas, as demonstrated for most results by the minimum and maximum scenario envelope.
Though land surface schemes for Earth system models and vegetation development models are being adapted to Arctic tundra conditions, parameterizations at the Arctic tundra vegetation type level, including all vegetation types, need to be implemented, with biotic and abiotic interactions integrated with holistic modeling approaches at the pan-Arctic scale. Furthermore, the inclusion of human land use scenarios (e.g., reindeer herding densities, potential mining sites, road development) will be necessary for future modeling efforts to allow for informed policies and decisions.
Conclusions
This study identifies baseline and future abundances of Arctic vegetation types within protected areas and identifies five out of the eight classified vegetation types to be endangered or critically endangered for collapse by 2050. We additionally identify potential climate change refugia for threatened vegetation types using the raster version of the Circumpolar Arctic Vegetation Map and predictions of future Arctic vegetation distribution. These refugia are predominately present in the northernmost reaches of the terrestrial Arctic tundra, which, to date, generally lack protected areas in comparison to more southern regions. Though uncertainties exist within the maps provided in this first assessment, the general trends seen in this study are valuable in guiding future conservation efforts. Further studies on the development of Arctic vegetation types that include the whole Arctic—especially wetlands, barrens, and ice-covered areas—are urgently needed. They could provide complete and precise findings to improve and adapt conservation efforts to climate change–induced biota shifts. Moreover, we recommend independent validation of these hypothetical predictions to better incorporate climate change refugia into designated protected areas. This could potentially be achieved through recent validation methods that compare predictions of refugia to local measures of species richness, endemic species persistence, genetic diversity, plant functional traits, and/or demographic variables (Barrows et al. Citation2020).
This study aims to shift the focus of pan-Arctic protection efforts toward higher scales of biological organization, from species to communities and ecosystems or, in this case, vegetation types. Endemic tundra vegetation types face the threat of ecosystem collapse due to global change. The establishment of refugia for the vegetation types identified here could protect them as refugia have done over the history of life on Earth (Jackson and Overpeck Citation2000; Alley et al. Citation2010). The protection of vegetation refugia would additionally have positive effects on Arctic fauna and climate regulation through bottom-up biotic and abiotic interactions. However, the integration of vegetation types for climate change–adapted conservation in the Arctic requires urgent collaboration between policymakers and Indigenous peoples as the area becomes increasingly under pressure from exploration and rapid infrastructure development. As experienced in the recent decade, Arctic change is rapid. Extreme events, including extreme winter precipitation and summer drought, are already affecting Arctic ecosystems through major disturbance events such as extensive flooding and fires, adding yet another dimension of abrupt change to mitigate in the future. Without a plan already in place for the protection of these critically important Arctic landscapes, we cannot enable the sustainability of economic and structural development in what is increasingly no longer one of the world’s last truly wild places.
Data and Code Availability
All code associated with data curation and analysis is available at the following GitHub repository: https://github.com/PlekhanovaElena/Arctic_vegetation_prediction. All resulting data are available for download here: https://doi.org/10.5281/zenodo.6902764.
Supplemental Material
Download Zip (10.5 MB)Acknowledgments
We thank Ariane K. A. Goerens for her contributions to an earlier version of this study. We acknowledge the World Climate Research Programme, which, through its Working Group on Coupled Modelling, coordinated and promoted CMIP6. We thank the climate modeling groups for producing and making available their model output, the Earth System Grid Federation (ESGF) for archiving the data and providing access, and the multiple funding agencies who support CMIP6 and ESGF.
Disclosure statement
No potential conflict of interest was reported by the author(s).
Supplementary material
Supplemental data for this article can be accessed online at https://doi.org/10.1080/15230430.2023.2203478
Additional information
Funding
References
- Alley, R. B., J. T. Andrews, J. Brigham-Grette, G. K. C. Clarke, K. M. Cuffey, J. J. Fitzpatrick, S. Funder, et al. 2010. History of the Greenland Ice Sheet: Paleoclimatic insights. Quaternary Science Reviews doi:10.1016/j.quascirev.2010.02.007.
- Barrows, C. W., A. R. Ramirez, L. C. Sweet, T. L. Morelli, C. I. Millar, N. Frakes, J. Rodgers, and M. F. Mahalovich. 2020. Validating climate-change refugia: Empirical bottom-up approaches to support management actions. Frontiers in Ecology and the Environment 18 (5): 298–16. doi:10.1002/fee.2205.
- Bjorkman, A. D., M. García Criado, I. H. Myers-Smith, V. Ravolainen, I. S. Jónsdóttir, K. B. Westergaard, J. P. Lawler, et al. 2020. Status and trends in Arctic vegetation: Evidence from experimental warming and long-term monitoring. Ambio 49, no. 3: 678–92. doi:10.1007/s13280-019-01161-6.
- Bland, L. M., D. A. Keith, R. M. Miller, N. J. Murray, and J. P. Rodriguez. 2015. Guidelines for the application of IUCN Red List of ecosystems categories and criteria. In Guidelines for the application of IUCN Red List of ecosystems categories and criteria, 44–50. Gland, Switzerland: IUCN. doi:10.2305/iucn.ch.2016.rle.1.en.
- Blok, D., M. M. P. D. Heijmans, G. Schaepman-Strub, A. V. Kononov, T. C. Maximov, and F. Berendse. 2010. Shrub expansion may reduce summer permafrost thaw in Siberian tundra. Global Change Biology 16, no. 4: 1296–305. doi:10.1111/j.1365-2486.2009.02110.x.
- Boelman, N. T., L. Gough, J. Wingfield, S. Goetz, A. Asmus, H. E. Chmura, J. S. Krause, J. H. Perez, S. K. Sweet, and K. C. Guay. 2015. Greater shrub dominance alters breeding habitat and food resources for migratory songbirds in Alaskan Arctic tundra. Global Change Biology 21, no. 4: 1508–20. doi:10.1111/gcb.12761.
- Bonfils, C. J. W., T. J. Phillips, D. M. Lawrence, P. Cameron-Smith, W. J. Riley, and Z. M. Subin. 2012. On the influence of shrub height and expansion on northern high latitude climate. Environmental Research Letters 7, no. 1: 015503. doi:10.1088/1748-9326/7/1/015503.
- Chapin, F. S., M. Sommerkorn, M. D. Robards, and K. Hillmer-Pegram. 2015. Ecosystem stewardship: A resilience framework for Arctic conservation. Global Environmental Change 34: 207–17. doi:10.1016/j.gloenvcha.2015.07.003.
- Chapin, F. S., and A. M. Starfield. 1997. Time lags and novel ecosystems in response to transient climatic change in Arctic Alaska. Climatic Change 35, no. 4: 449–61. doi:10.1023/A:1005337705025.
- Chylek, P., C. Folland, J. D. Klett, M. Wang, N. Hengartner, G. Lesins, and M. K. Dubey. 2022. Annual mean Arctic amplification 1970–2020: Observed and simulated by CMIP6 climate models. Geophysical Research Letters 49, no. 13. doi:10.1029/2022GL099371.
- Circumpolar Flora Group. 2022. CAFF - About the Circumpolar Flora Group (CFG). https://www.caff.is/flora-cfg/about-cfg
- Conservation of Arctic Flora and Fauna. 2013. Arctic biodiversity assessment. Status and trends in Arctic biodiversity. Conservation of Arctic flora and fauna. Arctic Biodiversity Assessment.
- Conservation of Arctic Flora and Fauna and Protection of the Arctic Marine Environment. 2017. Arctic protected areas: Indicator report, 2017: Conservation of Arctic flora and fauna and protection of the Arctic marine environment.
- Cornelissen, J. H. C., T. V. Callaghan, J. M. Alatalo, A. Michelsen, E. Graglia, A. E. Hartley, D. S. Hik, et al. 2001. Global change and Arctic ecosystems: Is lichen decline a function of increases in vascular plant biomass? Journal of Ecology 89, no. 6: 984–94. doi:10.1046/j.1365-2745.2001.00625.x.
- Dudley, N. 2008. Guidelines for applying protected area management categories. In Guidelines for applying protected area management categories, ed. N. Dudley, 43–48. Gland, Switzerland: IUCN. doi:10.2305/iucn.ch.2008.paps.2.en.
- Elmendorf, S. C., G. H. R. Henry, R. D. Hollister, R. G. Björk, N. Boulanger-Lapointe, E. J. Cooper, J. H. C. Cornelissen, et al. 2012. Plot-scale evidence of tundra vegetation change and links to recent summer warming. Nature Climate Change 2, no. 6: 453–7. doi:10.1038/nclimate1465.
- ESRI. 2017. ArcMap 10.5.1 [GIS Software] (10.5.1). Environmental Systems Research Institute, Inc.
- Eyring, V., S. Bony, G. A. Meehl, C. A. Senior, B. Stevens, R. J. Stouffer, and K. E. Taylor. 2016. Overview of the Coupled Model Intercomparison Project Phase 6 (CMIP6) experimental design and organization. Geoscientific Model Development 9, no. 5: 1937–58. doi:10.5194/gmd-9-1937-2016.
- Farquharson, L. M., V. E. Romanovsky, W. L. Cable, D. A. Walker, S. V. Kokelj, and D. Nicolsky. 2019. Climate change drives widespread and rapid thermokarst development in very cold permafrost in the Canadian High Arctic. Geophysical Research Letters 46, no. 12: 6681–9. doi:10.1029/2019GL082187.
- Fauchald, P., T. Park, H. Tømmervik, R. Myneni, and V. H. Hausner. 2017. Arctic greening from warming promotes declines in caribou populations. Science Advances 3, no. 4. doi:10.1126/sciadv.1601365.
- Fick, S. E., and R. J. Hijmans. 2017. WorldClim 2: New 1-km spatial resolution climate surfaces for global land areas. International Journal of Climatology 37, no. 12: 4302–15. doi:10.1002/JOC.5086.
- Forbes, B. C., J. J. Ebersole, and B. Strandberg. 2001. Anthropogenic disturbance and patch dynamics in circumpolar Arctic ecosystems. Conservation Biology 15, no. 4: 954–69. doi:10.1046/j.1523-1739.2001.015004954.x.
- Gray, C. L., S. L. L. Hill, T. Newbold, L. N. Hudson, L. Boïrger, S. Contu, A. J. Hoskins, S. Ferrier, A. Purvis, and J. P. W. Scharlemann. 2016. Local biodiversity is higher inside than outside terrestrial protected areas worldwide. Nature Communications 7, no. 1: 1–7. doi:10.1038/ncomms12306.
- Hannah, L., G. F. Midgley, and D. Millar. 2002. Climate change-integrated conservation strategies. Global Ecology and Biogeography 11, no. 6: 485–95. doi:10.1046/j.1466-822X.2002.00306.x.
- Hansen, K. K., M. A. Sundset, L. P. Folkow, M. Nilsen, and S. D. Mathiesen. 2018. Methane emissions are lower from reindeer fed lichens compared to a concentrate feed. Polar Research 37, no. 1: 1505396. doi:10.1080/17518369.2018.1505396.
- Heller, N. E., and E. S. Zavaleta. 2009. Biodiversity management in the face of climate change: A review of 22 years of recommendations. Biological Conservation 142, no. 1: 14–32. doi:10.1016/j.biocon.2008.10.006.
- Hinzman, L. D., N. D. Bettez, W. R. Bolton, F. S. Chapin, M. B. Dyurgerov, C. L. Fastie, B. Griffith, et al. 2005. Evidence and implications of recent climate change in Northern Alaska and other Arctic regions. Climatic Change 72, no. 3: 251–98. doi:10.1007/s10584-005-5352-2.
- Hjort, J., O. Karjalainen, J. Aalto, S. Westermann, V. E. Romanovsky, F. E. Nelson, B. Etzelmüller, and M. Luoto. 2018. Degrading permafrost puts Arctic infrastructure at risk by mid-century. Nature Communications 9, no. 1. doi:10.1038/s41467-018-07557-4.
- Hodkinson, I. D., S. J. Coulson, and N. R. Webb. 2003. Community assembly along proglacial chronosequences in the high Arctic: Vegetation and soil development in north-west Svalbard. Journal of Ecology 91, no. 4: 651–63. doi:10.1046/j.1365-2745.2003.00786.x.
- Intergovernmental Panel on Climate Change. 2000. IPCC Special Report on Emissions Scenarios (SRES) of working group III. https://citeulike-article-id:9904924
- International Council on Mining & Metals. 2010. Mining and biodiversity: A collection of case studies–2010 edition. https://bobbloomfield.files.wordpress.com/2013/03/2010icmm-biodiversity-case-studies.pdf
- Jackson, S. T., and J. T. Overpeck. 2000. Responses of plant populations and communities to environmental changes of the late Quaternary. Paleobiology 26, no. S4: 194–220. doi:10.1017/s0094837300026932.
- Joly, K., R. R. Jandt, and D. R. Klein. 2009. Decrease of lichens in Arctic ecosystems: The role of wildfire, caribou, reindeer, competition and climate in north-western Alaska. Polar Research 28, no. 3: 433–42. doi:10.1111/j.1751-8369.2009.00113.x.
- Juszak, I., A. M. Erb, T. C. Maximov, and G. Schaepman-Strub. 2014. Arctic shrub effects on NDVI, summer albedo and soil shading. Remote Sensing of Environment 153: 79–89. doi:10.1016/j.rse.2014.07.021.
- Kennedy, C. M., J. R. Oakleaf, D. M. Theobald, S. Baruch-Mordo, and J. Kiesecker. 2019. Managing the middle: A shift in conservation priorities based on the global human modification gradient. Global Change Biology 25, no. 3: 811–26. doi:10.1111/gcb.14549.
- Kruse, S., and U. Herzschuh. 2022. Regional opportunities for tundra conservation in the next 1000 years. ELife 11. doi:10.7554/elife.75163.
- Ksenofontov, S., N. Backhaus, and G. Schaepman-Strub. 2019. ‘There are new species’: Indigenous knowledge of biodiversity change in Arctic Yakutia. Polar Geography 42, no. 1: 34–57. doi:10.1080/1088937X.2018.1547326.
- Kumpula, T., A. Pajunen, E. Kaarlejärvi, B. C. Forbes, and F. Stammler. 2011. Land use and land cover change in Arctic Russia: Ecological and social implications of industrial development. Global Environmental Change 21, no. 2: 550–62. doi:10.1016/j.gloenvcha.2010.12.010.
- La Sorte, F. A., and W. Jetz. 2012. Tracking of climatic niche boundaries under recent climate change. Journal of Animal Ecology 81, no. 4: 914–25. doi:10.1111/j.1365-2656.2012.01958.x.
- Lemieux, C. J., and D. J. Scott. 2005. Climate change, biodiversity conservation and protected area planning in Canada. Canadian Geographer 49, no. 4: 384–97. doi:10.1111/j.0008-3658.2005.00103.x.
- Lescop-Sinclair, K., and S. Payette. 1995. Recent advance of the Arctic treeline along the Eastern Coast of Hudson Bay. The Journal of Ecology 83, no. 6: 929. doi:10.2307/2261175.
- Lloyd, A. H., T. S. Rupp, C. L. Fastie, and A. M. Starfield. 2002. Patterns and dynamics of treeline advance on the Seward Peninsula, Alaska. Journal of Geophysical Research D: Atmospheres 108, no. D2. doi:10.1029/2001jd000852.
- Loranty, M. M., and S. J. Goetz. 2012. Shrub expansion and climate feedbacks in Arctic tundra. Environmental Research Letters 7, no. 1: 011005. doi:10.1088/1748-9326/7/1/011005.
- Loranty, M. M., S. J. Goetz, and P. S. A. Beck. 2011. Tundra vegetation effects on pan-Arctic albedo. Environmental Research Letters 6, no. 2: 024014. doi:10.1088/1748-9326/6/2/029601.
- Lunt, D. J., N. de Noblet-Ducoudré, and S. Charbit. 2004. Effects of a melted Greenland ice sheet on climate, vegetation, and the cryosphere. Climate Dynamics 23, no. 7–8: 679–94. doi:10.1007/s00382-004-0463-4.
- Masrur, A., A. Taylor, L. Harris, J. Barnes, and A. Petrov. 2022. Topography, climate and fire history regulate wildfire activity in the Alaskan Tundra. Journal of Geophysical Research: Biogeosciences 127, no. 3: e2021JG006608. doi:10.1029/2021JG006608.
- Morelli, T. L., C. W. Barrows, A. R. Ramirez, J. M. Cartwright, D. D. Ackerly, T. D. Eaves, J. L. Ebersole, et al. 2020. Climate-change refugia: Biodiversity in the slow lane. Frontiers in Ecology and the Environment 18, no. 5: 228–34. doi:10.1002/fee.2189.
- Morelli, T. L., C. Daly, S. Z. Dobrowski, D. M. Dulen, J. L. Ebersole, S. T. Jackson, J. D. Lundquist, et al. 2016. Managing climate change refugia for climate adaptation. PLoS ONE 11, no. 8: 1–17. doi:10.1371/journal.pone.0159909.
- Myers-Smith, I. H., B. C. Forbes, M. Wilmking, M. Hallinger, T. Lantz, D. Blok, K. D. Tape, et al. 2011. Shrub expansion in tundra ecosystems: Dynamics, impacts and research priorities. Environmental Research Letters 6, no. 4: 045509. doi:10.1088/1748-9326/6/4/045509.
- Myers-Smith, I. H., J. T. Kerby, G. K. Phoenix, J. W. Bjerke, H. E. Epstein, J. J. Assmann, C. John, et al. 2020. Complexity revealed in the greening of the Arctic. Nature Climate Change 10, no. 2: 106–17. doi:10.1038/s41558-019-0688-1.
- Myneni, R. B., C. D. Keeling, C. J. Tucker, G. Asrar, and R. R. Nemani. 1997. Increased plant growth in the northern high latitudes from 1981 to 1991. Nature 386, no. 6626: 698–702. doi:10.1038/386698a0.
- Noss, R. F. 2001. Beyond Kyoto: Forest management in a time of rapid climate change. Conservation Biology 15, no. 3: 578–90. doi:10.1046/j.1523-1739.2001.015003578.x.
- Notz, D., and S. Community. 2020. Arctic sea ice in CMIP6. Geophysical Research Letters 47, no. 10: e2019GL086749. doi:10.1029/2019GL086749.
- Nuttall, M., F. Berkes, B. Forbes, G. Kofinas, T. Vlassova, and G. W. Wenzel. 2005. Hunting, herding, fishing, and gathering: Indigenous peoples and renewable resource use in the Arctic. In Arctic Climate Impact Assessment, 649–690. Cambridge: Oxford University Press. https://www.caff.is/assessment-series/37-arctic-climate-impact-assessment-acia-scientific-report
- Oehri, J., G. Schaepman-Strub, J. S. Kim, R. Grysko, H. Kropp, I. Grünberg, V. Zemlianskii, et al. 2022. Vegetation type is an important predictor of the Arctic summer land surface energy budget. Nature Communications 13, no. 1: 21–7. doi:10.1038/s41467-022-34049-3.
- Pearson, R. G., S. J. Phillips, M. M. Loranty, P. S. A. Beck, T. Damoulas, S. J. Knight, and S. J. Goetz. 2013a. Predicted Arctic vegetation distribution shifts under future climate change. Arctic Data Center, University of California, Santa Barbara. doi:10.18739/A2V935.
- Pearson, R. G., S. J. Phillips, M. M. Loranty, P. S. A. Beck, T. Damoulas, S. J. Knight, and S. J. Goetz. 2013b. Shifts in Arctic vegetation and associated feedbacks under climate change. Nature Climate Change 3, no. 7: 673–7. doi:10.1038/nclimate1858.
- Phoenix, G. K., and J. W. Bjerke. 2016. Arctic browning: Extreme events and trends reversing Arctic greening. Global Change Biology 22, no. 9: 2960–2. doi:10.1111/gcb.13261.
- Rantanen, M., A. Y. Karpechko, A. Lipponen, K. Nordling, O. Hyvärinen, K. Ruosteenoja, T. Vihma, and A. Laaksonen. 2022. The Arctic has warmed nearly four times faster than the globe since 1979. Communications Earth & Environment 3, no. 1: 1–10. doi:10.1038/s43247-022-00498-3.
- Raynolds, M. K., J. C. Jorgenson, M. T. Jorgenson, M. Kanevskiy, A. K. Liljedahl, M. Nolan, M. Sturm, and D. A. Walker. 2020. Landscape impacts of 3D‐seismic surveys in the Arctic National Wildlife Refuge, Alaska. Ecological Applications 1–20. doi:10.1002/eap.2143.
- Raynolds, M. K., and D. A. Walker. 2009. Effects of deglaciation on circumpolar distribution of Arctic vegetation. Canadian Journal of Remote Sensing 35, no. 2: 118–29. doi:10.5589/m09-006.
- Raynolds, M. K., D. A. Walker, K. J. Ambrosius, J. Brown, K. R. Everett, M. Kanevskiy, G. P. Kofinas, V. E. Romanovsky, Y. Shur, and P. J. Webber. 2014. Cumulative geoecological effects of 62 years of infrastructure and climate change in ice-rich permafrost landscapes, Prudhoe Bay Oilfield, Alaska. Global Change Biology 20, no. 4: 1211–24. doi:10.1111/gcb.12500.
- Raynolds, M. K., D. A. Walker, A. Balser, C. Bay, M. Campbell, M. M. Cherosov, F. J. A. Daniëls, et al. 2019. A raster version of the Circumpolar Arctic Vegetation Map (CAVM). Remote Sensing of Environment 232: 111297. doi:10.1016/j.rse.2019.111297.
- R Development Core Team. 2017. R: A language and environment for statistical computing. Vienna, Austria: R Foundation for Statistical Computing. http://www.R-project.org
- Riordan, B., D. Verbyla, and A. D. McGuire. 2006. Shrinking ponds in subarctic Alaska based on 1950-2002 remotely sensed images. Journal of Geophysical Research: Biogeosciences 111, no. G4. doi:10.1029/2005JG000150.
- Rundqvist, S., H. Hedenås, A. Sandström, U. Emanuelsson, H. Eriksson, C. Jonasson, and T. V. Callaghan. 2011. Tree and shrub expansion over the past 34 years at the tree-line near Abisko, Sweden. Ambio 40, no. 6: 683–92. doi:10.1007/s13280-011-0174-0.
- SAExploration. 2018. Marsh Creek 3D plan of operations winter seismic survey. https://eplanning.blm.gov/public_projects/nepa/111085/153349/187888/Marsh_Creek_Plan_of_Operations_Submitted_May2018.pdf
- Scibilia, E., D. A. Walker, G. Kofinas, M. Raynolds, M. Kanevskiy, Y. Shur, K. Ambrosius, et al. 2015. Rapid Arctic Transitions due to Infrastructure and Climate (RATIC): A contribution to ICARP III. doi:10.13140/RG.2.1.4089.0006.
- Serreze, M. C., J. E. Walsh, F. S. Chapin, T. Osterkamp, M. Dyurgerov, V. Romanovsky, W. C. Oechel, J. Morison, T. Zhang, and R. G. Barry. 2000. Observational evidence of recent change in the northern high-latitude environment. Climatic Change 46, no. 1/2: 159–207. doi:10.1023/A:1005504031923.
- Smith, L. C. 2005. Disappearing Arctic Lakes. Science 308, no. 5727: 1429–1429. doi:10.1126/science.1108142.
- Stewart, L., I. G. Alsos, C. Bay, A. L. Breen, C. Brochmann, N. Boulanger-Lapointe, O. Broennimann, et al. 2016. The regional species richness and genetic diversity of Arctic vegetation reflect both past glaciations and current climate. Global Ecology and Biogeography 25, no. 4: 430–42. doi:10.1111/geb.12424.
- Stralberg, D., C. Carroll, and S. E. Nielsen. 2020. Toward a climate-informed North American protected areas network: Incorporating climate-change refugia and corridors in conservation planning. Conservation Letters 13, no. 4. doi:10.1111/conl.12712.
- Sturm, M., C. Racine, and K. Tape. 2001. Increasing shrub abundance in the Arctic. Nature 411, no. 6837: 546–7. doi:10.1038/35079180.
- Sulman, B. N., V. G. Salmon, C. M. Iversen, A. L. Breen, F. Yuan, and P. E. Thornton. 2021. Integrating arctic plant functional types in a land surface model using above- and belowground field observations. Journal of Advances in Modeling Earth Systems 13, no. 4: e2020MS002396. doi:10.1029/2020MS002396.
- Swann, A. L., I. Y. Fung, S. Levis, G. B. Bonan, and S. C. Doney. 2010. Changes in Arctic vegetation amplify high-latitude warming through the greenhouse effect. Proceedings of the National Academy of Sciences of the United States of America 107, no. 4: 1295–300. doi:10.1073/pnas.0913846107.
- Taberlet, P., and R. Cheddadi. 2002. Ecology: Quaternary refugia and persistence of biodiversity. Science 297, no. 5589: 2009–10. doi:10.1126/science.297.5589.2009.
- Thorne, J. H., M. Gogol-Prokurat, S. Hill, D. Walsh, R. M. Boynton, and H. Choe. 2020. Vegetation refugia can inform climate-adaptive land management under global warming. Frontiers in Ecology and the Environment 18, no. 5: 281–7. doi:10.1002/fee.2208.
- Tzedakis, P. C., I. T. Lawson, M. R. Frogley, G. M. Hewitt, and R. C. Preece. 2002. Buffered tree population changes in a Quaternary refugium: Evolutionary implications. Science 297, no. 5589: 2044–7. doi:10.1126/science.1073083.
- Venter, O., E. W. Sanderson, A. Magrach, J. R. Allan, J. Beher, K. R. Jones, H. P. Possingham, et al. 2016. Global terrestrial human footprint maps for 1993 and 2009. Scientific Data 3, no. 1. doi:10.1038/sdata.2016.67.
- Virkkala, A. M., S. M. Natali, B. M. Rogers, J. D. Watts, K. Savage, S. J. Connon, M. Mauritz, et al. 2022. The ABCflux database: Arctic-boreal CO2flux observations and ancillary information aggregated to monthly time steps across terrestrial ecosystems. Earth System Science Data 14, no. 1: 179–208. doi:10.5194/essd-14-179-2022.
- Walker, D. A., M. K. Raynolds, F. J. A. Daniëls, E. Einarsson, A. Elvebakk, W. A. Gould, A. E. Katenin, et al. 2005. The circumpolar Arctic vegetation map. Journal of Vegetation Science 16, no. 3: 267–82. doi:10.1111/j.1654-1103.2005.tb02365.x.
- Walker, M. D., C. H. Wahren, R. D. Hollister, G. H. R. Henry, L. E. Ahlquist, J. M. Alatalo, M. S. Bret-Harte, et al. 2006. Plant community responses to experimental warming across the tundra biome. Proceedings of the National Academy of Sciences of the United States of America 103, no. 5: 1342–6. doi:10.1073/pnas.0503198103.
- Walvoord, M. A., and B. L. Kurylyk. 2016. Hydrologic impacts of thawing permafrost-A review. Vadose Zone Journal 15, no. 6: vzj2016.01.0010. doi:10.2136/vzj2016.01.0010.
- Wheeler, H. C., T. T. Høye, and J. C. Svenning. 2018. Wildlife species benefitting from a greener Arctic are most sensitive to shrub cover at leading range edges. Global Change Biology 24, no. 1: 212–23. doi:10.1111/gcb.13837.
- White, D. M., S. Craig Gerlach, P. Loring, A. C. Tidwell, and M. C. Chambers. 2007. Food and water security in a changing Arctic climate. Environmental Research Letters 2, no. 4: 045018. doi:10.1088/1748-9326/2/4/045018.
- Wookey, P. A., R. Aerts, R. D. Bardgett, F. Baptist, K. Bråthen, J. H. C. Cornelissen, L. Gough, et al. 2009. Ecosystem feedbacks and cascade processes: Understanding their role in the responses of Arctic and alpine ecosystems to environmental change. Global Change Biology 15, no. 5: 1153–72. doi:10.1111/j.1365-2486.2008.01801.x.
- Woo, M. K., and K. L. Young. 2006. High Arctic wetlands: Their occurrence, hydrological characteristics and sustainability. Journal of Hydrology 320, no. 3–4: 432–50. doi:10.1016/j.jhydrol.2005.07.025.
- Yoshikawa, K., and L. D. Hinzman. 2003. Shrinking thermokarst ponds and groundwater dynamics in discontinuous permafrost near Council, Alaska. Permafrost and Periglacial Processes 14, no. 2: 151–60. doi:10.1002/ppp.451.
- Yu, L., G. Leng, and A. Python. 2022. Attribution of the spatial heterogeneity of Arctic surface albedo feedback to the dynamics of vegetation, snow and soil properties and their interactions. Environmental Research Letters 17, no. 1: 014036. doi:10.1088/1748-9326/ac4631.
- Zona, D., P. M. Lafleur, K. Hufkens, B. Bailey, B. Gioli, G. Burba, J. P. Goodrich, et al. 2022. Earlier snowmelt may lead to late season declines in plant productivity and carbon sequestration in Arctic tundra ecosystems. Scientific Reports 12, no. 1: 1–10. doi:10.1038/s41598-022-07561-1.