
ABSTRACT
Snow algae blooms are common occurrences in alpine systems and contribute to increasing snow and glacial ice melt rates. Despite the cosmopolitan distribution of snow algae, little is known about the role their life cycle plays in community composition and activity in snowpack. Mount Baker, in Washington, USA, is a rapidly changing alpine ecosystem. Here we present estimates of cellular biomass, microbial community composition, and primary productivity measurements associated with surficial snow algae blooms and a vertical profile within a snow pit to characterize the microbial ecology of this snowpack system. Chloromonas was the most abundant algae detected in our samples. Sphingobacteriaceae were the most dominant bacteria in samples where fungi were the most abundant eukaryote, whereas Chitinophagaceae dominated when Chlorophyceae were the most abundant eukaryote. In a snow pit vertical profile, we observed more algae in the green-pigmented, flagellated life cycle stage at depth (~30 cm below the surface) than at the surface where the astaxanthin-rich, aplanospore life cycle stage dominated. Higher resolution analyses revealed that Chloromonas-associated photosynthesis transcripts were more abundant at depth than at the surface of the snowpack. These results suggest that there is a photosynthetic niche within alpine snowpack that has unknown effects on the carbon budget and provides potentially undetected primary productivity resulting in a “cryptic” photosynthetic system.
Introduction
Snow algae are thought to be key drivers of biogeochemical cycles in alpine snowpacks (Hotaling, Hood, and Hamilton Citation2017). Previous studies have shown that blooms of highly pigmented algae play a role in amplifying glacier and snowpack melt (Thomas and Duval Citation1995; Stibal, Šabacká, and Žárský Citation2012) by decreasing surface albedo by 20 percent to 40 percent, causing a cascade of ecological implications (Lutz, Anesio, Edwards, and Benning Citation2015; Lutz et al. Citation2016; Ganey et al. Citation2017). Lowering of surface albedo due to pigmented microorganisms leads to increased light absorption, which enhances the melt of ice and snow (Musilova et al. Citation2016; Cook et al. Citation2017). Accelerated snowmelt mobilizes nutrients within the snowpack that subsequently stimulates additional algal growth (Ganey et al. Citation2017). Blooms often cover large areas of snow that can be quantified and tracked via satellite imagery (Takeuchi et al. Citation2006; Ganey et al. Citation2017; Huovinen, Ramírez, and Gómez Citation2018). However, the distinctive red-pigmented blooms observed on snow surfaces represent only one stage of the active snow algae life cycle and therefore surface surveys may underestimate their total ecological role.
Most snow algal blooms appear to be dominated by Chloromonas and Sanguina genera (Remias, Lütz-Meindl, and Lütz Citation2005; Remias et al. Citation2013; Procházková et al. Citation2019; Engstrom, Yakimovich, and Quarmby Citation2020). Studies in the Pacific Northwest have shown that Sanguina (formerly assigned to Chlamydomonas), Chlainomonas, and Chloromonas are the dominant snow algae taxa (Hoham Citation1974a, Citation1974b; Havig and Hamilton Citation2019; Engstrom, Yakimovich, and Quarmby Citation2020; Hamilton and Havig Citation2020; Hoham and Remias Citation2020). Microbial communities associated with algal blooms vary, with some studies suggesting co-occurrence of algae with members of the Betaproteobacteria and Bacteroidetes (Hoham and Remias Citation2020; Krug et al. Citation2020); however, these correlations do not appear to be specific across different algae taxa (Yakimovich, Engstrom, and Quarmby Citation2020). Fungal groups, including Basidiomycota, Ascomycete, and occasionally Chytridiomycota, have also been found to co-occur with snow algae (Brown, Olson, and Jumpponen Citation2015; Brown and Jumpponen Citation2019).
The proposed life cycle of snow algae begins on the soil surface following snowmelt in the summer, in a “spore-like” resting state known as an aplanospore (Kawecka Citation1981, Citation1986). These “spores” are then covered by snow, where it is hypothesized that they lie dormant until the start of snowmelt in early spring (Hoham and Duval Citation2001; Jones et al. Citation2001; Hoham et al. Citation2006). Once liquid water reaches the algae at the snow–soil interface, the aplanospores germinate and flagellate vertically through the snowpack within water veins that form between snow crystals (Remias Citation2012). The algae navigate via these water veins to a depth with optimal light irradiance, ~100 to 900 µmol m−2 s−1 (Remias, Lütz-Meindl, and Lütz Citation2005). As the season progresses and snowpack continues to melt, algae that were previously protected by overlying snow become exposed to higher levels of irradiance that, depending on elevation and cloud cover, can reach up to >3,000 µmol m−2 s−1 (Gorton, Williams, and Vogelmann Citation2001). Laboratory studies have found that high irradiances and ultraviolet (UV) light cause snow algae to lose their flagella and form aplanospores (Hoham and Remias Citation2020). This resting stage is characterized by asexual cells that synthesize copious amounts of the red photoprotectant pigment, astaxanthin (Badania Citation1986; Jones et al. Citation2001; Stibal et al. Citation2007). Astaxanthin aids the algae in reducing light irradiance at the snow’s surface by 50 percent (Gorton, Williams, and Vogelmann Citation2001). However, astaxanthin also decreases photosynthetic energy transfer (Zhang et al. Citation2017). When not producing astaxanthin, high UV light exposure inhibits photosynthesis in snow algae by 85 percent; during the production of astaxanthin, a 25 percent reduction of photosynthetic activity has been observed (Thomas and Duval Citation1995). As snow continues to melt through the spring and summer, algae accumulate in melt channels (Hoham and Ling Citation2000). For this reason, snowpacks in alpine systems that are not subjected to steep vertical gradients, where algae can accumulate during melt, may be ideal locations to study in situ snow algae life cycle dynamics.
The reduction of UV stress makes the interior of snowpack an ideal niche for algae, where they may be more productive despite the decrease in photosynthetic active radiation. Different snow algae life cycle stages can coexist in snowpack, with astaxanthin-producing cysts abundant on the surface and vegetative algal stages at depth (Gorton and Vogelmann Citation2003). Irradiance conditions rapidly change in the first few centimeters of the snowpack, with UV radiation dropping by 50 percent within the first 2 cm of snow down to nondetectable levels at 8 cm beneath the snow surface (Gorton and Vogelmann Citation2003). At least 1 percent of photosynthetic active radiation can be detected as far as 50 cm within the snowpack (Thomas and Duval Citation1995), with some data suggesting that light can penetrate as deep as 110 cm (Hoham and Mullet Citation1977). Thus, previous studies measuring snowpack primary production and carbon flux in surficial samples alone may miss activity at depth within the snowpack (Williams, Gorton, and Vogelmann Citation2003; Stibal et al. Citation2007; Hamilton and Havig Citation2017) where conditions for photosynthesis may be more ideal.
Mount Baker is an active volcano located in the North Cascade Mountain range, Washington State, USA. The Easton Glacier resides on Mount Baker’s southern slope and has been monitored since 1912. These long-term data indicate that the glacier has since receded ~1.95 km (Whelan and Bach Citation2017), with the regional climate experiencing warming of 0.2°C per decade since 1970 (Abatzoglou, Rupp, and Mote Citation2014). Easton Glacier is part of the 396 glaciers that feed Puget Sound’s largest watershed, the Skagit watershed. This watershed has seen a net decrease in glacial discharge of 24 percent ± 9 percent from 1969 to 2009, yet glacier outflow and melt still comprises 6 to 12 percent of Skagit River stream flow (Riedel and Larrabee Citation2016). Decrease in glacial discharge is expected to continue, resulting in changes in biodiversity (Jacobsen et al. Citation2012; Wilhelm et al. Citation2013). Alpine and glacial ecosystems are affected by a multitude of factors including precipitation, temperature, and anthropogenic effects (Harper Citation1993; Hansen and Nazarenko Citation2004; Ming et al. Citation2009; McCabe and Fountain Citation2013), to which snow algae are intrinsically tied. As these factors continue to influence alpine ecosystems, the effect on the snow and glacier microbiome remains unknown.
A baseline understanding of the core microbiomes and their ecological function in snowpack systems is critical for understanding the impacts climatic change has on these microbial communities (Stibal et al. Citation2020). We aimed to characterize the microbial ecology of the Mount Baker snowpack associated with the Easton Glacier valley. Prokaryotic and eukaryotic microbial diversity was assessed on select snow samples along an elevational gradient and at depth within alpine snowpack. Photosynthetic activity of the Mount Baker snowpack community was measured using primary productivity assays and metatranscriptomic analyses, which revealed gene expression patterns. Collectively these data shed light on Chloromonas abundance and activity in Pacific Northwest snowpack.
Methods
Site description and sample collection
Samples were collected along a southwest transect of Mount Baker off the Park Butte Trail (48.7012 N, 121.8054 W) leading up toward Easton Glacier (, ) from 946 to 1,157 m.a.s.l. during June 2018 and May 2019. This area is predominantly home to mountain hemlock, Douglas fir, and Pacific silver fir trees (Rosa Citation2016), whereas the plants within the low meadow area of Mount Baker are typically arctic lupine, mountain heather, huckleberry, and dwarf bilberry (Hagedorn and Flower Citation2021). During January through May, the average median snow depth from 2010 to 2023 was 2.2 m at the Schreibers Meadow (48.7 N, 121.82 W) snow course/aerial marker station and the average median snow water equivalent was 0.86 m in the same time period (Natural Resources Conservation Service Citation2023).
Figure 1. Mount Baker study site and images of snow conditions at each sample location. (a) Map of Mount Baker; dashed line represents estimated extent of snowpack on the mountain during sampling. Sample sites: (b) upper clearing (mixed, brown/red snow), (c) meadow (white snow), (d) snowpack/snow pit (layered snowpack sampling), and (e) trailhead (red snow). Culture flasks in pictures were the vessels used for primary productivity rate incubation experiments. “Easton snowpack” marker on map indicates location of sample site where Easton glacier snow was collected. Satellite image retrieved from Google Earth.
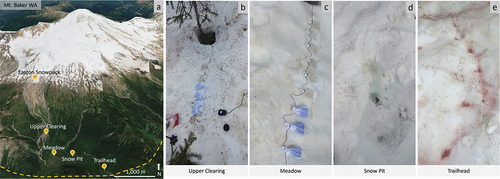
Table 1. Data table for snowpack sample sites.
Snow and meltwater samples were collected along an elevation gradient in 2018 (). On 6 June 2018, materials were collected from sites designated as “meadow” and “upper clearing.” The meadow sample site was collected in an open clearing with no surrounding trees; upper clearing was collected in a small clearing with trees interspaced. Both sample sites were collected midday, under partly cloudy skies with an air temperature of ~24°C. On 7 June 2018, “trailhead” was sampled in a small clearing surrounded by trees at midday. Skies were partly cloudy and ambient air temperatures during sampling was ~25°C. During this time, snow algae was only visible at lower elevations around the tree line (≤1,463 m.a.s.l.) and not on or near the tongue of Easton Glacier (48.73 N, 121.83 W, ~1,700 m.a.s.l.) Surface snowpack samples were collected from the Easton Glacier tongue; however, we were not able to extract sufficient DNA for microbial analysis; thus, these samples are not discussed further. All samples in this study were selected based on presence or absence of visible snow algae communities. Trailhead samples contained patches of red snow, the snow from the meadow site was white with limited debris and no visible snow algae, and upper clearing had patches of mixed (brown/red) snow.
All snow samples were collected with individually wrapped sterile spatulas or scopes. Snow for primary productivity assays was placed into nonvented and nontreated tissue culture flasks until snow filled the flask and melted down to ~20 mL per incubation. Snow for nucleic acid analyses was collected in sterile Whirl-Pak bags, melted at ambient temperatures, and passed through a 0.22-μm pore size Sterivex filter on site via 60-mL individually wrapped sterile syringes. Sterivex filters were then stored and shipped to the University of Tennessee, Knoxville (UTK) frozen at −20°C. Aliquots for cell enumeration were transferred into 50-mL polypropylene tubes and fixed with paraformaldehyde (4 percent final concentration) and stored at 4°C until filtered and enumerated.
In 2019, a single snow pit was dug at an elevation near to our 2018 trailhead sample (48.7039 N, 121.8156 W) for a vertical profile. The profile (Figure S1) was collected by first digging a pit to the ground surface with an ethanol cleaned shovel. The snow along the pit column was then scrapped away using sterile spatulas to ensure that any snow touched by the shovel was removed. Snow was then collected at depth using a new sterile scoop for each sample; this snow was then placed in sterile Whirl-Pak bags and shipped frozen (at −20°C). Snow samples for each depth were also collected in sterile Whirl-Pak bags, as described above, and melted for various biogeochemical analyses described below. Samples for cell enumeration were collected in the same manner as described for the 2018 samples. Sample selection throughout the snowpack was based on visible density (to the naked eye) of algae. Surface snowpack (0–2 cm depth) had visible red snow, whereas the mid snowpack (at ~27.9 cm depth) had visible dense green snow, and the base snowpack (at ~69.9 cm) was the snow directly overlaying the soil and contained no visible pigmentation.
Field based measurements
Light intensity was measured using a REED Instruments Light Meter SD-1128 (lux). Lux measurements were collected every 30s during primary productivity assays and converted to the average lux per hour at each site. The light meter was placed at the surface of snowpack next to where incubations were conducted. Measurements of lux are not equivalent to photosynthetic active radiation and as such we use these data to provide a comparison of the relative amount of incoming illumination at each site during sampling. Electrical conductivity measurements were collected on freshly melted samples in the field using the sympHony SP80PC meter with a sympHony conductivity probe. Colored dissolved organic matter (CDOM) and chlorophyll a (CHLa) were measured on melted samples using a Turner Trilogy Fluorometer with the CHLa in vivo module at 460 nm for CHLa. Relative fluorescence units of CHLa measurements were converted to micrograms per liter of CHLa using a CHLa standard with a standard curve (R2 = 0.994). CDOM was measured with the CDOM/FDOM module at 365 nm. Relative fluorescence units of CDOM were converted to micrograms per milliliter using IHSS Suwannee River Fulvic Acid Standard II (www.humic-substances.org; Averett et al. Citation1994) via standard curve (R2 = 0.939). Snow for chlorophyll measurements was collected via sterile scoops into acid washed amber Nalgene bottles, hiked back to camp, thawed at 4°C, and measured immediately after thawing (~6–8 hours after collection).
Cellular abundance
DNA-containing cells were counted by staining aliquots of 4 percent paraformaldehyde-fixed samples with the nuclear counterstain 4′,6-diamidino-2-pheynylindole dihydrochloride and then filtering onto 0.2-μm black polycarbonate filters for visualizing and quantifying with an epifluorescence microscopy using methods described in Mikucki and Priscu (Citation2007). Sample volumes used for each slide were optimized so each field of view would have between 30 and 300 cells. The same filters and slides from each site were used to count algal cells and bacteria cells. Algal cells were counted first using brightfield to differentiate green and red algal cells to avoid overexposing the algae to light when counting the bacteria cells. Algal cells that were red-pigmented under brightfield were counted as astaxanthin-containing cells; green-pigmented cells were counted as not producing the astaxanthin pigment. Bacteria were counted at 100X magnification, and algal cells were counted at 10X or 20X depending on the abundance per slide.
Snowpack primary productivity assays
Inorganic carbon uptake was measured via microcosm incubations by amending samples with 13C-labeled NaHCO3 using the method of Hamilton and Having (Citation2017). Briefly, 100 µM NaH13CO3 was incubated in 15-mL volumes of snowmelt in triplicate for ~60 minutes at ambient temperature and solar exposure. Controls at each site included triplicate incubations with no added substrate and labeled samples in culture flasks wrapped in electrical tape and placed inside white bags (dark controls). Incubation times varied; however, all were performed around midday. Data were normalized to incubation time by dividing carbon uptake by the total incubation time for each site. For example, Trailhead B incubations were terminated after 2 hours owing to logistical constraints, whereas other locales were incubated for ~1 hour. NaH13CO3 was prepared with 18.2 MΩ/cm deionized water and added to each microcosm via sterile pipetting. Experiments were terminated by filtering samples through precombusted (450°C for 4 hours) 0.2-µm glass fiber filters. Filters were then wrapped individually in precombusted aluminum foil (450°C for 4 hours) via flame-sterilized tweezers and stored and shipped frozen to UTK (−20°C) for processing.
At UTK, each filter was thawed, washed with HCl (1 M) to remove any residual NaH13CO3, briefly rinsed with 18.2 MΩ/cm deionized water, and dried at 60°C for three days. One quarter of each filter was then scraped into tin boats and sealed to be loaded and analyzed via a Costech Instruments elemental analyzer (EA) connected to a Thermo Scientific isotope ratio mass spectrometer (IR-MS) at the Stable Isotope Lab at UTK. Linearity corrections, standards, and calculations were made as described in Schuler, Havig, and Hamilton (Citation2017). Reported values of 13C uptake (carbon fixation rates) were calculated using the difference in absolute 13C/12C ratios between labeled incubations and nonamended controls. Results are presented in units relating to the mass of organic carbon in the material used for the incubations, accounting for the sample biomass added to the filter and scraped off for EA-IR-MS analysis. Results are reported as micrograms of carbon incorporated (μg C) per gram of carbon in the incubation material (g biomass C) per hour to provide a direct comparison to other carbon uptake in snow algae experiments. The amount of δ 13C for each incubation was compared to non–δ 13C amended samples to confirm uptake occurred. Both light-dependent (light treatment) and light-independent (dark treatment) uptake over time was assessed for each of the 2018 surface snow samples to determine primary productivity rates (PPRs; Figure S2). Results were interpreted statistically via Tukey’s honestly significant difference test.
Snowpack CO2 flux
CO2 flux measurements were collected using a portable force diffusion infrared CO2 flux detector (Eosense eosFD). At each site, the eosFD sensor was placed near the incubations and programmed to take a measurement every 5 minutes, with a minimum of four measurements per site. Results provided by the instrument are given in CO2 parts per million per meter squared per second. Flux measurements for each site were averaged and converted to μg micrograms carbon per meter per hour for comparison to carbon uptake microcosm experiments. Difference in flux data between sites was evaluated using a paired unequal variance t-test.
Nucleic acid extraction
Pliers were used to break open the back end of the Sterivex casing (non-Luer-Lok end), releasing the filter and filter holder. Filter and holder were then pulled out of the casing and the filter was cut at the edges using a flame-sterilized scalpel and then peeled away with flame-sterilized tweezers. Filters were cut with flame-sterilized scissors into small pieces and placed into bead beating tubes with flame-sterilized tweezers. DNA was extracted from 0.22-µm pore size Sterivex (2018 samples) or 47-mm (Pall Supor) filters (2019 samples) using Qiagen’s DNAeasy extraction kit per the manufacturer’s instructions with slight modifications. MP Bio bead-beating lysing matrix E tubes were substituted for those supplied with kit. Filters were divided into two extraction tubes. Our bead beating step included 45 seconds of beating at 6.6 m/s followed by 30 seconds of rest and 45 seconds at 6.6 m/s in a 10°C cold room using an MBio fastprep24 bead beater. RNA was extracted from the 2019 snow pit samples for transcriptomics using TriZol according to the manufacturer’s protocols with an additional bead-beating step (6.5 m/s for 45 seconds followed by 30 seconds of rest and then another 45 seconds at 6.5 m/s). All sample processing was performed in a class 100 biological safety cabinet.
Microbial diversity assessment
Amplicon sequencing that targeted the V4 region of the 16S rRNA gene (515 F: GTGCCAGCMGCCGCGGTAA; 806 R: GGACTACHVGGGTWTCTAAT) and the V9 region of the 18S rRNA gene (1380 F: CCCTGCCHTTTGTACACAC; 1510 R: CCTTCYGCAGGTTCACCTAC) was performed by Novogene Corporation Inc. on DNA extracts using NovaSeq 6000, resulting in PE250 bp amplicon data. Amplicon sequence variants (ASVs) for both 16S and 18S data (Callahan, McMurdie, and Holmes Citation2017) were generated using the DADA2 pipeline v1.16 (Callahan et al. Citation2016) following default parameters. Taxonomy was classified using the SILVA reference database v138 (Quast et al. Citation2012). Statistical and Shannon diversity analyses were performed using phyloseq v1.22.3, via “plot_richness” command (McMurdie and Holmes Citation2013), and figures were made with GGPlot2 v3.3.2 (Wickham Citation2016) using R (v4.0.3; R Core Team Citation2021). The top ten fungal ASVs, designated as “NA_Fungi” (Table S1) and “Uncultured Chloromonas” (Table S2) by the DADA2 pipeline from each sample site, were identified using Basic Local Alignment Search Tool (BLAST; Altschul et al. Citation1990).
RNA libraries were constructed following Oxford Nanopore Direct cDNA Native Barcoding Protocol (SQK-DCS109 with EXP-NBD104 and EXP-NBD114; Version DCB_9091_v109_revF_04Feb209) using kit SQK-DCS109 and were sequenced on Oxford nanopore MinIon using Flowcell FAL0048. The RNA library was not polyadenylated in an attempt to sequence only eukaryotic RNA, and rRNA was not depleted from the libraries before sequencing. Postprocessing was completed via Guppy (v3.4.4; Wick, Judd, and Holt Citation2019) with rRNA sequences removed by SortmeRNA (v2.1; Kopylova, Noé, and Touzet Citation2012). Metatranscriptomic data from surface and mid snowpack samples were compared by normalizing the data sets via transcripts (annotated genes) per 1 million genes (transcript/total transcripts × 1,000,000), as well as comparing relative abundance of transcripts utilizing SEED Subsystem categories (Overbeek et al. Citation2014), following the SAMSA2 pipeline (Westreich, Treiber, and Mills et al. Citation2018). All sequences were also annotated using Diamond (Buchfink, Xie, and Huson Citation2015) against the National Center for Biotechnology Information’s (NCBI) nonredundant database (Pruitt, Tatusova, and Maglott Citation2007).
Results
In situ snowpack measurements
Lux varied by an order of magnitude on sampling days, whereas electrical conductivity of melted snow varied little between sites. Measurements of lux ranged from 2.4 × 10⁴ (meadow) to 2.5 × 10⁵ (trailhead and upper clearing) average lux/hr () during sampling in 2018. In 2019, the average lux was 2.5 × 10⁴ lux/hr at the surface where the snow pit was established (). Conductivity ranged from 2.32 to 7.14 μS/cm across 2018 surface sites. In 2018, CDOM ranged from 1.2 × 101 (meadow) to 1.9 × 10³ (upper clearing) CDOM µg/mL, with trailhead at 2.1 × 101 CDOM µg/mL. CDOM was not collected for the 2019 snowpack samples. CHLa varied across all sites, from as low as 5.2 CHLa µg/mL at base snowpack to 30 CHLa µg/mL at meadow site, with the highest value of 2.0 × 10³ CHLa µg/mL at upper clearing. CHLa concentrations were noticeably lower in sites where astaxanthin-pigmented algae (red-pigmented algae samples) were more abundant than non-astaxanthin-pigmented algae (algae that were green), such as trailhead (3.2 × 101 CHLa µg/mL) and surface snowpack (2.5 × 101 CHLa µg/mL) versus upper clearing (1.9 × 10³ CHLa µg/mL) and mid snowpack (1.2 × 10³ CHLa µg/mL).
Direct counts of algal and bacterial cells
Green- and red-pigmented algal cells were observed microscopically in all sample sites (). In 2018, total algal cells ranged from to 9.7 × 10⁴ cells/mL (at trailhead) to 6.4 × 10² cells/mL (at meadow), with upper clearing having 4.2 × 10⁴ cells/mL. Each of these sites had more non-astaxanthin-containing algae (green cells) than astaxanthin-pigmented algae (red cells), with an average ratio of red- to green-pigmented algae of 0.260. Bacterial cell counts (cell counts excluding algae) for these sites also varied; upper clearing had the highest number of cells at 3.9 × 10⁶ cells/mL, followed by trailhead at 2.5 × 10⁶ cells/mL, and meadow had the lowest at 2.0 × 10⁵ cells/mL. Microscopic observations of the 2019 snowpack samples showed more green-pigmented algal cells than cells that produced astaxanthin (red) at ~30 cm depth (mid snowpack), with the inverse true for the surface snowpack sample. Mid snowpack had 3.9 × 10⁴ green-pigmented algal cells/mL and 3.3 × 10² astaxanthin-pigmented (red) algal cells/mL with a ratio of red to green of 0.008. Conversely, the surface snowpack had more red-pigmented cells than green algal cells (1.4 × 10⁴ red algal cell/mL and 7.9 × 10³ green cells/mL with a ratio of red to green of 1.7). The base snowpack had 1.0 × 10³ green-pigmented algal cells/mL and 5 astaxanthin-pigmented algal cells/mL. Total algal counts thus ranged from 3.8 × 10⁴ algal cells/mL (mid snowpack) to 1.1 × 10³ algal cells/mL (base snowpack), with our surface site having 2.1 × 10⁴ algal cells/mL. Bacterial counts were only conducted for surface snowpack (1.4 × 10⁴ cells/mL) and mid snowpack (1.1 × 10⁵ cells/mL).
Snowpack primary productivity rate and CO2 flux
Trailhead had the highest percent C (15.55 percent) and percent N (1.28 percent), with the lowest C:N ratio (13.64) out of the three surface samples from 2018 (). Upper clearing had the second highest percent C (4.98 percent) and N (0.28 percent), with a C:N of 17.56. Meadow had the lowest percent C (3.98 percent) and N (0.14 percent), with the highest C:N ratio (28.56). The natural abundance of δ13C was −28.4 per mil for trailhead, for upper clearing it was −28.38 per mil, and for meadow it was −27.64 per mil. δ15N ranged from −4.89 per mil (trailhead) to −5.59 per mil (upper clearing) and −6.57 per mil at meadow.
Primary productivity rates were measurable at each of the 2018 sites (Figure S2); however, statistical significance was only found between light versus dark treatments in both trailhead site A (p = 5.5 × 10⁻⁵) and trailhead site B (p = 2.6 × 10⁻⁵). No significance was found between meadow (dark versus light treatments) or upper clearing (dark versus light treatments). Trailhead B had the highest PPR (89.5 ± 8.4 μg C uptake/g biomass C/hr), followed by trailhead A (81.3 ± 10.05 μg C uptake/g biomass C/hr), upper clearing (32.4 ± 21.4 μg C uptake/g biomass C/hr), and meadow (5.9 ± 2.8 μg C uptake/g biomass C/hr). Furthermore, trailhead sites were both significantly different from meadow (light treatment at trailhead A, p = 1.2 × 10⁻⁴; trailhead B, p = 2.78 × 10⁻⁵) as well as from upper clearing (light treatment at trailhead A, p = .017; light treatment at trailhead B, p = .003). No statistically significant differences were observed between any of the dark treatments across sites.
CO2 flux followed a similar trend as PPR (Figure S3) in that the sites with visibly pigmented algae and higher PPR had negative CO2 flux. Upper clearing and trailhead had negative flux indicating drawdown of CO2 into the snowpack (−3.57 × 10⁻³ ± 2.89 × 10⁻³ μg/C/hr and −1.82 × 10⁻³ ± 1.06 × 10⁻³ μg/C/hr, respectively). Meadow, which had the lowest measured PPR rates, had a positive CO2 flux of 9.86 × 10⁻³ ± 2.84 × 10⁻³ μg/C/hr. Statistically significant difference were found between trailhead and meadow (p = .019) and upper clearing and meadow (p = .031).
Snowpack microbial community composition
Quality filtering for clean reads of 16S rRNA genes (16S) resulted in an average of 138,620 merged, nonchimeric 16S sequences per sample and a total of 2,302 unique 16S ASVs across all samples (106 meadow, 124 trailhead, 917 upper clearing, 154 surface snowpack, 747 mid snowpack, 89 base snowpack). Quality filtering for 18S rRNA genes (18S) averaged 80,679 merged, nonchimeric 18S sequences per sample and resulted in a total of 1,251 unique 18S ASVs across all samples (111 meadow, 174 trailhead, 236 upper clearing, 192 surface snowpack, 261 mid snowpack, 277 base snowpack).
Dominant ASVs varied across our samples, with Chitinophagaceae, Comamonadaceae, Sphingobacter-iaceae, and Oxalobacteraceae as the most abundant bacteria families. The most abundant 16S ASV in our data set belonged to the Chitinophagaceae family (16S-ASV1) and comprised 3.58 percent of meadow, 52.4 percent of trailhead, 48.7 percent of upper clearing, 31.0 percent of surface snowpack, 11.1 percent of mid snowpack, and 2.02 percent of base snowpack ASVs (). 16S-ASV1 was unclassified at the genus level by the DADA2 workflow and was further identified via BLAST as an uncultured bacterium from glacial systems associated with ice worms (99.2 percent sequence identity; Murakmi et al. Citation2015). The majority of ASVs from the Sphingobacteriaceae family belonged to the Solitalea genus. In the meadow sample, Solitalea comprised 93.1 percent of all ASVs and 99.7 percent of the Sphingobacteriaceae ASVs. Furthermore, Solitalea comprised 6.06 percent of all ASVs and 73.4 percent of Sphingobacteriaceae at the trailhead site and 10.4 percent of all ASVs and 98.6 percent of Sphingobacteriaceae ASVs at the upper clearing site. This trend was also observed in the 2019 snow pit samples, with 23.9 percent of all ASVs and 99.8 percent of Sphingobacteriaceae ASVs in the surface snowpack and 15.6 percent of all ASVs and 94.3 percent of Sphingobacteriaceae ASVs in mid snowpack samples. The base sample was the only exception, where only 0.03 percent of all base snowpack ASVs and 0.30 percent of the Sphingobacteriaceae ASVs were Solitalea. For the base sample, rather than Solitalea being the most abundant Sphingobacteriaceae ASV, Mucilaginibacter sp. was the most abundant (48.4 percent of Sphingobacteriaceae base snowpack ASVs and 7.01 percent of all base snowpack ASVs). ASVs from the Oxalobacteraceae family were the most abundant ASV in the mid snowpack site and were dominated by a single ASV (16S-ASV6, which was 86.2 percent of Oxalobacteraceae ASVs in the mid snowpack). This sequence was unclassified at the genus level by the DADA2 workflow and identified via BLAST as a Massilia sp. (100 percent sequence identity) originally sequenced from leaf colonization and cold-adapted arctic bacteria studies (Assession No. MN989074). The Rhodanobacteraceae family ASV (16S-ASV5) that dominated the base snowpack (29.8 percent of all base snowpack ASVs) was identified as belonging to the Rhodanobacter genus by the DADA2 workflow. No Archaeal sequences were detected by our workflow.
Figure 2. Relative abundance bar plot of family-level 16S rRNA gene community composition for snow samples from Mount Baker. Community structures varied across sample sites. Surface sites that had visible red patches of snow included upper clearing, trailhead, and surface snowpack. Whereas meadow had no visible algae on the surface snowpack, mid snowpack was observed to have mostly green-pigmented algae, and base snowpack had low abundances of algae that were also mostly green pigmented.
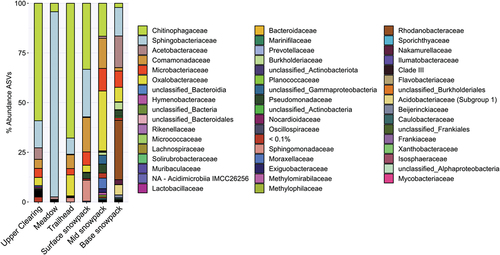
Sites with higher abundances of algae sequences compared to fungi had similar bacterial communities and were distinct from sites that had higher abundance of fungi, with the exception of the mid snowpack (). Chitinophagaceae and Comamonadaceae were more abundant in sites where algae made up the majority of 18S ASVs (upper clearing, surface snowpack, and mid snowpack), whereas Sphingobacteriaceae were more abundant in the sites in which fungi ASVs made up the majority of 18S ASVs (meadow, trailhead). In mid snowpack, Oxalobacteraceae was the most abundant family (23.8 percent of all ASVs), and in the base snowpack, Rhodanobacteraceae was the most abundant (29.8 percent of all ASVs; ).
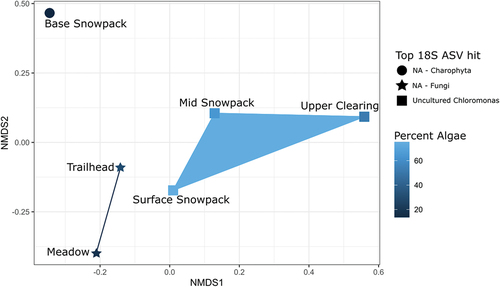
Figure 3. Nonmetric multidimensional scaling plot using Bray-Curtis dissimilarity matrix on 16S rRNA gene community composition of snow samples from Mount Baker. The dissimilarity between 16S rRNA gene community composition with the relative percent of algae from the 18S rRNA gene community composition as a variable, dark blue (low percentage algae) to light blue (high percentage algae). Each sample site shape represents the most abundant 18S rRNA gene ASV within the respective sample. Sites with a higher percentage of algae ASVs relative to fungi ASVs group together (mid snowpack, surface snowpack, and upper clearing), whereas sites with a lower percentage of algae ASVs relative to a higher percentage of fungi ASVs group together (meadow and trailhead). The base snowpack site was an outlier due to the top ASV being classified as a Charophyta, which was associated with the honeysuckle plant.
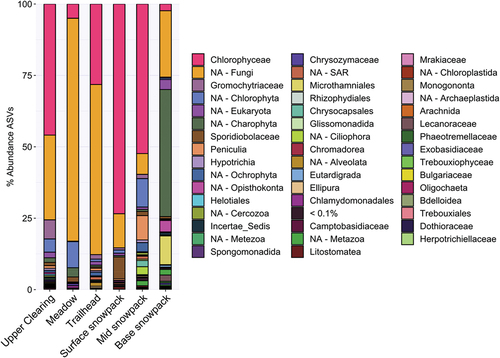
Eukaryotic community composition was similar across all sites (); however, relative abundance of algae and fungal ASVs varied. Chloromonas were the most abundant 18S ASVs in upper clearing (43.8 percent), surface snowpack (71.6 percent), and mid snowpack sites (48.0 percent), whereas meadow and trailhead sites were dominated by a group of fungi that could not be assigned by the DADA2 workflow (NA-fungi). NA-fungi comprised 78.1 percent of meadow fungal groups and 59.6 percent in trailhead fungal groups. The majority of base snowpack ASVs belonged to NA-Charophyta (44.9 percent). Further characterization of these “NA” sequences using BLAST identified the top “NA-fungi” ASV from the trailhead site (18S-ASV4) as sharing sequence identity (95.9 percent) with a Paranamyces uniporus, originally isolated from nonsaline mud/soil (Letcher, Powell, and Davis Citation2015; Simmons et al. Citation2020). The top “NA-fungi” (18S-ASV6) from the meadow site shared sequence identity (97.7 percent) with an uncultured Basidiomycete, originally sequenced from indoor building mold (Pitkaranta et al. Citation2008). The “NA-Charophyta” ASVs were identified as Charophyta but were not assigned at any higher taxonomic level. The top ASV from this group (18S-ASV5) shared sequence identity (99.4 percent) with Symphoricarpos occidentalis of the honeysuckle plant family (NCBI nonredundant database, GenBank: MT610964.1; ). There was no overlap between 18S ASVs across samples; that is, each site had a unique set of ASVs.
Figure 4. Relative abundance bar plot of family-level 18S rRNA gene community composition for snow samples from Mount Baker. 18S rRNA gene community composition across sample sites was similar, with Chlorophyceae and fungi identified as the dominant members. Base snowpack variation was due to the high abundance of Charophyta. Chloromonas was the most abundant genus of the Chlorophyceae family at each site. “NA” categories are ASVs that the DADA2 workflow using the SILVA database could not classify and were grouped together at the lowest taxonomic rank provided by our workflow. Table S1 provides top two BLAST hits for the top ten fungal ASVs classified here as “NA-fungi” for each sample site. Table S2 provides the top two BLAST hits for the top ten Chloromonas ASVs for each sample site.
Alpha diversity of 16S ASVs between sites identified meadow as the least diverse site (1.03), followed by trailhead (2.13), surface snowpack (2.21), and upper clearing (2.84). Mid snowpack (3.62) and base snowpack (4.02) were the most diverse sites. Bacterial differences between samples were driven by three ASVs, an uncultured Chitinophagaceae genus (16S-ASV1), Solitalea (16S-ASV2), and Rhodanobacter (16S-ASV5) (Figure S4). Analyses with nonmetric multidimensional scaling (Bray-Curtis dissimilarity) indicated that meadow and base snowpack were the most dissimilar across sites; upper clearing and trailhead cluster together while surface and mid snowpack cluster. Alpha diversity of 18S ASVs followed a trend similar to 16S diversity. Trailhead was the least diverse site (3.68), followed by meadow (3.72) and surface snowpack (3.82), whereas base snowpack (4.31), mid snowpack (4.43), and upper clearing (4.48) were the most diverse of the sites. There was no overlap in 18S ASVs from site to site; thus, redundancy analyses (RDA) resulted in the most abundant 18S ASV from each site, driving the observed differences between sites. However, nonmetric multidimensional scaling (Bray-Curtis dissimilarity) resulted in snowpack samples (surface, mid and base) being most different from each other and upper clearing, meadow and trailhead clustering together.
Snowpack metatranscriptomics
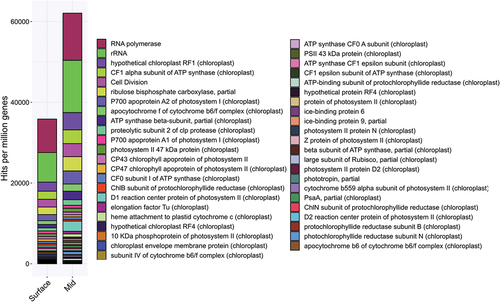
Active communities within the snowpack were assessed utilizing long read metatranscriptomics on samples from the surface and ~30 cm below the surface (mid) of a snow pit (Figure S1). Sequencing resulted in 600,119,229 bases in 889,046 clean sequences for surface snowpack and 493,649,225 bases in 889,046 clean sequences for mid snowpack. Because we were limited to a single sample from each depth, data were normalized by transcripts (annotated genes) per 1 million genes (transcript/total transcripts × 1,000,000); we avoid making statistical conclusions given our limited sample size. Transcripts for photosynthesis and respiration were observed in both snow pit samples, with a greater number of transcripts associated with photophosphorylation (133,174 versus 44,496 annotated genes/million transcripts), CO2 fixation (21,349 versus 8,322 annotated genes/million transcripts), and respiration (20,416 versus 11,140 annotated genes/million transcripts) in the sample at ~30 cm depth (mid snowpack; Figure S5). Transcripts specifically associated with Chloromonas were also more abundant in our mid snowpack sample (62,103 total annotated Chloromonas genes/million transcripts) compared to surface snow (35,859 total annotated Chloromonas genes/million transcripts). Furthermore, we observed more ribosomal gene transcripts in the mid snowpack compared to the surface snowpack (12,996 annotated ribosomal genes/million transcripts and 7,337 annotated ribosomal genes/million transcripts respectively; ).
Figure 5. Chloromonas sp. transcripts from surface and mid snowpack samples on Mount Baker. Transcripts were run against the NCBI nonredundant database. Hits were sorted to Chloromonas sp. transcripts with >40 percent similarity to the annotation shown. Number of hits was normalized to account for difference in library size of each sample by dividing transcripts hits of interest by total genes transcribed in the library, multiplied by 1 million (hits per million genes). Mid snowpack had 62,103 hits per million genes for Chloromonas sp., whereas the surface had 26,244 hits per million genes less, with a total of 35,859 hits per million genes; 1,998 of the total hits per million genes from the surface belong to cytochrome b6f complex transcripts, typically associated with respiration, compared to 3,561 hits per million genes of the mid sample. The other photosynthesis transcripts resulted in 16,302 hits per million genes in the surface sample compared to 30,662 hits per million genes from the mid sample.
Conversely, a higher abundance of transcripts associated with stress responses was detected in the surface snowpack compared to mid snowpack, including oxidative stress (14,303 versus 7,067 annotated genes/million transcripts respectively) and osmotic stress (3,054 versus 2,281 annotated genes/million transcripts respectively; Figures S6 and S7). Transcripts associated with oxidative stress included phytochrome, two-component sensor histidine kinase, manganese superoxide dismutase, organic hydroperoxide resistance protein, gamma-glutamyl transpeptidase, as well as several other transcripts. Transcripts associated with osmotic stress included outer membrane protein A precursor, cyclic beta-1,2-glucan synthase, choline dehydrogenase, and other transcripts at low abundances. Also of note, the complete pathway for astaxanthin production was expressed in the surface snowpack data set, whereas only the transcripts for the synthesis of phytoene to lycopene were detected at depth (mid snowpack). Transcripts associated with antibiotic resistance genes including multidrug efflux pumps, cobalt-zinc-cadmium resistance, acriflavine resistance, arsenic resistance, and beta-lactamase, as well as others at low abundance, were also present at both depths, though they were more prevalent in the surface sample (25,581 annotated genes/million transcripts) compared to the mid snowpack (8,792 annotated genes/million transcripts; Figure S8).
Discussion
Microbial ecology of Mount Baker snowpack samples
Mount Baker alpine snowpack contains visibly red patches of snow formed by abundant Chloromonas algal cells. This finding as well as the observed bacterial diversity associated with our pigmented snow samples is consistent with previous studies of other Pacific Northwest patches of red- and orange-pigmented snowpack (Hamilton and Havig Citation2017, Citation2020; Havig and Hamilton Citation2019; Yakimovich, Engstrom, and Quarmby Citation2020). However, the dominant algae in other snow-covered environments have also been described as Sanguina and Chlainomonas (Davey et al. Citation2019; Soto et al. Citation2020; Ji et al. Citation2022). Our mid snowpack sample, which was collected at ~30 cm below an observed red snow patch, contained the most non-astaxanthin-containing (green-pigmented) algal cells. The bacterial community associated with these algae cells detected at depth was distinct from other reports in that the most abundant ASVs belonged to Oxalobacteraceae (30 percent relative abundance). Other studies have found Flavobacteriaceae, Sphingobacteriaceae, and Sphingomonadaceae to be the most abundant bacterial taxa associated with snow algal blooms (Davey et al. Citation2019; Krug et al. Citation2020).
Some Oxalobacteraceae have been shown to produce auxin, a plant growth–promoting hormone, that has also been shown to promote growth in algae (Lin et al., Citation2022). A recent study by Krug et al. (Citation2020) demonstrated that auxin-producing bacteria increased biomass of Chloromonas in microcosms. Thus, the Oxalobacteraceae may support growth of Chloromonas while in their non-astaxanthin-pigmented stage; however, investigating bacteria transcripts for auxin production was not possible because our RNA-cDNA libraries were not polyadenylated. Auxin-promoting transcripts produced by algae were not detected in our samples. The high abundance of Sphingobacteriaceae and Chitinophagaceae in our surface snow samples suggests a potential relationship with the red-pigmented algae and fungi in which the bacteria may degrade high-molecular-weight compounds produced by the algae (Gómez‐Pereira et al. Citation2012; Fernández-Gómez et al., Citation2013; Krug et al. Citation2020; Zhu et al. Citation2020) and chitin produced by the fungi (Abo Elsoud and El Kady Citation2019; Rosenberg Citation2014). Chloromonas and Basidiomycete fungi have been widely identified in association with snow algae communities across the globe (Brown and Jumpponen Citation2019; Hoham and Remias Citation2020).
Our results add evidence to the proposed snow algae life cycle in that we observed Chloromonas as the primary 18S ASVs in both the surface (majority red-pigmented algae) and at the mid snowpack (majority green-pigmented algae; Kawecka Citation1981, Citation1986; Hoham and Duval Citation2001; Jones et al. Citation2001; Hoham et al. Citation2006). Furthermore, we observed a change in alpha diversity and the 16S rRNA and 18s rRNA community composition throughout the same snowpack. The bottom or base sample had low algal cell abundances yet was the most diverse among the snow pit vertical profile samples (4.02, 16S rRNA Shannon index), whereas our mid sample had high algal cell abundances, of which the majority were non-astaxanthin-producing, and was less diverse (3.62, 16S rRNA Shannon index) compared to the base snowpack. Whereas in the surface sample, the majority of algal cells were astaxanthin pigmented and it was the least diverse sample among the snow pit vertical profile collections (2.21, 16S rRNA Shannon index). This suggests that the life cycle of snow algae may play a role in shaping the bacterial community.
Snowpack metabolic activity and carbon flux
Productivity associated with snow algal communities is of interest due to the abundance of snow algal communities across snow and glacier systems (Ganey et al. Citation2017). Previous studies of snow algal metabolic activity suggested that the algae play an important role in biogeochemical processes (Hodson et al. Citation2017; Lutz et al. Citation2017). The productivity of these microbial communities affects the carbon budget by either sequestering carbon via photosynthesis or releasing carbon via respiration; their acquisition of growth factors can further influence glacier nutrient budgets. Understanding the carbon budget of these systems on global and local scales is becoming increasingly important as alpine glaciers and snowpack are rapidly receding (Williams, Gorton, and Vogelmann Citation2003; Wilson, Nolin, and Bladon Citation2021).
The Mount Baker snowpack contained diverse, active microbial communities both on the snowpack surface and at depth as measured by stable isotope incorporation assays and transcriptomics. Primary production in Mount Baker samples showed similar carbon uptake compared to other snowpack primary production studies in the Pacific Northwest (Hamilton and Havig Citation2017, Citation2020; Havig and Hamilton Citation2019). Our data further support active microbially mediated carbon cycling based on observed CO2 flux measurements, which followed the same trend as our PPR measurements. The recovery of rRNA belonging to snow algae at the snow–air interface and at 30 cm depth within the snowpack, along with the expression of transcripts necessary for photosynthesis and respiration, further supports the hypothesis of an active photosynthesizing community at multiple depths within the snowpack.
The trailhead site had similar PPR to other studies that measured the activity of dense snow algae blooms, although our trailhead sample had a higher average PPR. Samples from meadow were similar to other snow sites with little to no visible algal blooms. Our upper clearing site was most similar to mixed snow samples described by Hamilton and Havig (Citation2017). The higher PPR measured at trailhead compared to other reported rates for pigmented alpine snowpack studies could be explained by differences in elevation and available nutrients. Hamilton and Havig (Citation2017); Hamilton and Havig (Citation2020) collected snow from higher elevations (>2,000 m.a.s.l.), whereas our study was within the tree line where there was less light irradiance and nutrients can accumulate and support metabolic activity. Observed C:N ratios were similar to other snow algae sites in the Arctic (Spijkerman et al. Citation2012; Lutz, Anesio, Field, and Benning Citation2015; Lutz et al. Citation2016) and alpine mountains (Hamilton and Having Citation2017). Furthermore, a single sample collected above the tree line on Easton Glacier in 2018 contained 2.53 µg/mL CDOM, which was 10 to 1,000 times less the CDOM observed at the 2018 surface sites, suggesting more organic matter accumulation at lower elevations that may support metabolic activity.
CO2 drawdown was greater at sites with higher PPR; however, trailhead and upper clearing sites drew down less CO2 into the snowpack than meadow released. Meadow, which had low activity rates (5.9 ± 2.8 μg C uptake/g biomass C/hr) and no visible red patches, was the only site where positive CO2 flux from the snowpack was measured (9.86 × 10⁻³ ± 2.84 × 10⁻³ μg/C/hr). This could be due to a higher abundance of heterotrophic bacteria in relation to the algae within this sample site compared to our other sites. Trailhead, which had the highest PPR and the second lowest CO2 drawdown (−1.82 × 10⁻³ ± 1.06 × 10⁻³ μg/C/hr), received an order of magnitude less light (2.4 × 10⁴ lux) than the other sites during our PPR incubations. This difference in light could be explained by the sample location with nearby trees creating shadows. Trailhead was located between a small opening of dense trees, which likely limited the amount of light able to penetrate to the snow surface. Lower light intensities may be beneficial for snow algae activity, because light has previously been discussed as a major factor in the life cycle and activity of snow algae (Remias, Lütz-Meindl, and Lütz Citation2005). Collectively, our PPR data suggest that even patches of snow without visible pigments (such as the meadow site) contain active snow algae. Still, these communities may be contributing to carbon sequestration. Tools with higher resolution than the naked eye, such as field mobile spectral radiometers, can better inform site selection for algal assessment studies. Though a broader study (both temporally and spatially) would better inform the net rates of activity in Mount Baker snowpack, the range of patches we sampled suggests that carbon fixation is slower than CO2 release from the snowpack. However, surface surveys do not necessarily account for the potential productivity at depth within the snow.
The life cycle of snow algae is complex, with stages occurring throughout the snowpack, rather than just at the surface. This presents challenges for an accurate assessment of snowpack carbon budgets. Our limited study shows a range of primary productivity rates and CO2 fluxes with variations depending on whether the snow contains visible pigmented algae. Specifically, we detected transcripts and rRNA that belong to snow algae at the snow–air interface and at depth within the snowpack. Previous work has suggested that algae communities are found from the surface to within 10- to 25-cm snow depth (Fogg Citation1967; Gorton and Vogelmann Citation2003). These studies found that light irradiance was also a factor that influenced the vertical position of the algae within the snowpack; that is, high irradiances may cause snow algae to migrate 10 to 15 cm deeper within the snowpack (Grinde Citation1983) to a depth where the algae are protected from light saturation (Stibal et al. Citation2007). Thomas (Citation1972) performed a transplant experiment in which activity was measured on a surface algae bloom placed 50 cm below the surface. However, activity was not observed naturally in situ or in samples collected at depth. In our study, we found that photosynthesis and respiration were occurring 30 cm beneath the snow air interface. We also observed a higher chlorophyll concentration in the mid snowpack compared to the surface sample; however, disparities in chlorophyll concentrations between samples could be due to astaxanthin pigment masking the chlorophyll during analysis (Lang Citation1968; Bidigare et al. Citation1993; Hoham and Remias Citation2020) or the breakdown of chlorophyll to pheophytin by UV (Edwards et al. Citation2004). These data, along with microscopic observations and rRNA sequences within the snowpack, indicate that algal communities are actively transforming carbon at tens of centimeters below the surface and suggest that snow algae can be active during multiple life stages within the snowpack at the same time, including both the red aplanospore stage and the green flagellated stage.
Surface snow microbial communities are exposed to many stressors, such as high light irradiances and UV (Leya et al. Citation2013). Additional stressors for snow algal communities can include osmotic stress (Holzinger, Allen, and Deheyn Citation2016) and interactions with other microorganism (Bergk et al. Citation2019), such as exposure to antibiotics expressed in active communities as mediators of competition (Cornforth and Foster Citation2013). We observed relatively higher levels of stress and antibiotic response transcripts in the surface snowpack metatranscriptome compared to that of the mid snowpack. Additionally, the full pathway for astaxanthin production was only observed in the surface snowpack data. Reduction of photosynthesis at the snow surface due to astaxanthin production (Zhang et al. Citation2017) may be occurring. Both UV and visible light decrease exponentially with depth (Thomas and Duval Citation1995; Gorton and Vogelmann Citation2003); however, we observed more transcripts for genes involved in CO2 fixation and photosynthesis in the mid snowpack samples relative to the surface. This finding suggests that photosynthesizing at depth within the snowpack, where cells are protected from the most intense UV, could be more advantageous for algae even if less light is available. In addition to the higher abundance of transcripts belonging to the Chloromonas genus, direct counts of algal cells were more abundant in the mid snowpack site. Though additional replication would be required to statistically conclude that the mid snowpack was more photosynthetically active than the surface, our data suggest that, at a minimum, there is activity at depth in snowpack.
It has been hypothesized that snow algae play an important role in the global carbon budget (Williams, Gorton, and Vogelmann Citation2003); however, recent research does not include seasonal or depth measurements of snow algae activity, which, may miss a large portion of snowpack carbon fixation and respiration. As evidence, we observed activity at depth within the snowpack and on the snow surface where no visible algae blooms were occurring (meadow site). Previous remote sensing studies of snow algal blooms focused on albedo and algae biogeography (Takeuchi et al. Citation2006; Hisakawa et al. Citation2015; Ganey et al. Citation2017; Huovinin et al. Citation2018) and may have missed activity occurring at depth or within nonpigmented surface snow patches. Thus, future work to determine whether airborne, or even surface, spectral radiometers can detect snow algae within snowpack should be performed. Further research in quantifying primary production and gene transcript differences within snowpack and across varying levels of blooms will inform how the snow algae life cycle contributes to the snowpack carbon budget and nutrient cycling.
Conclusion
Understanding changes to the biodiversity and metabolic activity of snowpack systems is paramount in a warming world; however, studies that survey alpine snowpacks remain limited (Stibal et al. Citation2020). Here we present a first survey of the microbial (prokaryotic and eukaryotic) diversity associated with snowpack on Mount Baker. We found higher primary production rates and increased CO2 drawdown associated with sample sites that contained a higher proportion of algal cells; however, even snow that appeared white to the naked eye had low abundance of snow algae and low, but measurable, rates of productivity. We further observed multiple life cycles of the snow algae, classified as Chloromonas, throughout a vertical snowpack profile. Red-pigmented, astaxanthin-producing snow algae dominated the surface of the snowpack, whereas dense, green-pigmented algae dominated the snow at ~30 cm beneath the surface, and few algal cells were detected at the base of the snowpack, ~70 cm beneath the surface at the snow–soil interface. The middle of the snowpack had a higher algal cell abundance than the surface, as well as higher expression of genes for photosynthesis, including CO2 fixation and respiration. Our study suggests that snowpack has the potential to be a larger carbon sink than previously described, specifically at depth within the snowpack. We further observed shifts in microbial community composition in samples associated with different snow algae life cycle stages and whether algae or fungi were the most abundant eukaryotic organisms within the samples.
Seasonal studies of snowpack microbial communities may inform snow algal life cycle dynamics, which currently has unknown impacts on snow ecology and the carbon budget. Current tools for tracking snow algae (i.e., remote sensing) should take the seasonality of the algae life cycle into account and address activity at depth. In addition, many factors contribute to snowpack carbon dynamics and influence the activity of microbes that mediate these transformations, including sunlight, nutrients, snow depth, and microbial interactions. Further work should be conducted to elucidate how cryptic photosynthesis in snowpack impacts local ecosystems, the snowpack microbiome, and global carbon budgets.
Supplemental Material
Download Zip (12.7 MB)Acknowledgments
We are grateful to Abigail Jarratt, Justin Burnett, Oliva Husted, Nick Wogan, Keith Magness, David Shean, and the Northwest Glacier Cruisers snowmobile club for their assistance in the field. We also thank Jake Shaffer for laboratory assistance and Anthony Faiia at the UTK stable isotopes lab for assistance in running the EA IR-MS. Additional support was provided by the UW APL shipping department and Dale Winebrenner.
Disclosure statement
No potential conflict of interest was reported by the authors.
Supplementary material
Supplemental data for this article can be accessed online at https://doi.org/10.1080/15230430.2023.2233785.
Additional information
Funding
References
- Abatzoglou, J. T., D. E. Rupp, and P. W. Mote. 2014. Seasonal climate variability and change in the Pacific Northwest of the United States. Journal of Climate 27, no. 5: 2125–17. doi:10.1175/JCLI-D-13-00218.1.
- Abo Elsoud, M. M., and E. M. El Kady. 2019. Current trends in fungal biosynthesis of chitin and chitosan. Bulletin of the National Research Centre 43, no. 1: 1–12. doi:10.1186/s42269-019-0105-y.
- Altschul, S. F., W. Gish, W. Miller, E. W. Myers, and D. J. Lipman. 1990. Basic local alignment search tool. Journal of Molecular Biology 215, no. 3: 403–10. doi:10.1016/S0022-2836(05)80360-2.
- Averett, R. C., J. A. Leenheer, D. M. McKnight, and K. A. Thorn. 1994. Humic substances in the Suwannee River, Georgia: Interactions, properties, and proposed structures ( No. 2373). US Government Printing Office. doi:10.3133/wsp2373.
- Badania, P. 1986. Ecology of snow algae 2. General Characteristics of Snow Algae 3: 407–15.
- Bergk Pinto, B., L. Maccario, A. Dommergue, T. M. Vogel, and C. Larose. 2019. Do organic substrates drive microbial community interactions in Arctic snow? Frontiers in Microbiology 10: 2492. doi:10.3389/fmicb.2019.02492.
- Bidigare, R. R., M. E. Ondrusek, M. C. Kennicutt, R. Iturriaga, H. R. Harvey, R. W. Hoham, and S. A. Macko. 1993. Evidence a photoprotective for secondary carotenoids of snow algae. Journal of Phycology 29, no. 4: 427–34. doi:10.1111/j.1529-8817.1993.tb00143.x.
- Brown, S. P., and A. Jumpponen. 2019. Microbial ecology of snow reveals taxa-specific biogeographical structure. Microbial Ecology 77, no. 4: 946–58. doi:10.1007/s00248-019-01357-z.
- Brown, S. P., B. J. Olson, and A. Jumpponen. 2015. Fungi and algae co-occur in snow: An issue of shared habitat or algal facilitation of heterotrophs? Arctic, Antarctic, and Alpine Research 47, no. 4: 729–49. doi:10.1657/AAAR0014-071.
- Buchfink, B., C. Xie, and D. H. Huson. 2015. Fast and sensitive protein alignment using DIAMOND. Nature Methods 12, no. 1: 59–60. doi:10.1038/nmeth.3176.
- Callahan, B. J., P. J. McMurdie, and S. P. Holmes. 2017. Exact sequence variants should replace operational taxonomic units in marker-gene data analysis. The ISME Journal 11, no. 12: 2639–43. doi:10.1038/ismej.2017.119.
- Callahan, B. J., P. J. McMurdie, M. J. Rosen, A. W. Han, A. J. A. Johnson, and S. P. Holmes. 2016. DADA2: High-resolution sample inference from Illumina amplicon data. Nature Methods 13, no. 7: 581–3. doi:10.1038/nmeth.3869.
- Cook, J. M., A. J. Hodson, A. S. Gardner, M. Flanner, A. J. Tedstone, C. Williamson, M. Tranter, J. Nilsson, R. Bryant, and M. Tranter. 2017. Quantifying bioalbedo: A new physically based model and discussion of empirical methods for characterising biological influence on ice and snow albedo. The Cryosphere 11, no. 6: 2611–32. doi:10.5194/tc-11-2611-2017.
- Cornforth, D. M., and K. R. Foster. 2013. Competition sensing: The social side of bacterial stress responses. Nature Reviews Microbiology 11, no. 4: 285–93. doi:10.1038/nrmicro2977.
- Davey, M. P., L. Norman, P. Sterk, M. Huete‐Ortega, F. Bunbury, B. K. W. Loh, S. Stockton, L.S. Peck, P. Convey, K.K. Newsham, and A. G. Smith. 2019. Snow algae communities in Antarctica: Metabolic and taxonomic composition. New Phytologist 222, no. 3: 1242–55. doi:10.1111/nph.15701.
- Edwards, H. G., L. F. De Oliveira, C. S. Cockell, J. C. Ellis-Evans, and D. D. Wynn-Williams. 2004. Raman spectroscopy of senescing snow algae: Pigmentation changes in an Antarctic cold desert extremophile. International Journal of Astrobiology 3, no. 2: 125–9. doi:10.1017/S1473550404002034.
- Engstrom, C. B., K. M. Yakimovich, and L. M. Quarmby. 2020. Variation in snow algae blooms in the coast range of British Columbia. Frontiers in Microbiology 11: 569. doi:10.3389/fmicb.2020.00569.
- Fernández-Gomez, B., M. Richter, M. Schüler, J. Pinhassi, S. G. Acinas, J. M. González, and C. Pedros-Alio. 2013. Ecology of marine Bacteroidetes: A comparative genomics approach. The ISME Journal 7, no. 5: 1026–37. doi:10.1038/ismej.2012.169.
- Fogg, G. E. 1967. Observations on the snow algae of the South Orkney islands. Philosophical Transactions of the Royal Society of London. Series B, Biological Sciences 252, no. 777: 279–87.
- Ganey, G. Q., M. G. Loso, A. B. Burgess, and R. J. Dial. 2017. The role of microbes in snowmelt and radiative forcing on an Alaskan icefield. Nature Geoscience 10, no. 10: 754–9. doi:10.1038/ngeo3027.
- Gómez‐Pereira, P. R., M. Schüler, B. M. Fuchs, C. Bennke, H. Teeling, J. Waldmann, M. Richter, V. Barbe, E. Bataille, F.O. Glöckner, and R. Amann. 2012. Genomic content of uncultured Bacteroidetes from contrasting oceanic provinces in the North Atlantic Ocean. Environmental Microbiology 14, no. 1: 52–66. doi:10.1111/j.1462-2920.2011.02555.x.
- Gorton, H. L., and T. C. Vogelmann. 2003. Ultraviolet radiation and the Snow Alga Chlamydomonas nivalis (Bauer) Wille. Photochemistry and Photobiology 77, no. 6: 608–15. doi:10.1562/0031-8655(2003)0770608URATSA2.0.CO2.
- Gorton, H. L., W. E. Williams, and T. C. Vogelmann. 2001. The light environment and cellular optics of the Snow Alga Chlamydomonas nivalis (Bauer) Wille. Photochemistry and Photobiology 73, no. 6: 611–20. doi:10.1562/0031-8655(2001)073<0611:TLEACO>2.0.CO;2.
- Grinde, B. 1983. Vertical distribution of the snow alga Chlamydomonas nivalis (Chlorophyta, Volvocales). Polar Biology 2, no. 3: 159–62.
- Hagedorn, B., and A. Flower. 2021. Conifer establishment and encroachment on subalpine meadows around Mt. Baker, WA, USA. Forests 12, no. 10: 1390. doi:10.3390/f12101390.
- Hamilton, T. L., and J. Havig. 2017. Primary productivity of snow algae communities on stratovolcanoes of the Pacific Northwest. Geobiology 15, no. 2: 280–95. doi:10.1111/gbi.12219.
- Hamilton, T. L., and J. R. Havig. 2020. Inorganic carbon addition stimulates snow algae primary productivity. The ISME Journal 14, no. 3: 857–60. doi:10.1038/s41396-018-0048-6.
- Hansen, J., and L. Nazarenko. 2004. Soot climate forcing via snow and ice albedos. Proceedings of the National Academy of Sciences 101, no. 2: 423–8. doi:10.1073/pnas.2237157100.
- Hanzhi, L., L. Yantao, and R. T. Hill. 2022. Microalgal and bacterial auxin biosynthesis: Implications for algal biotechnology. Current Opinion in Biotechnology 73: 300–7. doi:10.1016/j.copbio.2021.09.006.
- Harper, J. T. 1993. Glacier terminus fluctuations on Mount Baker, Washington, U.S.A., 1940–1990, and climatic variations. Arctic and Alpine Research 25, no. 4: 332–40. doi:10.2307/1551916.
- Havig, J. R., and T. L. Hamilton. 2019. Snow algae drive productivity and weathering at volcanic rock-hosted glaciers. Geochimica et Cosmochimica Acta 247: 220–42. doi:10.1016/j.gca.2018.12.024.
- Hisakawa, N., S. D. Quistad, E. R. Hester, D. Martynova, H. Maughan, E. Sala, F. Rohwer, and F. Rohwer. 2015. Metagenomic and satellite analyses of red snow in the Russian Arctic. PeerJ 3: e1491. doi:10.7717/peerj.1491.
- Hodson, A. J., A. Nowak, J. Cook, M. Sabacka, E. S. Wharfe, D. A. Pearce, G. Vieira, and G. Vieira. 2017. Microbes influence the biogeochemical and optical properties of Maritime Antarctic snow. Journal of Geophysical Research: Biogeosciences 122, no. 6: 1456–70. doi:10.1002/2016JG003694.
- Hoham, R. W. 1974a. Chlainomonas Kolii (Hardy Et Curl) Comb. Nov. (Chlorophyta, Volvocales), a revision of the snow alga, trachelomonas Kolii hardy et curl (Euglenophyta, Euglenales) 1, 2. Journal of Phycology 10, no. 4: 392–6.
- Hoham, R. W. 1974b. New findings in the life history of the snow alga, Chlainomonas rubra (Stein et Brook) comb. nov. (Chlorophyta, Volvocales). Syesis 7: 239–47.
- Hoham, R. W., J. D. Berman, H. S. Rogers, J. H. Felio, J. B. Ryba, and P. R. Miller. 2006. Two new species of green snow algae from upstate New York, Chloromonas chenangoensis sp. nov. and Chloromonas tughillensis sp. nov. (Volvocales, Chlorophyceae) and the effects of light on their life cycle development. Phycologia 45, no. 3: 319–30. doi:10.2216/04-103.1.
- Hoham, R. W., and B. Duval. 2001. Microbial ecology of snow and freshwater ice with emphasis on snow algae. In Snow ecology. An interdisciplinary examination of snow-covered ecosystems, ed. H. G. Jones, J. W. Pomeroy, D. A. Walker, and R. W. Hoham, 168–228. Cambridge: Cambridge University Press.
- Hoham, R. W., and H. U. Ling. 2000. Snow algae: The effects of chemical and physical factors on their life cycles and populations. In Journey to diverse microbial worlds: Adaptation to exotic environments, ed. J. Seckbach, 131–145. Dordrecht: Springer Netherlands.
- Hoham, R. W., and J. E. Mullet. 1977. The life history and ecology of the snow alga Chloromonas cryophila sp. nov.(Chlorophyta, Volvocales). Phycologia 16, no. 1: 53–68. doi:10.2216/i0031-8884-16-1-53.1.
- Hoham, R. W., and D. Remias. 2020. Snow and glacial algae: A review1. Journal of Phycology 56, no. 2: 264–82. doi:10.1111/jpy.12952.
- Holzinger, A., M. C. Allen, and D. D. Deheyn. 2016. Hyperspectral imaging of snow algae and green algae from aeroterrestrial habitats. Journal of Photochemistry and Photobiology B: Biology 162: 412–20. doi:10.1016/j.jphotobiol.2016.07.001.
- Hotaling, S., E. Hood, and T. L. Hamilton. 2017. Microbial ecology of mountain glacier ecosystems: Biodiversity, ecological connections and implications of a warming climate. Environmental Microbiology 19, no. 8: 2935–48. doi:10.1111/1462-2920.13766.
- Huovinen, P., J. Ramírez, and I. Gómez. 2018. Remote sensing of albedo-reducing snow algae and impurities in the Maritime Antarctica. ISPRS Journal of Photogrammetry and Remote Sensing 146: 507–17. doi:10.1016/j.isprsjprs.2018.10.015.
- Jacobsen, D., A. M. Milner, L. E. Brown, and O. Dangles. 2012. Biodiversity under threat in glacier-fed river systems. Nature Climate Change 2, no. 5: 361–4. doi:10.1038/nclimate1435.
- Ji, M., W. Kong, H. Jia, C. Ding, A. M. Anesio, Y. Wang, and Y. G. Zhu. 2022. Similar heterotrophic communities but distinct interactions supported by red and green‐snow algae in the Antarctic Peninsula. New Phytologist 233, no. 3: 1358–68. doi:10.1111/nph.17764.
- Jones, H. G., J. W. Pomeroy, D. A. Walker, and R. W. Hoham, Eds. 2001. Snow ecology: An interdisciplinary examination of snow-covered ecosystems. Cambridge: Cambridge University Press.
- Kawecka, B. 1981. Biology and ecology of snow algae. Acta Hydrobiol 23: 211–5.
- Kawecka, B. 1986. Ecology of snow algae. Polish Polar Research 7, no. 4: 407–415.
- Kopylova, E., L. Noé, and H. Touzet. 2012. SortMeRNA: Fast and accurate filtering of ribosomal RNAs in metatranscriptomic data. Bioinformatics 28, no. 24: 3211–7. doi:10.1093/bioinformatics/bts611.
- Krug, L., A. Erlacher, K. Markut, G. Berg, and T. Cernava. 2020. The microbiome of alpine snow algae shows a specific inter-kingdom connectivity and algae-bacteria interactions with supportive capacities. The ISME Journal 14, no. 9: 2197–210. doi:10.1038/s41396-020-0677-4.
- Lang, N. J. 1968. Electron microscopic studies Of extraplastidic Astaxanthin in Haematococcus 1 2. Journal of Phycology 4, no. 1: 12–19. doi:10.1111/j.1529-8817.1968.tb04670.x.
- Letcher, P. M., M. J. Powell, and W. J. Davis. 2015. A new family and four new genera in Rhizophydiales (Chytridiomycota). Mycologia 107, no. 4: 808–30. doi:10.3852/14-280.
- Leya, T. 2013. Snow algae: Adaptation strategies to survive on snow and ice. In Polyextremophiles, eds. J. Seckbach, A. Oren, and H. Stan-Lotter, 401–23. Dordrecht: Springer.
- Lutz, S., A. M. Anesio, A. Edwards, and L. G. Benning. 2015. Microbial diversity on Icelandic glaciers and ice caps. Frontiers in Microbiology 6: 307. doi:10.3389/fmicb.2015.00307.
- Lutz, S., A. M. Anesio, A. Edwards, and L. G. Benning. 2017. Linking microbial diversity and functionality of Arctic glacial surface habitats. Environmental Microbiology 19, no. 2: 551–65. doi:10.1111/1462-2920.13494.
- Lutz, S., A. M. Anesio, K. Field, and L. G. Benning. 2015. Integrated ‘omics,’ targeted metabolite and single-cell analyses of Arctic snow algae functionality and adaptability. Frontiers in Microbiology 6: 1323. doi:10.3389/fmicb.2015.01323.
- Lutz, S., A. M. Anesio, R. Raiswell, A. Edwards, R. J. Newton, F. Gill, and L. G. Benning. 2016. The biogeography of red snow microbiomes and their role in melting Arctic glaciers. Nature Communications 7, no. 1: 1–9. doi:10.1038/ncomms11968.
- McCabe, G. J., and A. G. Fountain. 2013. Glacier variability in the conterminous United States during the twentieth century. Climatic Change 116, no. 3: 565–77. doi:10.1007/s10584-012-0502-9.
- McMurdie, P. J., and S. Holmes. 2013. phyloseq: An R package for reproducible interactive analysis and graphics of microbiome census data. PloS One 8, no. 4: e61217. doi:10.1371/journal.pone.0061217.
- Mikucki, J. A., and J. C. Priscu. 2007. Bacterial diversity associated with Blood Falls, a subglacial outflow from the Taylor Glacier, Antarctica. Applied and Environmental Microbiology 73, no. 12: 4029–39. doi:10.1128/AEM.01396-06.
- Ming, J., C. Xiao, H. Cachier, D. Qin, X. Qin, Z. Li, and J. Pu. 2009. Black Carbon (BC) in the snow of glaciers in west China and its potential effects on albedos. Atmospheric Research 92, no. 1: 114–23. doi:10.1016/j.atmosres.2008.09.007.
- Murakami, T., T. Segawa, D. Bodington, R. Dial, N. Takeuchi, S. Kohshima, and Y. Hongoh. 2015. Census of bacterial microbiota associated with the glacier ice worm Mesenchytraeus solifugus. FEMS Microbiology Ecology 91(3). doi:10.1093/femsec/fiv003
- Musilova, M., M. Tranter, J. L. Bamber, N. Takeuchi, and A. M. Anesio. 2016. Experimental evidence that microbial activity lowers the albedo of glaciers. Geochemical Perspectives Letters 2: 106–16. doi:10.7185/geochemlet.1611.
- Natural Resources Conservation Service. 2023. NWCC report generator, Schreibers Meadow station 21A10. National Water and Climate Center. Retrieved January 3, 2023, from https://wcc.sc.egov.usda.gov/reportGenerator/view/customSingleStationReport,metric/monthly/start_of_period/21A10:WA:SNOW%7Cid=%22%22%7Cname/2010-01-01,2023-01-03/WTEQ::collectionDate,WTEQ::value,WTEQ::median_1991,WTEQ::pctOfMedian_1991,SNWD::value,SNWD::median_1991,SNWD::pctOfMedian_1991?fitToScreen=false
- Overbeek, R., R. Olson, G. D. Pusch, G. J. Olsen, J. J. Davis, T. Disz, S. Gerdes, B. Parrello, M. Shukla, V. Vonstein, and R. Stevens. 2014. The SEED and the rapid annotation of microbial genomes using subsystems technology (RAST). Nucleic Acids Research 42, no. D1: D206–D214. doi:10.1093/nar/gkt1226.
- Pitkaranta, M., T. Meklin, A. Hyvarinen, L. Paulin, P. Auvinen, A. Nevalainen, and H. Rintala. 2008. Analysis of fungal flora in indoor dust by ribosomal DNA sequence analysis, quantitative PCR, and culture. Applied and Environmental Microbiology 74, no. 1: 233–44.
- Procházková, L., T. Leya, H. Křížková, and L. Nedbalová. 2019. Sanguina nivaloides and Sanguina aurantia gen. et spp. nov. (Chlorophyta): The taxonomy, phylogeny, biogeography and ecology of two newly recognised algae causing red and orange snow. FEMS Microbiology Ecology 95, no. 6: fiz064. doi:10.1093/femsec/fiz064.
- Pruitt, K. D., T. Tatusova, and D. R. Maglott. 2007. NCBI reference sequences (RefSeq): A curated non-redundant sequence database of genomes, transcripts and proteins. Nucleic Acids Research 35, no. suppl_1: D61–D65. doi:10.1093/nar/gkl842.
- Quast, C., E. Pruesse, P. Yilmaz, J. Gerken, T. Schweer, P. Yarza, F. O. Glöckner, and F. O. Glöckner. 2012. The SILVA ribosomal RNA gene database project: Improved data processing and web-based tools. Nucleic Acids Research 41, no. D1: D590–D596. doi:10.1093/nar/gks1219.
- R Core Team. 2021. R: A language and environment for statistical computing, Vienna, Austria: R Foundation for Statistical Computing. https://www.R-project.org/.
- Remias, D. 2012. Cell structure and physiology of alpine snow and ice algae. In Plants in alpine regions, ed. C. Lütz, 175–85. Vienna: Springer.
- Remias, D., U. Lütz-Meindl, and C. Lütz. 2005. Photosynthesis, pigments and ultrastructure of the alpine snow alga Chlamydomonas nivalis. European Journal of Phycology 40, no. 3: 259–68. doi:10.1080/09670260500202148.
- Remias, D., H. Wastian, C. Lütz, and T. Leya. 2013. Insights into the biology and phylogeny of Chloromonas polyptera (Chlorophyta), an alga causing orange snow in Maritime Antarctica. Antarctic Science 25, no. 5: 648–56. doi:10.1017/S0954102013000060.
- Riedel, J. L., and M. A. Larrabee. 2016. Impact of recent glacial recession on summer streamflow in the Skagit River. Northwest Science 90, no. 1: 5–22. doi:10.3955/046.090.0103.
- Rosa, K. A. 2016. One hundred years of vegetation succession in the Easton glacial foreland, Mount Baker, Washington. WWU Graduate School Collection. 506. https://cedar.wwu.edu/wwuet/506
- Rosenberg, E. 2014. “The family Chitinophagaceae” in the prokaryotes, eds. E. Rosenberg, E. F. DeLong, S. Lory, E. Stackebrandt, and F. Thompson. Heidelberg, Germany: Springer. 493–5.
- Schuler, C. G., J. R. Havig, and T. L. Hamilton. 2017. Hot spring microbial community composition, morphology, and carbon fixation: Implications for interpreting the ancient rock record. Frontiers in Earth Science 5: 97. doi:10.3389/feart.2017.00097.
- Simmons, D. R., A. E. Bonds, B. T. Castillo, R. A. Clemons, A. D. Glasco, J. M. Myers, N. Thapa, P.M. Letcher, M.J. Powell, J.E. Longcore, and T. Y. James. 2020. The Collection of Zoosporic Eufungi at the University of Michigan (CZEUM): Introducing a new repository of barcoded Chytridiomyceta and Blastocladiomycota cultures. IMA Fungus 11, no. 1: 1–22. doi:10.1186/s43008-020-00041-z.
- Soto, D. F., R. Fuentes, P. Huovinen, and I. Gómez. 2020. Microbial composition and photosynthesis in Antarctic snow algae communities: Integrating metabarcoding and pulse amplitude modulation fluorometry. Algal Research 45: 101738. doi:10.1016/j.algal.2019.101738.
- Spijkerman, E., A. Wacker, G. Weithoff, and T. Leya. 2012. Elemental and fatty acid composition of snow algae in Arctic habitats. Frontiers in Microbiology 3: 380. doi:10.3389/fmicb.2012.00380.
- Stibal, M., J. A. Bradley, A. Edwards, S. Hotaling, K. Zawierucha, J. Rosvold, S. Lutz, et al. 2020. Glacial ecosystems are essential to understanding biodiversity responses to glacier retreat. Nature Ecology & Evolution 4, no. 5: 686–7. doi:10.1038/s41559-020-1163-0.
- Stibal, M., J. Elster, M. Šabacká, and K. Kaštovská. 2007. Seasonal and diel changes in photosynthetic activity of the snow alga Chlamydomonas nivalis (Chlorophyceae) from Svalbard determined by pulse amplitude modulation fluorometry. FEMS Microbiology Ecology 59, no. 2: 265–73. doi:10.1111/j.1574-6941.2006.00264.x.
- Stibal, M., M. Šabacká, and J. Žárský. 2012. Biological processes on glacier and ice sheet surfaces. Nature Geoscience 5, no. 11: 771–4. doi:10.1038/ngeo1611.
- Takeuchi, N., R. Dial, S. Kohshima, T. Segawa, and J. Uetake. 2006. Spatial distribution and abundance of red snow algae on the Harding Icefield, Alaska derived from a satellite image. Geophysical Research Letters 33(21). doi:10.1029/2006GL027819
- Thomas, W. H. 1972. Observations on snow algae in California 1, 2. Journal of Phycology 8, no. 1: 1–9.
- Thomas, W. H., and B. Duval. 1995. Sierra Nevada, California, USA, snow algae: Snow albedo changes, algal-bacterial interrelationships, and ultraviolet radiation effects. Arctic and Alpine Research 27, no. 4: 389–99. doi:10.2307/1552032.
- Westreich, S. T., M. L. Treiber, D. A. Mills, I. Korf, and D.G. Lemay. 2018. SAMSA2: A standalone metatranscriptome analysis pipeline. BMC Bioinformatics 19, no. 1: 175. doi:10.1186/s12859-018-2189-z.
- Whelan, P., and A. J. Bach. 2017. Retreating glaciers, incipient soils, emerging forests: 100 years of landscape change on Mount Baker, Washington, USA. Annals of the American Association of Geographers 107, no. 2: 336–49. doi:10.1080/24694452.2016.1235480.
- Wickham, M. H. 2016. ggplot2: Elegant graphics for data analysis. New York: Springer-Verlag. https://ggplot2.tidyverse.org.
- Wick, R. R., L. M. Judd, and K. E. Holt. 2019. Performance of neural network basecalling tools for oxford nanopore sequencing. Genome Biology 20: 129. doi:10.1186/s13059-019-1727.
- Wilhelm, L., G. A. Singer, C. Fasching, T. J. Battin, and K. Besemer. 2013. Microbial biodiversity in glacier-fed streams. The ISME Journal 7, no. 8: 1651–60. doi:10.1038/ismej.2013.44.
- Williams, W. E., H. L. Gorton, and T. C. Vogelmann. 2003. Surface gas-exchange processes of snow algae. Proceedings of the National Academy of Sciences 100, no. 2: 562–6. doi:10.1073/pnas.0235560100.
- Wilson, A. C., A. W. Nolin, and K. D. Bladon. 2021. Assessing the role of snow cover for post‐wildfire revegetation across the Pacific Northwest. Journal of Geophysical Research: Biogeosciences 126, no. 11: e2021JG006465.
- Yakimovich, K. M., C. B. Engstrom, and L. M. Quarmby. 2020. Alpine snow algae microbiome diversity in the Coast Range of British Columbia. Frontiers in Microbiology 11: 1721. doi:10.3389/fmicb.2020.01721.
- Zhang, L., F. Su, C. Zhang, F. Gong, and J. Liu. 2017. Changes of photosynthetic behaviors and photoprotection during cell transformation and astaxanthin accumulation in Haematococcus pluvialis grown outdoors in tubular photobioreactors. International Journal of Molecular Sciences 18, no. 1: 33. doi:10.3390/ijms18010033.
- Zhu, C., M. Miller, N. Lusskin, B. Bergk Pinto, L. Maccario, M. Häggblom, T. Vogel, C. Larose, and Y. Bromberg. 2020. Snow microbiome functional analyses reveal novel aspects of microbial metabolism of complex organic compounds. MicrobiologyOpen 9, no. 9: e1100. doi:10.1002/mbo3.1100.